


Neuronal subtype–specific ribosomal protein mRNA expression
- Joaquín Garat1,
- Sofía Niño-Rivero2,
- Patricia Lagos2,
- Andrés Di Paolo1,6,7,
- Pablo Smircich3,4 and
- José Sotelo-Silveira1,5
- 1Departamento de Genómica, Instituto de Investigaciones Biológicas Clemente Estable, Montevideo 11600, Uruguay
- 2Unidad Académica de Fisiología, Facultad de Medicina, Universidad de la República, Montevideo 11800, Uruguay
- 3Laboratorio de Bioinformática, Departamento de Genómica, Instituto de Investigaciones Biológicas Clemente Estable, Montevideo 11600, Uruguay
- 4Sección Genómica Funcional, Facultad de Ciencias, Universidad de la República, Montevideo 11400, Uruguay
- 5Departamento de Biología Celular y Molecular, Facultad de Ciencias, Universidad de la República, Montevideo 11400, Uruguay
- Corresponding author: jsotelosilveira{at}iibce.edu.uy
-
Handling editor: Fatima Gebauer
Abstract
Current understanding recognizes that ribosomal proteins (RPs) have regulatory roles beyond their canonical structural functions in translation, raising the question of how their expression is organized across cell types. Given the diversity of neuronal cell types, understanding RP gene expression at the neuronal subtype level is an important and previously inaccessible question. Here, leveraging advances in single-cell transcriptomics, we analyzed single-cell RNA-seq data sets from the mouse cerebral cortex and hippocampus to examine RP mRNA expression across neuronal subtypes. We observed distinct RP mRNA expression profiles between excitatory and inhibitory neurons and found that higher Rps27 transcript levels in inhibitory neurons corresponded to increased RPS27 protein abundance. Beyond excitatory-inhibitory differences, RP mRNA expression further segregated across well-defined neuronal subclasses, with 59 of 84 RP genes differentially expressed, including enrichment of Rpl21 in Lamp5 and Rps27 in Vip interneurons. These patterns were consistent across cortical regions and reproducible across two independent single-cell technologies (Smart-seq2 and 10x Genomics). Analysis of aging- and stress-associated data sets revealed stable RP expression signatures, with limited phenotype-linked changes. Together, we present a comprehensive atlas of ribosomal protein gene expression at neuronal subclass resolution, revealing robust subclass-specific transcriptional signatures, suggesting an underestimated regulatory layer.
Keywords
INTRODUCTION
Ribosomes are essential cellular components responsible for protein synthesis in all domains of life. In mammals, they are composed of 80 ribosomal proteins (RPs) and four ribosomal RNAs assembled into the asymmetrical 40S and 60S subunits within the nucleolus (Taylor et al. 2009b).
Given the importance of precise synthesis and availability of ribosomes in cells, multiple regulatory layers exist for the production of ribosome components. Specifically, RP synthesis is intricately regulated at transcriptional, posttranscriptional, translational, and posttranslational levels (Petibon et al. 2021). Notably, mRNA abundance studies, mainly using RNA sequencing (RNA-seq), have shown that the expression profiles of RP-encoding genes differ across tissues in mice (Kondrashov et al. 2011), humans (Bortoluzzi et al. 2001; Gupta and Warner 2014; Guimaraes and Zavolan 2016), and human cancer cell lines (Guimaraes and Zavolan 2016).
RNA-seq and RT-PCR experiments have also revealed tissue- and condition-specific expression of certain RP paralogs. In yeast, 59 RP genes have paralogs (Segev and Gerst 2018), and differential expression of several paralogs under stress conditions has been reported (Parenteau et al. 2015; Ghulam et al. 2020). Although to a lesser extent, mammals also possess paralogous RP genes; for example, mice have at least seven, while humans have at least 10 (Kyritsis et al. 2020). In humans, Rpl3l is overexpressed in the heart and skeletal muscle, whereas Rpl3 shows low expression in these tissues (Guimaraes and Zavolan 2016). Studies of cellular differentiation from mouse and human embryonic stem cells (ESCs) to neural progenitor cells (NPCs) have shown significant changes in the expression of the paralogs Rpl10l and Rpl39l (Wong et al. 2014). Additionally, Rpl39l is overexpressed in multiple cancer cell lines (Nadano et al. 2002). The advent of single-cell RNA sequencing (scRNA-seq) now allows analysis of RP gene expression in specific cellular subtypes. Reanalysis of available scRNA-seq data recently revealed cell type–specific expression patterns for the paralogs Rps27 and Rps27l in normal mouse tissues (Xu et al. 2023).
This transcriptional complexity is mirrored at the protein level by a growing appreciation for the functional diversity of RPs themselves. Indeed, recent studies have challenged our understanding of ribosome biogenesis, composition, and function. This challenge manifests in two key areas. First, many RPs have been found to display extraribosomal functions beyond their canonical role, including regulation of their own synthesis and incorporation into other protein complexes (Wool 1996; Lindström 2009; Warner and McIntosh 2009; Lu et al. 2015; Das et al. 2025). Second, the concept of a uniform ribosome pool is being replaced by widespread evidence of ribosome heterogeneity. This heterogeneity can arise from ribosomal RNA sequence variants (Parks et al. 2018; Rothschild et al. 2024) and modifications (Sloan et al. 2017; Rajan et al. 2023), RP modifications (Carroll et al. 2008; Simsek et al. 2017), differential incorporation of specific RP paralogs (Ghulam et al. 2020, Xu et al. 2023), variations in RP stoichiometry (Slavov et al. 2015; Shi et al. 2017), as well as from the association of ribosome-associated factors (Simsek et al. 2017; Susanto et al. 2024), although the functional relevance of ribosome heterogeneity remain an active area of investigation (Ferretti and Karbstein 2019; Papagiannopoulos et al. 2022).
This multilayered complexity is particularly critical in neurons. Although most RPs assemble into ribosomal subunits in the nucleolus, in neurons, their corresponding mRNAs have been detected in axons and dendrites (Willis et al. 2007; Taylor et al. 2009a; Zivraj et al. 2010; Gumy et al. 2011; Saal et al. 2014; Briese et al. 2016; Bigler et al. 2017; Rotem et al. 2017; Tóth et al. 2018; Farias et al. 2020). This raises questions about their potential local functions, such as the reported incorporation of RPs into ribosome subunits in both dendrites (Fusco et al. 2021) and axons (Shigeoka et al. 2019), which may contribute to ribosome repair or remodeling. Moreover, the presence of ribosome biogenesis factors and preribosomal RNA in neuronal processes suggests the possibility of local ribosome maturation (Fusco et al. 2025). This functional complexity, combined with the vast diversity of neuronal subtypes, each with highly specialized subcellular compartments, makes neurons an attractive model for studying the regulation of RP expression. This is further supported by the fact that several neurological disorders may be considered ribosomopathies (Venturi and Montanaro 2020) and RP gene expression has been reported to be altered in depression and chronic stress (Zhang et al. 2023), neurodevelopmental disorders (Seo et al. 2022), and in various types of dementia including Alzheimer's disease (Hernández-Ortega et al. 2016) and frontotemporal dementia (Evans et al. 2021).
The evidence for transcriptional and functional ribosome heterogeneity is growing (Shi et al. 2017; Genuth et al. 2022; Li et al. 2022; Beavan et al. 2025). This is particularly relevant in the nervous system, given its vast cellular diversity and the links between RP dysregulation and neurological disorders. Together, this raises a key question: Do different neuronal subtypes exhibit distinct and stable ribosomal protein expression signatures? To address this at an unprecedented resolution, we leveraged large-scale public scRNA-seq data sets. We first systematically characterized RP expression across all neuronal subclasses of the mouse cortex and hippocampus using a comprehensive single-cell data set of these regions (Yao et al. 2021). Next, to determine if these expression patterns are a stable feature of neuronal identity or if they can be modulated by physiological perturbations, we further analyzed data from studies on aging (Jin et al. 2025) and stress vulnerability (Hing et al. 2024). Finally, as a proof of principle, we confirmed that one of our key transcriptomic findings is reflected at the protein level, showing higher Rps27 levels in GABAergic neurons compared to glutamatergic neurons at the cortex. Overall, our study reveals the existence of neuron subtype–specific RP gene expression patterns. We demonstrated that the expression of the ribosomal machinery is finely tuned to neuronal identity, establishing a new layer of gene expression regulation crucial for understanding specialized cellular functions in health and disease.
RESULTS
RP gene expression: overall stability coexists with neuronal subclass–specific signatures
To determine whether RP gene expression is stable—that is, consistently detected at similar levels across neurons—or instead varies systematically between neuronal subclasses, we analyzed the large-scale single-cell RNA-seq data set generated by Yao and collaborators in 2021 (Yao et al. 2021), which provides both high cellular resolution and deep sequencing coverage. The authors reported transcriptomes of ∼1.3 million neurons from all cortical and hippocampal regions described in mice. Of these, 1,228,636 transcriptomes were obtained with 10x Genomics and 76,381 with Smart-seq2. After applying our quality filtering criteria, the Smart-seq2 data set contained 11 brain regions (Fig. 1A), and the 10x data set contained eight brain regions (Fig. 1B), each with transcriptomes from thousands of single cells. The large number of cells enables the detection of low-abundance neuronal subtypes, and the high sequencing depth (mainly in the Smart-seq2 data set) provides high confidence in gene expression measurement, also allowing the detection of genes expressed at low levels. We reprocessed the final count matrices using a standard single-cell analysis workflow. This reanalysis, which included quality control, filtering, and normalization, allowed us to visualize and confirm the neuronal subclass classifications for both the Smart-seq2 (Fig. 1C) and 10x (Fig. 1D) data sets. After reproducing the neuronal type classification, we adopted the authors’ original nomenclature for consistency and clarity. The Smart-seq2 data set contains 50,447 neurons across the 11 regions, classified into two classes and 20 subclasses, derived from a total of 488 mice. Transcriptomes were sequenced at high depth, with most cells having 500k to 2m aligned reads (Supplemental Fig. S1A) and an average of 10,541 genes detected per cell (Supplemental Fig. S1C). The 10x Genomics data set consists of 697,166 neuronal transcriptomes classified into two classes and 20 subclasses, obtained from 29 mice. In contrast to the Smart-seq2 data set, the 10x Genomics data set was sequenced at a lower average depth due to the method's intrinsic lower sensitivity, yielding ∼15k UMIs per cell (Supplemental Fig. S1B) and an average of 4000 genes detected per cell (Supplemental Fig. S1D). Smart-seq2 transcriptomes showed high detection of RP mRNAs, allowing us to detect all 84 RP genes expressed in most cells (Fig. 1E). In contrast, the 10x Genomics data set's lower sensitivity and sequencing depth resulted in fewer detected RP genes per cell (Fig. 1F). We next monitored the total abundance of mRNA encoding ribosomal proteins by summing the normalized expression levels for all 84 RP genes on our list and analyzing their distribution by neuronal subclass. In both data sets, we observed that most neuronal subclasses exhibit a similar global abundance of ribosomal gene expression (Fig. 1G,H), although DG (Smart-seq2 data set) and Sst Chodl (10x data set) neurons showed a slightly higher global abundance of ribosomal genes, potentially reflecting technology-specific differences in normalization or detection sensitivity for these specific cell types. Since not all RP genes were detected across cell types in the 10x Genomics data set, we focused our primary analysis on the Smart-seq2 data set and later compared the results between technologies.
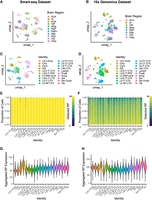
Mapping neuronal subtypes in Smart-seq2 and 10x Genomics data sets highlights differential sensitivity for RP gene detection. (A–D) UMAP visualizations of neuronal cells colored by brain region of origin (A,B) or neuronal subclass (C,D) from the Smart-seq2 (A,C) and 10x Genomics (B,D) data sets. (E,F) Bar plots showing the number of ribosomal protein (RP) genes detected per cell across major neuronal subclasses, in the Smart-seq2 data set (E) and in the 10x Genomics data set (F). (G,H) Violin plots showing the distribution of the summed normalized expression of all 84 RP genes within individual cell types for the Smart-seq2 (G) and 10x Genomics (H) data sets. Brain region abbreviations shown in A and B are as follows: (VISp) primary visual cortex, (VIS) visual cortex, (SSs) supplemental somatosensory cortex, (SSp) primary somatosensory cortex, (RSPv) ventral retrosplenial cortex, (RSP) retrosplenial cortex, (MOp) primary motor cortex, (HIP) hippocampus, (ALM) anterior lateral motor cortex, (AI) agranular insular cortex, (ACA) anterior cingulate area.
To investigate the variability in RP gene expression across neuronal types, we first applied principal component analysis (PCA) to the Smart-seq2 data set using only RP genes (Supplemental Fig. S2A). We then used the first eight significant principal components to construct a k-nearest neighbor (KNN) graph. This graph was subsequently clustered using the Louvain algorithm with a low resolution parameter to deliberately identify biologically meaningful groups. The resulting clusters were visualized via UMAP. Remarkably, despite relying solely on RP genes, the resulting clusters showed a clear correspondence with major neuronal classes (Fig. 2A; Supplemental Fig. S2B), with Clusters 0 and 2 being predominantly glutamatergic (94% and 85%, respectively) and Cluster 1 being mainly composed of GABAergic neurons (74%). Thus, while RP gene expression alone was insufficient for a finer classification of neuronal subtypes (Supplemental Fig. S2C), it revealed clear patterns of variability that correlate with the broad glutamatergic and GABAergic neuronal classification.
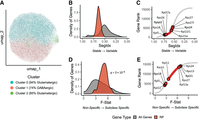
Ribosomal protein genes are stably expressed but show neuron subclass–specific signatures in the Smart-seq2 data set. (A) UMAP visualization of unsupervised clustering based solely on the expression of 84 RP genes. The analysis identifies three clusters that show a strong separation between predominantly GABAergic (Cluster 1) and glutamatergic (Clusters 0 and 2) neurons. (B) Density plot comparing the expression stability index (SegIdx) for all detected genes (gray) versus only RP genes (red). Higher SegIdx values (near 1) indicate more stable gene expression. Note that the x-axis is reversed (ranging from 1 to 0) to facilitate visual comparison with the F-statistic plot in D. (C) Ranked plot of SegIdx values for all genes. The top five most stable and most variable RP genes are highlighted. (D) Density plot comparing the F-statistic, a measure of neuron subclass–specific expression, for all genes (gray) versus RP genes (red). Higher F-statistic values indicate greater subclass specificity. The P-value from a one-sided Wilcoxon rank-sum test assessing whether RP genes show significantly higher F-statistics than the global gene distribution is indicated. (E) Ranked plot of F-statistic values for all genes. The top five most and least subclass-specific RP genes are highlighted.
To systematically characterize the expression variability of ribosomal protein (RP) genes, we calculated key metrics for gene expression variability and stability using the scSegIndex method (Lin et al. 2019a). This method provides metrics such as the F-statistic, which quantifies the strength of gene expression association with a predefined cell type, that is, a neuronal subclass, and a general stability index (SegIdx). The latter is a composite score that averages the normalized ranks of four features: the F-statistic itself, expression variance, unimodality, and a regularized dropout rate. By design, this index ranges from 0 (lowest stability) to 1 (highest stability). The SegIdx distribution for RP genes is shifted toward higher values (near 1.0) compared to all genes (Fig. 2B), suggesting that RP genes are, as a group, more stably expressed. However, despite this global stability, we found significant variability at the individual gene level. Indeed, the ranked plot of SegIdx values (Fig. 2C) shows that some RP genes have stability scores similar to the average gene (close to 0.5). The top five least stable RP genes were Rps27, Rps27l, Rps24, Rpl22l1, and Rps15a. To test whether RP gene expression variability is associated with neuronal subclass identity, we analyzed the F-statistic distributions (Fig. 2D). This analysis revealed that RP genes show a greater association with neuronal subclass identity than the average gene, evident as a clear right-shift toward higher F-statistics (indicating greater expression differences between subclasses). To formally test the rightward shift of RP F-statistics observed in Figure 2D, we compared the distribution of gene‐level median F‐statistics for RP genes versus all other genes using a one‐sided Wilcoxon rank‐sum test. This test confirmed significant enrichment of higher F‐statistics among RP genes (one‐sided Wilcoxon P = 3 × 10⁻⁸). Therefore, while RP genes as a group are highly stable (Fig. 2B), their individual expression may represent a structured biological signal that correlates with neuronal identity. Notably, F-statistics distributions for RP genes vary across brain regions, likely reflecting differences in the neuronal subclasses analyzed in each region (Supplemental Fig. S2D–N). Region‐wise Wilcoxon tests showed that the rightward shift (i.e., higher RP F‐statistics compared with other genes) is present in most regions, but in RSPv, VIS, AI, and RSP, the RP F‐statistic distributions are not significantly higher than those of other genes. This pattern is consistent with the lower neuronal‐subclass heterogeneity detected in those regions. When analyzing all brain regions together (median F-stats), we identified Rpl22, Rpl5, Rps18, Rack1, and Rpl11 as the least subclass-specific genes and Rps24, Rps13, Rpl21, Rps27, and Rpl13a as the most subclass-specific, which are highlighted in the ranked F-statistic plot (Fig. 2E).
Ribosomal gene expression patterns are a conserved feature of neuronal subtypes across brain regions
Using the Smart-seq2 data set, we analyzed RP gene expression patterns across all neuronal subclasses in various brain regions (Fig. 3A). Hierarchical clustering of RP expression revealed a significant structure that primarily grouped neurons by their major classes (GABAergic vs. glutamatergic) and further segregated them into subclasses, largely independent of brain region of origin (Fig. 3A). The statistical significance of this structure was confirmed using sigClust2, a Monte Carlo simulation test that assigns P-values to each cluster merge, which are displayed on the dendrogram in Supplemental Figure S3A. These observations suggest that RP gene expression shows neuronal subclass–specific patterns. To quantitatively confirm this hypothesis, we calculated the specificity score for each RP gene per subclass by adapting the method from Guimaraes and Zavolan (2016). Briefly, this score quantifies the deviation of a gene expression level in one subclass from its average expression across all subclasses, with positive and negative scores indicating higher and lower expression, respectively. The overall distribution of these scores is shown in Figure 3B, where we set a threshold for subclass-associated variability at 2.5 standard deviations (SD), similarly to the original study. While this method was originally developed to identify tissue-specific RP expression, we applied it here to quantify specificity across neuronal subclasses (regardless of their brain region of origin). Using this approach, we identified 23 genes exhibiting subclass-associated expression variability in at least one neuronal subclass (Supplemental Fig. S3B). These 23 genes are also marked with an asterisk in the main heat map (Fig. 3A). Among these, Rps27 showed enrichment in GABAergic Vip neurons, Rpl21 was enriched in GABAergic Lamp5 and Sst neurons, and Rps24 in glutamatergic L5 NP neurons. We also observed several RPs with paralogs showing subclass-associated expression differences (Rpl22l1, Rps27, Rpl7, and Rpl7l1). For instance, we observed the overexpression of Rpl7 in DG neurons of the hippocampus and the underexpression of Rpl7l1 in the same neurons, indicating a clear asymmetric expression pattern for this neuronal subclass. Taken together, these results indicate subclass-dependent regulation of these mRNA expression levels not only for RP paralogs but also for many other RP genes. Given the potential functional implications of paralog switching, we next focused specifically on their expression patterns.
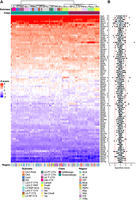
RP expression drives the clustering of major neuronal classes and reveals subclass-specific gene signatures. (A) Heat map showing the Z-score normalized expression of 84 RP genes across different neuronal subclasses and brain regions. Columns are hierarchically clustered based on their RP expression profile, revealing a strong separation between GABAergic and glutamatergic neurons. Annotations indicate the subclass, class, and brain region for each column. Genes identified as subclass-specific in B are marked with an asterisk (*). (B) Boxplots showing the distribution of specificity scores for each RP gene across all neuronal subclasses. The score quantifies the degree to which a gene expression profile is different in specific subclasses. The red dotted lines indicate the threshold used to define specificity (|score| > 2.5). Genes are shown following the same order as in A.
Preferential expression of ribosomal protein paralogs across neuronal subclasses
While most single cells in the Smart-seq2 data set express nearly all of the 84 RP genes, some cells do not show detectable expression of the entire set (Fig. 1E). Notably, among these 84 genes, six represent three pairs of paralogs: Rps27/Rps27l, Rpl7/Rpl7l1, and Rpl22/Rpl22l1. Given recent findings that ribosomes assembled with different paralogs can exhibit differences in mRNA translation preference (Gerst 2018; Malik Ghulam et al. 2022; Shiraishi et al. 2023; Xu et al. 2023), we examined whether these genes are uniformly expressed across all cells or if certain neuronal populations preferentially express one paralog over its counterpart.
By aggregating cells by neuronal subclass, our analysis revealed a clear asymmetry in paralog expression. For each of the three pairs, one paralog (Rpl22l1, Rpl7, and Rps27) showed broadly higher expression across neuronal subclasses, both in terms of the fraction of expressing cells and the average expression level (Fig. 4A). In contrast, their lower-expressed counterparts (Rpl22, Rpl7l1, and Rps27l) were detected in smaller fractions of cells and at lower expression levels across subclasses (Fig. 4A). This robust pattern of preferential paralog usage was consistent across all analyzed brain regions (Supplemental Fig. S4).
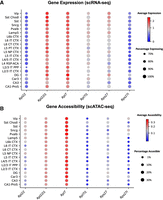
RP paralog expression and chromatin accessibility across neuronal subclasses. (A) Dot plot summarizing the expression patterns for the three RP paralog pairs across neuronal subclasses. The size of each dot corresponds to the percentage of expressing cells, while the color indicates the normalized average expression level. The plot visually confirms that the preferential paralogs are more broadly (larger dots) and highly (redder dots) expressed than their alternative counterparts. (B) Dot plot showing chromatin accessibility for the same paralog pairs across neuronal subclasses, derived from a publicly available scATAC-seq data set (Zu et al. 2023). The size of each dot corresponds to the fraction of nuclei with detected accessible chromatin at the gene locus, and the color indicates mean accessibility expressed as log counts per million (logCPM). In both A and B, the preferentially expressed paralog consistently shows higher expression and greater chromatin accessibility across neuronal subclasses.
To investigate whether these expression differences are accompanied by differences at the chromatin accessibility level, we reanalyzed a publicly available snATAC-seq data set from mouse brain, focusing on the same neuronal subclasses. Consistent with the expression patterns observed in the Smart-seq2 data, the preferentially expressed paralog in each pair exhibited higher chromatin accessibility across subclasses compared to its counterpart (Fig. 4B). The Rpl7/Rpl7l1 pair showed the most pronounced difference, with Rpl7l1 displaying broadly lower accessibility across neuronal subclasses.
Ribosomal proteins exhibit gene-specific and subclass-associated differential expression
We performed differential expression analyses to assess statistically significant differences in RP gene expression between neuronal subclasses in pairwise comparisons. We employed a pseudobulk strategy using DESeq2, treating each mouse as the unit of variation. Differential expression was evaluated at both the neuron class and subclass levels (Table 1; Supplemental Data S1). Our analysis indicates that differences that are not apparent at the broad class level (GABAergic vs. glutamatergic) become evident with more detailed neuronal classification and are most pronounced at the subclass level (Table 1). At the subclass level across all brain regions, the vast majority of RP genes were identified as differentially expressed in at least one pairwise comparison, with a total of 1893 differential expression (DE) events detected. Importantly, we detected substantial differences in DE frequency among RP genes (Fig. 5A), indicating gene‐specific differential expression patterns rather than global RP mRNA increases in certain subclasses. Our analysis revealed that a subgroup of genes—including Rps27, Rpl21, Rpl29, and Rps27l, among others—accounts for the majority of these DE events. Notably, as illustrated in Supplemental Figure S5, the proteins encoded by either Rps27 or its paralog Rps27l—incorporated alternatively into the ribosome—occupy a surface-exposed position, while those encoded by Rpl21 and Rpl29, though less exposed, cluster near the mRNA channel close to the exit tunnel. Moreover, the most variable genes differ by region, likely reflecting differences in neuronal composition; for instance, in the hippocampus and primary motor cortex, Rpl39 and Rps27 emerged as the top candidates, respectively (Supplemental Fig. S6). To further dissect these differences, we calculated overexpression and underexpression scores for each subclass. A high score for a particular RP gene in a given subclass indicates that it was frequently identified as differentially expressed in pairwise comparisons involving that subclass. This approach allowed us to identify which subclasses were driving the observed changes in these variable RP genes (Fig. 5B). Neurons from the same class clustered together according to overexpression and underexpression scores, indicating that most differences arose from comparisons between excitatory and inhibitory neurons. Most of the RP genes with high overexpression scores are from inhibitory neurons, although there are also intraclass differences. Notably, some genes also displayed high underexpression scores in inhibitory neurons (Rpl29 and Rps12) despite an overall trend toward higher RP mRNA abundance in inhibitory neurons. Notably, Rps27 showed a broad enrichment across inhibitory subclasses as a group, in addition to its particularly consistent overexpression in Vip neurons (Fig. 5B). This pattern suggests that Rps27 regulation may operate both at the class level and with subclass-specific nuances. In addition to this broad, class-level trend, we also found RP genes that showed consistent overexpression in specific subclasses. For example, comparisons involving the Lamp5 neuronal subclass consistently showed differential expression of Rpl21. These scores pointed to Rpl21, Rps27, and Rpl29 as major contributors to RP gene expression variability. To further contextualize these differences, we analyzed the types of neuronal comparisons in which they occurred (Fig. 5C). Most differential expression events arose from comparisons between excitatory and inhibitory neurons; however, substantial intraclass variability was also observed, including intra-inhibitory differences for Rpl21 and Rps27 and intra-excitatory differences for Rpl29. Together, these results indicate that RP gene expression variability reflects structured, subclass-associated differences rather than a simple global shift in RP mRNA abundance between inhibitory and excitatory neurons.
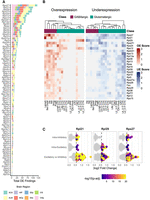
Dissecting the sources of ribosomal protein gene expression variability across neuronal subclasses. (A) Stacked bar chart ranking RP genes by their total number of differential expression (DE) events across all pairwise subclass comparisons. Colors within each bar indicate the contribution of DE events from different brain regions. (B) Heat maps of overexpression scores (red) and underexpression scores (blue) for the 25 most frequently variable RP genes across neuronal subclasses. The score represents the normalized frequency of a gene being significantly up- or downregulated in all comparisons involving a specific subclass. Hierarchical clustering reveals that inhibitory subclasses (e.g., Lamp5, Vip) are primary drivers of overexpression for specific RPs like Rpl21 and Rps27. (C) Scatter plots for the top three most variable RP genes, showing the magnitude [log2(FoldChange)] and statistical significance [color scale; −log10(Padj)] of each DE event. Comparisons are categorized based on whether they occurred within inhibitory subclasses, within excitatory subclasses, or between the two major classes.
Summary of differentially expressed ribosomal protein (RP) genes from the Smart-seq2 data set
Cross-platform analysis confirms robust subclass-specific expression of ribosomal protein genes
To assess the robustness of our findings across different technologies, we performed a comparative differential expression analysis between the Smart-seq2 (Supplemental Data S1) and 10x Genomics (Supplemental Data S2) data sets, focusing only on RP genes. We compared the RP DE events identified by both methods, including only brain regions (ACA, HIP, MOp, SSp, VISp, and VIS) and neuronal subclasses that met the minimum criteria in both data sets (see Materials and Methods). Table 2 summarizes the results of pseudobulk differential expression analysis at the neuronal subclass levels of shared comparisons, indicating concordant and discordant DE events. Despite technical differences between platforms, results showed a high level of concordance. Of the RP DE events found to be significant in both data sets (the “Shared” fraction), only 0.64% were discordant (i.e., showed an opposite direction of change) (Table 2). Notably, 39% of the differential RP gene expression events observed at the neuronal subclass level in the Smart-seq2 data set were concordantly replicated in the 10x Genomics data set, corresponding to 439 cases where the same RP gene was identified as differentially expressed in the same subclass comparison and brain region.
Concordance of subclass-level differentially expressed RPs between Smart-seq2 and 10x Genomics data sets
We detected a positive correlation (Spearman 0.54) between log2FC of RP comparisons between 10x Genomics and Smart-seq2 data sets, indicating that subclass-specific differences remain detectable despite substantial technical variation (Fig. 6A). Among the RP genes consistently detected as differentially expressed in the same comparisons using both methodologies, several exhibited robust subclass-specific variations (Fig. 6B,C). Two of the top three most frequently differentially expressed RPs in Smart-seq2 (Fig. 5A) confirmed their specific patterns in 10x Genomics, as noted by detection of overexpression of Rpl21 in Lamp5 neurons and Rps27 in Vip neurons.
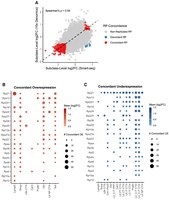
Cross-platform analysis confirms robust subclass-specific RP expression signatures. (A) Scatter plot comparing the RP log2(FoldChange) values from all pairwise subclass comparisons between the Smart-seq2 (x-axis) and 10x Genomics (y-axis) data sets. Each point represents a single gene in a single comparison. Points are colored based on their concordance: Concordant (red; significant in both data sets with the same direction of change), Discordant (blue; significant in both with an opposite direction), or Nonreplicated (gray). The overall Spearman's correlation coefficient is shown. (B,C) Dot plots summarizing the patterns of concordantly overexpressed (B) and underexpressed (C) RP genes. For the top concordantly regulated genes, the size of each dot represents the number of comparisons in which a specific neuronal subclass was identified as the over- or underexpressed subtype in both technologies. The color represents the mean log2(FoldChange) across those concordant events. The analysis confirms key signatures, including the specific overexpression of Rpl21 in Lamp5 neurons and Rps27 in Vip neurons.
Subclass-specific ribosomal protein expression patterns are largely stable across aging and stress conditions
To assess the stability of these subclass-specific RP profiles under different physiological conditions, we reanalyzed two recently published 10x Genomics single-cell RNA-seq data sets: one from the mouse brain cortex during aging (Jin et al. 2025) and another in response to a forced interaction stress test (Hing et al. 2024).
First, we examined the aging data set itself, reclassifying cells from the prefrontal cortex of adult (2 months) and aged (18 months) mice into neuronal subclasses using the Yao et al. data set as a reference, in order to have the same neuronal classification nomenclature (see Materials and Methods). We performed pairwise pseudobulk differential expression analysis following the same strategy as mentioned previously, in order to analyze differences between neuronal subclasses in adult and aged conditions. As expected, we found a positive correlation (Spearman ρ = 0.85) of the log2FC differences for all genes in pairwise subclass comparisons in adult and aged conditions, indicating that differences between subclasses are largely preserved during aging (Fig. 7A). We also detected a positive correlation (Spearman ρ = 0.93) for the log2FC of RP genes alone, suggesting that subclass-level RP gene expression differences are detected both in adult and aged conditions (Fig. 7B). To determine if RP gene expression changes with age, we analyzed differential expression between adult and aged mice within each neuronal subclass (Fig. 7C; Supplemental Data S3). The analysis revealed a striking stability, with only two RP genes showing significant differential expression across all comparisons: Uba52 and Rpl36al. Specifically, Uba52 was overexpressed in aged glutamatergic neurons from subclasses L2/3 IT, L6 CT, and L6 IT, while Rpl36al was underexpressed in aged L4 RSP neurons. DESeq2 normalized counts per biological replicate for each of these comparisons are shown in Figure 7D. Moreover, we analyzed RP expression profiles for neuronal subclasses in this data set (Fig. 7E). RP expression patterns were remarkably stable with aging, as neurons from the same subclass tend to cluster together regardless of the animal's age, while neurons from the same class group together in significant clusters (Supplemental Fig. S7A). These results further underscore the stability of class- and subclass-specific RP expression signatures across conditions. Consistently, Z-score differences between GABAergic and glutamatergic neurons were positively correlated between the Smart-seq2 and aging data sets (Supplemental Fig. S8A; Supplemental Data S4), indicating that broadly the same RP genes tend to drive the separation between neuronal classes across both studies. Specificity scores for Rpl21 and Rps27 showed consistent trends in the aging data set, with both genes showing preferential enrichment in GABAergic neurons overall, and more specifically in Lamp5 neurons for Rpl21 and Vip neurons for Rps27 (Supplemental Fig. S8C).
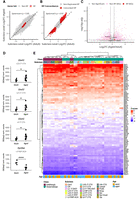
Subtype-specific ribosomal protein expression profiles are largely stable during aging. (A) Scatter plot comparing log2(FoldChange) values from pairwise neuronal subclass comparisons performed independently in adult (x-axis) and aged (y-axis) cohorts using all detected genes. (B) Same analysis as in A, restricted to ribosomal protein (RP) genes only. The high Spearman correlations observed for both all genes (ρ = 0.85) and RP genes alone (ρ = 0.93) indicate that relative expression differences between neuronal subclasses are highly preserved with aging. (C) Volcano plot summarizing the results from direct differential expression comparisons between aged and adult mice within each subclass. Dashed lines indicate the significance thresholds (Padj < 0.05 and |log2(FoldChange)| >0.585). Very few RP genes (red dots) show significant age-related changes, limited to Uba52 and Rpl36al. (D) DESeq2 normalized counts per biological replicate for the two RP genes showing significant changes between aged and adult mice (Uba52 in L2/3 IT CTX, L6 CT CTX, L6 IT CTX and Rpl36al in L4 RSP-ACA neurons). Black dots represent pseudobulk values per replicate, and bars indicate group means. Statistical significance was assessed by pseudobulk DESeq2 analysis: (*) Padj < 0.05, (**) Padj < 0.01, (***) Padj < 0.001, (****) Padj < 0.0001. (E) Heat map of Z-score normalized expression for all 84 RP genes. Hierarchical clustering groups neuronal subclasses from adult and aged mice together (e.g., “Sst adult” with “Sst aged”), demonstrating that the characteristic RP expression profile of each subclass is maintained over the life span.
Having established the stability of RP profiles across aging, we next asked whether they remain robust under stress conditions. We analyzed the data set from mice subjected to a forced interaction test, which were previously classified based on stress vulnerability (Hing et al. 2024). To first confirm the consistency of baseline signatures across different experimental models, we reclassified neurons with the same previous nomenclature and compared this data set with the Yao et al. data obtained with the same technology and for the same brain regions. We then performed pseudobulk pairwise DEG analysis between subclasses in both data sets, detecting a high correlation in the log2FC values (Spearman ρ = 0.73), confirming that the global subclass-level gene expression differences are highly reproducible (Fig. 8A). A positive correlation was also observed for RP genes alone (Spearman ρ = 0.56), indicating that subclass-specific RP expression differences are detectable in this data set as well (Fig. 8B). Having established this baseline stability, we then investigated whether stress vulnerability could modulate these signatures. While most RP genes remained stable, pseudobulk differential expression analysis revealed that four RP genes exhibited significant expression changes in specific neuronal subclasses (Fig. 8C; Supplemental Data S5). The most prominent variation was the overexpression of Rpl15 in Pvalb GABAergic neurons from highly stress-vulnerable mice, with additional changes observed in Uba52 in L5 NP CTX neurons and in Rps2 and Rps27 in Vip neurons (Fig. 8D). When analyzing RP mRNA profiles in neuronal subclasses from low, medium, and high stress vulnerability mice (Fig. 8E), we detected again that neurons from the same classes group together in significant clusters (Supplemental Fig. S7B), indicating that global RP profiles do not have major changes under this condition either. As observed in the aging data set, Z-score differences and specificity scores for Rpl21 and Rps27 also showed broadly concordant trends with the Smart-seq2 data set (Supplemental Fig. S8B,C). Taken together, these analyses demonstrate that while the core RP gene expression patterns are a remarkably stable feature of neuronal subclass identity, persisting through aging and across different experimental models, a small subset of RP genes can be dynamically modulated in response to physiological states like stress.
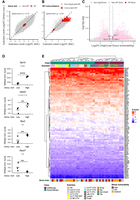
RP expression profiles are reproducible across models and largely stable to stress vulnerability. The figure analyzes a data set from mice classified by stress vulnerability following a forced interaction test. (A) Scatter plot comparing log2(FoldChange) values from pairwise neuronal subclass comparisons between the stress-vulnerability data set (y-axis) and a reference data set from the same brain regions generated using the same single-cell technology (x-axis; Yao et al. 2021), including all detected genes. (B) Same analysis as in A, restricted to ribosomal protein (RP) genes only. Positive Spearman correlations observed for both all genes (ρ = 0.73) and RP genes alone (ρ = 0.56) indicate that baseline subclass-specific expression differences are reproducible across experimental models. (C) Volcano plot summarizing the results from direct differential expression comparisons between high- and low-stress vulnerability mice within each subclass. Dashed lines indicate the significance thresholds (Padj < 0.05 and |log2(FoldChange)| >0.585). Few RP genes show significant changes, with the most prominent being the overexpression of Rpl15 in Pvalb neurons of high-vulnerability mice. (D) DESeq2 normalized counts per biological replicate for the four RP genes showing significant changes between high- and low-stress vulnerability mice (Rpl15 in Pvalb, Uba52 in L5 NP CTX, and Rps2 and Rps27 in Vip neurons). Black dots represent pseudobulk values per replicate, and bars indicate group means. Statistical significance was assessed by pseudobulk DESeq2 analysis: (*) Padj < 0.05, (**) Padj < 0.01, (***) Padj < 0.001, (****) Padj < 0.0001. (E) Heat map of Z-score normalized expression for all 84 RP genes. Hierarchical clustering groups neuronal subclasses together regardless of the animal's stress vulnerability level (e.g., “Pvalb_high” clusters with “Pvalb_low” and “Pvalb_medium”), demonstrating that the characteristic RP profile of each subclass is largely stable.
RPS27 protein is enriched in GABAergic neurons
To validate our transcriptomic findings at the protein level, we focused on RPS27, a top candidate identified in our differential expression analyses. Given an overall higher transcriptomic signal across GABAergic subclasses (Fig. 5B), we sought to validate RPS27 enrichment at the level of broad neuronal classes. To establish a transcriptomic baseline for this comparison, we quantified Rps27 mRNA levels between GABAergic and glutamatergic neurons across previously analyzed data sets. Pseudobulk DESeq2 analysis revealed significant enrichment of Rps27 transcripts in GABAergic neurons in the Smart-seq2 data set (43% change), as well as in both the 10x Genomics adult (32% change) and aged (25% change) cohorts of the Jin et al. data set (Fig. 9A). In contrast, no significant difference was detected in the Hing et al. stress vulnerability data set. To examine whether these transcriptomic differences were reflected at the protein level, we performed an ex vivo immunofluorescence assay to quantify RPS27-associated signal in GABAergic (NeuN+/GAD67+) and glutamatergic (NeuN+/GAD67−) neurons in mouse cerebral cortex, as illustrated in Figure 9B. We applied Cellpose to perform automated 3D segmentation of individual neurons from confocal Z-stacks, identifying cells by the pan-neuronal marker NeuN and the GABAergic marker GAD67. This pipeline enabled analysis of 1335 neurons across three biological replicates. Fluorescence-intensity measurements revealed a significantly higher RPS27-associated signal in GABAergic versus glutamatergic neurons (Fig. 9C; Supplemental Data S6). This corresponded to a 15% protein-level enrichment, consistent in direction with the transcriptomic data. We extended this analysis to RPL21 and RPL29, two additional top transcriptomic candidates (Fig. 5A; Supplemental Data S6). In contrast to RPS27, quantification of RPL21 and RPL29 proteins did not show significant differences in mean fluorescence intensity between GABAergic and glutamatergic neurons under the same experimental conditions (Supplemental Fig. S9E–H).
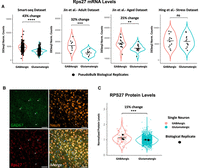
RPS27 protein is enriched in GABAergic neurons of the mouse cerebral cortex. (A) Violin plots showing DESeq2 normalized counts for Rps27 in GABAergic versus glutamatergic neurons across four scRNA-seq data sets. Black dots represent pseudobulk values per biological replicate. Significance was assessed by pseudobulk DESeq2 analysis: (**) Padj < 0.01, (***) Padj < 0.001, (****) Padj < 0.0001; ns, not significant; percent change is indicated above each comparison. (B) Representative confocal images, staining for all neurons (NeuN), GAD67, RPS27, and merged channels including DAPI. White arrows indicate GABAergic neurons detected in this image. Scale bars, 50 µm. (C) Quantification of RPS27 mean fluorescence intensity per neuron (n = 3 mice). GABAergic neurons (GAD67+) show a significant 15% increase in RPS27 protein compared to glutamatergic neurons (GAD67−/NeuN+), assessed by linear mixed model (P = 0.0004).
DISCUSSION
Recent evidence has begun to challenge the long-held view of ribosomal proteins (RPs) as uniformly expressed housekeeping genes. Consistent with this, our analysis of thousands of single-cell transcriptomes reveals finely regulated RP gene expression at the neuronal subclass level. Using single-cell RNA-seq data sets generated with different methodologies (Smart-seq2 and 10x Genomics), we found that RP mRNA levels vary systematically across neuronal subclasses. Even with the inherent differences between methodologies (Wang et al. 2021), we found that 39% of our subclass-level Smart-seq2 DE findings (439 events) were concordantly replicated in the 10x data set. Crucially, only seven of the DE events were discordant, representing a very small fraction of all shared events. Moreover, we found that these differences are largely stable during aging and also under stress. Interestingly, we found that RP gene expression patterns alone enable a significant hierarchical clustering of neuronal subclasses, with the variability being more strongly associated with neuronal subclasses than with brain region of origin. Furthermore, these differences remain consistent in aged mice, suggesting that RP gene expression is finely regulated within each neuronal subclass over time. Consequently, we have identified RP gene expression patterns for neuronal subclasses that are maintained across different brain regions and over time.
One potential contributor to this subclass-specific variability is differential expression of RP paralogs. Consistent with this, our SegIdx analysis identified several paralogous RP genes, including the Rps27/Rps27l pair and Rpl22l1, among the least stable RP genes across neuronal populations, highlighting substantial variability in paralog expression. We further observed asymmetric expression patterns across neuronal subclasses, in which one paralog in each pair (Rpl22l1, Rpl7, and Rps27) is consistently expressed at higher levels and detected across a larger fraction of cells than its counterpart. Importantly, this transcriptional asymmetry is accompanied by differences in chromatin accessibility. Analysis of publicly available single-cell ATAC-seq data revealed that the preferentially expressed paralog consistently shows higher chromatin accessibility than its lower-expressed counterpart, suggesting that differential RP paralog expression is at least partly regulated at the chromatin level. These observations are particularly relevant in light of recent studies on ribosomal heterogeneity driven by paralog usage. For example, work from the Barna laboratory showed that ribosomes containing Rps27 or Rps27l preferentially associate with partially distinct subsets of transcripts (Xu et al. 2023).
Consistent with this idea, our differential expression analysis identified a consistent overexpression of Rps27 in Vip GABAergic neurons, detected across eight neuronal subclass comparisons with both technologies. The subclass-specific enrichment of Rps27, together with reported extraribosomal functions of this protein (Cao et al. 2019), and its relationship to the paralogous Rps27/Rps27l pair implicated in ribosome heterogeneity, makes these paralogs especially compelling targets for further study. Among the other robustly confirmed RP differential expression events, Rpl21 showed consistent overexpression in Lamp5 neurons relative to most glutamatergic subclasses, supported by 44 neuronal subclass comparisons across both technologies. Although it has not yet been reported as a source of ribosomal heterogeneity, its overexpression has been associated with colorectal cancer (Zhu et al. 2023), pancreatic cancer (Li et al. 2020), and mutations in this gene have been linked to hereditary hypotrichosis simplex (Zhou et al. 2011). Furthermore, both RPL21 and RPS27/RPS27L proteins are structurally exposed on the ribosomal surface, as indicated by their mid-low interface-index scores (RPL21 = 0.56; RPS27 = 0.31) (Shigeoka et al. 2019). Notably, RPS27 occupies one of the most external positions on the ribosome, reinforcing its potential accessibility for dynamic exchange. In contrast, RPL21, while less exposed, is positioned near the mRNA channel close to the exit tunnel, suggesting possible roles in modulating translation. This surface accessibility makes them candidates for exchange with the cytoplasmic pool of free ribosomal proteins, adding another potential layer of regulatory complexity. These observations make both RPS27 and RPL21 prime candidates for future studies, which should aim to first confirm these expression differences at the protein level and then dissect their functional impact on neuronal subtype identity and function.
Our analysis confirms that RP expression profiles are highly stable during aging. Against this stable background, however, we detected subtle, subtype-specific expression changes in a few RP genes, including the upregulation of Uba52 and downregulation of Rpl36al. While modest, these changes are notable. The slight increase in Uba52 is particularly interesting given its unique nature as a fusion gene encoding both ubiquitin and the ribosomal protein Rpl40 (Baker and Board 1991). This dual function linking protein degradation and synthesis, especially considering its recently described neuroprotective role (Tiwari et al. 2022), makes its upregulation a plausible indicator of a localized compensatory response to manage proteostasis. Concurrently, the decrease in Rpl36al is also significant, as this gene has been previously reported as a potential biomarker for Alzheimer's disease (Liu et al. 2025). Although these observations are limited to specific subtypes and the magnitude of change is small, their connection to neurodegenerative pathways suggests they are not random fluctuations. Therefore, these subclass-specific alterations provide interesting candidates for future investigation to clarify their biological significance in the context of neuronal aging and pathology. Furthermore, our analysis of the stress vulnerability data set again suggests that overall RP expression profiles are highly stable. Accordingly, neuronal subclasses can be robustly clustered according to their class, regardless of the animal's stress susceptibility. However, we did observe a few RP genes whose expression appeared to be associated with stress vulnerability, a finding that may be relevant given that ribosomal dysregulation has been proposed as a conserved mechanism in human depression and mouse chronic stress (Zhang et al. 2023). For instance, we observed an overexpression of Rpl15 in Pvalb GABAergic neurons from highly stress-vulnerable mice. This is noteworthy as Rpl15 has been previously implicated in stress and depression models (Zhang et al. 2023). We also observed potential condition-dependent changes in Uba52, Rps2, and Rps27 in specific neuronal subclasses. The apparent upregulation of Rps2 in Vip neurons is also interesting, as this gene has been previously linked to stress models (Arloth et al. 2015; Smagin et al. 2016). Importantly, the class-level RP expression signatures identified in the Smart-seq2 data set were broadly reproduced across the aging and stress vulnerability data sets (Supplemental Fig. S8), suggesting that the separation between GABAergic and glutamatergic neurons is driven by reproducible patterns rather than data set–specific effects. While Rpl21 and Rps27 illustrate this behavior, the separation is unlikely to be explained by a single determinant transcript and instead likely reflects the combined contribution of multiple RP mRNAs. It is worth noting, however, that these concordant differences could reflect shared upstream regulatory mechanisms acting on subsets of RP genes, whether transcriptional, chromatin-based, or posttranscriptional, rather than independent gene-specific regulation, a possibility that warrants future investigation. In this regard, while pseudobulk DESeq2 analysis did not detect a significant class-level difference in Rps27 expression in the stress data set, Z-score and specificity score analyses revealed a relative enrichment in GABAergic neurons and specifically in the Vip subclass (Supplemental Fig. S8B,C), suggesting that stress exposure may attenuate the absolute class-level difference while preserving subclass-specific enrichment patterns. Taken together, these observations suggest that while the ribosomal machinery appears globally stable, specific components may be dynamically regulated in a cell-type-dependent manner across different physiological contexts, making them interesting candidates for future functional studies.
It is important to note that our study focused primarily on mRNA quantification, and transcript-level differences do not necessarily translate into proportional changes in protein abundance. Given the technical challenges in obtaining sufficient protein from neuronal subclasses for quantitative proteomics, we opted for an immunofluorescence-based approach as an initial test of three candidate ribosomal proteins. We therefore performed class-level quantification in GABAergic (NeuN+/GAD67+) and glutamatergic (NeuN+/GAD67−) neurons. Accurate subclass-level quantification remains challenging because reliably identifying neurons at the subclass scale is technically difficult and increases variability; this limitation likely reduces sensitivity to detect larger, subclass-restricted effects and should be addressed in future work. Under our class-level immunofluorescence assay, neither RPL21 nor RPL29 showed significant differences in mean fluorescence intensity between classes. This apparent discrepancy may reflect the strong posttranscriptional buffering characteristic of ribosomal proteins, as well as the possibility that mRNA-level differences translate into relatively small changes in protein abundance that remain below the sensitivity of class-level immunofluorescence measurements. Additionally, the transcriptomic differences were more pronounced at the subclass level, suggesting that aggregation at the broader class level in our immunofluorescence analysis may obscure more subtle subclass-specific variations. In contrast, we were able to confirm a greater abundance of RPS27 protein in GABAergic neurons compared to glutamatergic neurons (∼15% increase), indicating that at least some of the differences we observed at the mRNA level translate to differences at the protein level. Although a 15% change is modest, in the context of RPs, the biological relevance of small alterations in RP stoichiometry is supported by studies of ribosomopathies, where modest imbalances in single RPs can cause severe disease (Emmott et al. 2019). Also, given that a mammalian cell contains millions of ribosomes, even a small change might have a significant biological impact (Genuth and Barna 2018). This suggests that the translational machinery is highly sensitive to its precise composition, although whether the specific, nonpathological variations observed here are sufficient to alter translational activity remains to be functionally demonstrated. Higher-sensitivity methods will be needed to evaluate protein changes and to clarify the causes of elevated mRNA expression.
Even if not all mRNA differences are reflected at the protein level, their precise and consistent regulation across neuronal subclasses is a significant finding per se. Many mRNAs may be maintained in a translationally poised state, becoming translated only at specific times, within defined subcellular compartments, or in response to extrinsic cues; such regulated translational control could reconcile transcript–protein discordance and merits targeted investigation. While our study highlights differentially expressed RP genes among subclasses, the mechanisms underlying this regulation remain to be defined. Future work should investigate the contribution of transcription factors and expand the analysis of chromatin accessibility, while advances in proteomics will soon enable accurate quantification from low-abundance samples. Such approaches will make it possible to determine whether the transcript differences observed here extend to the protein level.
Our findings reveal a potential layer of regulation that may contribute to the fine-tuning of protein synthesis in a subclass-specific manner. Crucially, this study did not directly measure rates of protein synthesis or ribosome composition, and therefore the functional impact of these stable transcriptional signatures remains an open question. In conclusion, by identifying robust, subclass-specific ribosomal protein gene expression patterns, our work provides a critical foundation and a new conceptual framework for future studies into how the regulation of the ribosome itself shapes neuronal diversity and function.
MATERIALS AND METHODS
Single-cell RNA-seq data analysis
For our primary analysis, we reanalyzed the comprehensive single-cell transcriptomic atlas of the mouse cortex and hippocampus from Yao et al. (2021), selected for its high cell number (∼1.3 million cells) and sequencing depth (Yao et al. 2021). Count matrices and associated metadata tables were downloaded, and data were first analyzed using Seurat R package (Hao et al. 2024). We initially used the Smart-seq2 data set for filtering and selecting cortex and hippocampus regions and neuronal subclasses for analysis. Nonneuronal cells were discarded, and different brain regions were analyzed separately. To enable statistical analysis, we filtered out regions that did not have neuronal subclasses from at least three different mice (with a minimum of five cells of the same subclass per mouse). After this filtering, we ended with 11 brain regions (primary visual cortex [VISp], visual cortex [VIS], supplemental somatosensory cortex [SSs], primary somatosensory cortex [SSp], ventral retrosplenial cortex [RSPv], retrosplenial cortex [RSP], primary motor cortex [Mop], hippocampus [HIP], anterior lateral motor cortex [ALM], agranular insular cortex [AI], and anterior cingulate area [ACA]). Neuronal clusters with <10 cells in these cortex regions were filtered out, and genes with no counts in fewer than 10 cells were filtered out. For the 10x Genomics data set, we first selected only the cells from the 11 cortex regions that passed the filter in the Smart-seq2 analysis. Subsequently, the same cell and gene filtering criteria were applied. Then, the count matrices were analyzed following a standard Seurat workflow, including log-normalization, feature selection, and dimensionality reduction (PCA and UMAP). We obtained several quality control metrics such as total counts, number of RP genes detected, and total RP counts on these two data sets (Fig. 1; Supplemental Fig. S1).
RP stability expression analysis
To analyze the expression variability of the 84 ribosomal protein (RP) genes, we first created a subset of the Smart-seq2 data containing only these genes. The expression matrix for this subset was then normalized using the SCTransform function in the Seurat R package. We performed principal component analysis (PCA) and used an elbow plot to determine the number of significant components, selecting the first eight principal components (PCs) for all downstream analyses (Supplemental Fig. S2A). Subsequently, we constructed a k-nearest neighbor (KNN) graph based on these eight PCs and identified cell clusters using the Louvain algorithm with a resolution parameter of 0.2. The resulting clusters were visualized in two dimensions using uniform manifold approximation and projection (UMAP). Finally, we assessed the neuronal class composition of each identified cluster (Fig. 2A). For the gene stability analysis, expression stability index (SegIdx) and F-Index were calculated for each gene in the Smart-seq2 data set using the scSegIndex tool present in the scMerge package (Lin et al. 2019b). We show median SegIdx and F-statistics across all regions in Figure 2B–E and per region values in Supplemental Figure S2D–N.
To test whether RP genes show a rightward shift in F-statistics, we performed two Wilcoxon rank‐sum comparisons. For the global test, we compared median F-statistics and compared the vector of medians for RP genes against all genes using a one-sided Wilcoxon test. For the region‐wise analysis, we iterated over per-region F-statistics and, for each region, compared the per‐gene F-statistics of RP genes versus non-RP genes with the same one‐sided Wilcoxon test.
RP expression levels and specificity score calculation
Normalized count matrices were extracted from the Seurat object and scaled per gene to generate a Z-score, showing the relative expression of each RP across all neuronal subclasses and brain regions analyzed. To group these samples based on their RP expression profiles, we performed hierarchical clustering using the Euclidean distance as the distance metric and Ward's minimum variance method (linkage = “ward.D2”) as the agglomeration criterion (Fig. 3A). The statistical significance of the resulting clusters was then assessed with sigClust2, which calculates P-values for each cluster merge based on a Monte Carlo simulation test (Supplemental Fig. S3A; number of simulations = 100) (Kimes et al. 2017). To quantify subclass-specific variation of RP expression, we adapted the method of Guimaraes and Zavolan (2016), originally developed for bulk RNA-seq across tissues, to the single-cell context. Residuals of RP expression were calculated across neuronal subclasses and standardized using the global mean and standard deviation of all residuals. Each value was converted into a global Z‐score (specificity score), which measures how much RP expression in a given subclass deviates from the overall data set. Genes with scores beyond ±2.5 standard deviations were considered significantly enriched or depleted. These distributions were visualized with boxplots for individual genes, where each dot represents a neuronal subclass (Fig. 3B), and with scatterplots for each subclass highlighting genes that surpassed the threshold (Supplemental Fig. S3B).
Paralog expression analysis
To assess differences in ribosomal protein paralog expression across neuronal subclasses, we examined the expression patterns of three paralog pairs (Rpl7/Rpl7l1, Rpl22/Rpl22l1, and Rps27/Rps27l) in the Smart-seq2 data set. Cells were grouped by neuronal subclass, and expression values were aggregated across cortical regions. For each gene, we computed the average normalized expression within each subclass. Expression patterns were visualized using dot plots in which color intensity represents the average expression level and dot size indicates the fraction of cells with detectable expression within each subclass (Fig. 4A). This representation allows simultaneous visualization of relative expression levels and the distribution of expression across neuronal populations.
Beyond this aggregated analysis, we also examined paralog expression at the level of individual cortical regions. For each Seurat object corresponding to a region, we calculated the percentage of cells expressing each paralog and plotted these values by neuronal subclass. Region‐specific dot plots (Supplemental Fig. S4) display both average expression and percentage of expressing cells, with one panel per region.
To assess whether the observed differences in paralog detection are supported at the chromatin level, we reanalyzed a publicly available single-nucleus ATAC-seq data set from mouse brain (Zu et al. 2023). Gene-level accessibility matrices preprocessed as logCPM were downloaded directly from the repository. Nuclei were mapped to the neuronal subclasses used in the scRNA-seq analysis using the metadata provided by the original study. For each subclass and paralog gene, we calculated the mean logCPM accessibility score and the fraction of nuclei with detectable accessibility (logCPM > 0). Results were visualized as dot plots in which dot size reflects the fraction of accessible nuclei and color indicates mean logCPM accessibility (Fig. 4B), following the same format as the scRNA-seq dot plot in Figure 4A to facilitate direct comparison.
Differential expression analysis
To account for interanimal variability, a known confounding factor in scRNA-seq studies (Squair et al. 2021), we performed differential expression analysis using a pseudobulk strategy. While this approach can be conservative and may increase false negatives (Mou et al. 2020), it enhances the robustness of the detected differences.
Matrices of pseudobulk RNA-seq counts were generated for both Smart-seq2 and 10x data sets independently as follows. The matrix of counts per cell was converted into a matrix of counts per neuron class (class level) or subclass (subclass level) for each mouse used in the study, similar to what could be obtained by bulk RNA-seq if neuronal types were previously separated. Therefore, the expression levels of cells belonging to the same neuronal group were aggregated for each mouse. Then, classic differential expression analysis between all neuron classes (class level) or subclasses (subclass level) within each brain region was performed with DESeq2, taking each mouse as a replicate. Genes with a |log2(FoldChange)| >0.58496 (equivalent to a fold change >1.5) and Padj < 0.05 were considered differentially expressed.
To quantify the tendency of specific RP genes to be over- or underexpressed in particular neuronal subclasses, we developed a normalized scoring system. First, we considered all pairwise differential expression results where a gene was significantly altered. For each significant comparison (e.g., Subclass A vs. Subclass B), we designated the subclass with higher expression as “H” and the other as “L.” We then calculated two scores for each gene in each subclass. The Overexpression Score was defined as the total number of “H” for a given gene in a specific subclass, divided by the total number of pairwise comparisons that included that subclass. Similarly, the Underexpression Score was calculated as the total number of “L” for that gene in the subclass, normalized by the same total number of comparisons. This normalization accounts for the different number of comparisons each subclass is involved in, making the scores comparable across all neuronal subtypes. These scores were calculated for the 25 RP genes with the highest frequency of differential expression events across all data sets and were visualized using heat maps (Fig. 5B).
Cross-technology concordance analysis
A pseudobulk differential expression analysis using DESeq2 was performed on the 10x Genomics data set, following the same approach applied to the Smart‐seq2 data. To assess the technical reproducibility of our findings, we then carried out a concordance analysis comparing the differential expression (DE) results of RP genes between the Smart‐seq2 and 10x Genomics data sets. We merged the two DEG result sets, retaining only the gene‐comparison pairs that were common to both technologies. From this merged data set, we categorized each shared observation. A gene was labeled Concordant RP if it was detected as a significant DEG [Padj < 0.05 and |log2(FoldChange)| >0.58496] in both technologies with the same direction of change [i.e., the signs of the log2(FoldChange) values were the same]. It was labeled Discordant RP if it was significant in both but with an opposite direction of change. All other shared gene‐comparison pairs were labeled Nonreplicated RP. The overall correlation of log2(FoldChange) values was assessed using Spearman's correlation coefficient (Fig. 6A). Furthermore, to evaluate which specific neuronal subclasses consistently showed concordant overexpression or underexpression, we counted, for the top 20 most concordant RP genes, the number of times each subclass appeared as the overexpressed or underexpressed subtype in these robust comparisons (Fig. 6B,C).
Analysis of aging and stress vulnerability data sets
To investigate the effects of aging and stress on RP gene expression, we reanalyzed two publicly available single-cell RNA-seq data sets obtained with 10x Genomics technology: one that studied aging (Jin et al. 2025) and the other that examined stress vulnerability (Hing et al. 2024). Count matrices and associated metadata tables were downloaded for further analysis (see Data Deposition). For consistency across data sets, we first restricted the analysis to cells annotated within the cortex. To ensure anatomically matched cell type nomenclature, neuronal populations were reclassified using the previously curated 10x Genomics data set from the mouse prefrontal and retrosplenial cortices (Yao et al. 2021) as a reference. These cortical regions were selected because they directly overlap with the anatomical areas profiled in the aging and stress-vulnerability data sets, thereby ensuring comparable regional identities. In addition, we used this 10x Genomics data set as a reference to maintain technical consistency with the single-cell methodologies used in both target data sets. This label transfer was performed using Seurat's “FindTransferAnchors” and “TransferData” functions, and only cells with a high-confidence prediction score (>0.95 class label, >0.7 subclass label) were retained.
Following reclassification, we performed differential expression analyses using the pseudobulk approach described previously. To assess the stability of expression signatures, we conducted pairwise comparisons between all neuronal subclasses. For the aging data set, analyses were performed independently for the adult and aged cohorts, and the resulting log2(FoldChange) values were correlated using Spearman's correlation coefficient to evaluate reproducibility across age groups (Fig. 7A,B). For the stress data set, pairwise comparisons were performed across the entire cohort, and correlation with the reference baseline signatures was likewise assessed using Spearman's correlation (Fig. 8A,B). Subsequently, to identify genes specifically altered by each physiological state, we compared conditions directly: aged versus adult mice and high versus low stress vulnerability mice, in both cases within each individual subclass. For statistical robustness, all comparisons required a minimum of three biological replicates (mice) per group. Finally, results were visualized with volcano plots representing the variation of gene expression between neuronal subclasses across conditions (Figs. 7C, 8C). Because each subclass was analyzed independently, the same gene could appear multiple times if it varied significantly in more than one subclass. In addition, normalized count matrices were used to generate heat maps of RP expression for both the aging and stress data sets, followed by hierarchical clustering (Euclidean distance, Ward's minimum variance method) and cluster significance testing with sigClust2, as described above (Figs. 7C, 8C). To evaluate cross-data set reproducibility of GABAergic/glutamatergic RP expression differences, we computed average Z-score differences (GABAergic minus glutamatergic) for each RP gene across data sets. The mean Z-score was computed separately for GABAergic and glutamatergic subclasses, with the difference between these means used as a summary statistic per gene per data set. Spearman correlation coefficients were then calculated between the Smart-seq and both the aging and stress vulnerability data sets to assess concordance (Supplemental Fig. S8A,B; Supplemental Data S4). Additionally, specificity scores for Rpl21 and Rps27 were computed for the aging and stress data sets following the same approach as described for the Smart-seq data set (Supplemental Fig. S8C).
Animals and surgical procedures
All procedures were performed in accordance with the Uruguayan law on animal experimentation (Law No. 18.611) and were approved by the Institutional Commission for Animal Care (approval code 070151-000063-25). Three male C57BL/6J mice (2 months old) were used for protein validation experiments by immunofluorescence. The animals were obtained from URBE (Unidad de Reactivos para Biomodelos de Experimentación, Facultad de Medicina, Universidad de la República) and housed under a 12 h light–dark cycle with ad libitum access to food and water.
Mice were anesthetized with ketamine/xylazine (100/20 mg/kg, i.p.) and placed in a stereotaxic frame. Because GAD67, the marker used to identify GABAergic neurons, exhibits limited somatic signal under baseline conditions due to its predominant axonal localization, colchicine was administered to block axonal transport and promote somatic accumulation of the protein. To induce this effect, a single intracerebroventricular (ICV) administration of colchicine (10 µg/µL) in 2 µL of NaCl 0.9% was administered into the lateral ventricle at the following coordinates modified from Stanić et al. (2010): AP: −0.2 mm, L: +0.8 mm, and DV: −2 mm relative to bregma according to Franklin and Paxinos 2008. The solution was slowly infused. After the injection, the needle was left in place for 3 min before being slowly withdrawn.
Twenty-four hours post-ICV administration, mice were transcardially perfused with phosphate-buffered saline 0.1 M (PBS) followed by 4% paraformaldehyde (PFA) in PBS buffer pH 7.4 (137 mM NaCl, 2.7 mM KCl, 8 mM Na2HPO4, and 2 mM KH2PO4). Brains were extracted, and immersed in 4% PFA at 4°C, and then cryoprotected by immersion in 30% sucrose in PBS for additionally 48 h at 4°C. The brains were frozen in dry ice and cut into 30 μm coronal sections using a cryostat (Leica CM 1900, Leica Microsystems), placed in a cryoprotectant solution, and stored at −20°C until the immunohistochemical procedures were performed.
Immunofluorescence assays
Immunofluorescence assays were performed on cortical cryosections to quantify ribosomal protein expression in specific neuronal populations. Cryosections that included the cerebral cortex obtained from −1.70 to −2.30 mm from bregma were selected. All incubation and washing steps were performed on free-floating sections with gentle agitation at room temperature, unless otherwise specified. The staining protocol was initiated by washing the sections three times in 0.1 M PBS. To reduce autofluorescence from residual aldehydes, sections were incubated in 0.5% sodium borohydride (NaBH4) in PBS for 25 min, followed by three 10 min washes in PBS. Nonspecific binding was minimized by a 60 min incubation in 50 mM glycine in PBS, followed by three additional PBS washes. A final blocking step was performed for 60 min in a solution containing 10% bovine serum albumin (BSA) and 1.5% normal donkey serum (NDS) in PBS. Sections were then incubated 48 h at 4°C in a primary antibody cocktail including ribosomal protein markers RPS27 (Boster Biological Technologies PB10093, 1:500), RPL29 (Boster Biological Technologies A05949-1, 1:500), or RPL21 (Invitrogen PA5-70676, 1:500), together with GABAergic neuronal marker GAD67 (Millipore Sigma MAB5406, 1:500) diluted in PBS with 0.3% Triton X-100 (PBS-T) and 1.5% NDS. Following primary antibody incubation, sections were washed three times for 10 min each in PBS-T. They were subsequently incubated for 90 min in a solution containing a cocktail of species-specific secondary antibodies, including fluorophore-conjugated antibodies (Invitrogen A-21245, 1:500) and a biotinylated antibody (ImmunoResearch 711-065-152, 1:600), diluted in PBS-T with 3% NDS. To reveal the biotinylated secondary antibody, sections were washed three times in PBS-T and then incubated for 2 h with Alexa Fluor 488-conjugated streptavidin (Molecular Probes S-32354, 1:2000). Sequential immunofluorescence procedures were performed for GAD67 and NeuN pan-neuronal marker (Millipore Sigma MAB377, 1:1000) protein detection because both primary antibodies were raised in the same species. After finishing the first sequence of incubations of primary antibodies and the corresponding secondary antibodies, including streptavidin, the sections were washed in PBS-T, and an additional 60 min blocking step (10% BSA and 1.5% NDS) was performed in order to continue with the next step of the sequential incubations. Then, anti-NeuN primary antibody was incubated overnight with gentle agitation. The following day, after three PBS-T washes, the corresponding fluorophore-conjugated secondary antibody (Invitrogen A-21422, 1:500) was incubated for 90 min. It is important to note that sequential staining was used for the detection of GAD67 and NeuN in order to characterize neuronal populations. We did not observe fluorescence bleed-through between channels since we could correctly identify GAD67+ and NeuN+ neurons and GAD67− and NeuN+ neurons in proportions similar to what is expected (Supplemental Fig. S9B–D). Finally, all sections were counterstained with DAPI (Sigma-Aldrich D9542) for 10 min to visualize cell nuclei, washed with PBS-T, and mounted onto glass slides using VECTASHIELD Plus (Vector Labs H-1900).
Ribosomal protein quantification in neuronal classes
Images were acquired as Z-stacks using a Zeiss 800 confocal microscope with a 40× 0.95 NA air objective, covering the entire section. For automatic 3D neuron detection in the Z-stacks, Cellpose (Stringer and Pachitariu 2025) was employed, setting DAPI as nuclear marker and RP signal as cytoplasmic marker. Subsequently, a 3D per-neuron quantification of the mean fluorescence intensity corresponding to the ribosomal protein of interest was obtained using 3D ImageJ Suite plugin (Ollion et al. 2013). Manual curation of the images was carried out to discard doublets and classify each neuron according to its neuronal subtype, based on the fluorescence of the corresponding channels. Neurons were classified as GABAergic (Gad67+/NeuN+) or glutamatergic (Gad67−/NeuN+) given their cortical origin. To exclude cells located at the edge of z-stacks and exhibit reduced mean fluorescence intensity (likely due to signal bleaching or incomplete antibody penetration), an automatic image-based filter was implemented. This filter discarded neurons whose centroid was located in planes where the mean fluorescence intensity dropped to <70% of the value corresponding to the top 5% of cells with the highest mean fluorescence intensity (Supplemental Fig. S9A). Additionally, a size filter was applied, discarding cells smaller than 300 µm3 (volume expected for somas with diameters of ∼8 µm) in order to eliminate low-quality neurons whose somas were not completely detected. We controlled that the percentages of each detected cell type were similar to the expected composition in the brain cortex (Supplemental Fig. S9B–D). Statistical analyses were performed using linear mixed models with mouse as a random effect and individual neuron mean fluorescence intensity as the observation. A two‐sided P < 0.05 was considered significant.
DATA DEPOSITION
The single-cell RNA-seq and ATAC data sets reanalyzed in this study are publicly available. The data sets from Yao et al. (2021) and Jin et al. (2025) were sourced from the Neuroscience Multi-omic (NeMO) Archive under the data set identifiers dat-jb2f34y and dat-61kfys3, respectively. The data set from Hing et al. (2024) is available in the Gene Expression Omnibus (GEO) database under accession number GSE240975. The single-nucleus ATAC-seq data set from Zu et al. (2023) is available in GEO under accession number GSE246791. Complete results of the pseudobulk differential expression analyses of ribosomal protein (RP) genes derived from the Smart-seq2 and 10x Genomics data sets are provided in Supplemental Data S1 and S2, respectively. Differential expression results for aging-associated (18 vs. 2 months) and stress-associated phenotypes are provided in Supplemental Data S3 and S5, respectively. Z-score difference values (GABAergic minus glutamatergic) for each RP gene across data sets, used for cross-data set concordance analyses, are provided in Supplemental Data S4. Raw and normalized quantification data from the immunofluorescence experiments shown in Figure 9 and Supplemental Figure S9 are provided in Supplemental Data S6. The raw confocal microscopy images generated for this study are available from the corresponding author upon reasonable request. All custom scripts used for data processing, analysis, and figure generation have been deposited in a public GitHub repository, available at https://github.com/joagarat/RP_scRNAseq_Neurons_Code.
SUPPLEMENTAL MATERIAL
Supplemental material is available for this article.
ACKNOWLEDGMENTS
We thank all members of the Departamento de Genómica at the Instituto Clemente Estable for fruitful discussions about this project. We also thank Hector Caporicci and Joaquin Carrique from the IT team for maintaining the server used for the analyses, and Dr. Gabriel Rinaldi for carefully reading the manuscript and fruitful discussions. We would like to acknowledge the following institutions for the financial support received: Agencia Nacional de Investigación e Innovación (ANII) for funding project codes: POS_MPI_2020_1_1010162 (PhD fellowship to J.G.) and, jointly with the Max Planck Institute for Brain Research, Research Grant to J.R.S. (Project Number: MPI_ID_2020_1_1010120); Comisión Sectorial de Investigación Científica (CSIC) for funding project code: CSIC Iniciación 2021 C221-347; Comisión Académica de Posgrados (CAP), Universidad de la República (PhD Fellowship to J.G.); and Programa de Desarrollo de las Ciencias Básicas (PEDECIBA) Biología PhD Program.
Footnotes
-
↵6,7Present addresses: Departamento de Histología y Embriologia, CENUR Litoral Norte, Universidad de la República, Paysandú 60000, Uruguay; Plataforma Integrada de Histología Anatomía Patológica y Óptica de Superresolución (PHIAPOS), Departamento de Ciencias Biológicas, CENUR Litoral Norte, Universidad de la República, Paysandú 60000, Uruguay
-
Article is online at http://www.rnajournal.org/cgi/doi/10.1261/rna.080954.126.
-
Freely available online through the RNA Open Access option.
- Received January 13, 2026.
- Accepted March 22, 2026.
This article, published in RNA, is available under a Creative Commons License (Attribution-NonCommercial 4.0 International), as described at http://creativecommons.org/licenses/by-nc/4.0/.
REFERENCES
MEET THE FIRST AUTHOR

Meet the First Author(s) is an editorial feature within RNA, in which the first author(s) of research-based papers in each issue have the opportunity to introduce themselves and their work to readers of RNA and the RNA research community. Joaquín Garat is the first author of this paper, “Neuronal subtype–specific ribosomal protein mRNA expression.” Joaquín is a PhD student in the Genomics Department at the Instituto de Investigaciones Biológicas Clemente Estable in Montevideo, Uruguay, where his research focuses on the translational machinery and ribosome biology in the nervous system.
What are the major results described in your paper, and how do they impact this branch of the field?
Our main finding is that ribosomal protein genes exhibit distinct mRNA expression profiles across neuronal subtypes, at both the broad class level (excitatory vs. inhibitory) and the finer subclass level. While we were able to confirm differences at the protein level for one candidate, the variability observed at the mRNA abundance level suggests that subtype-specific regulation of the translational machinery may exist in the nervous system. This opens the door to future experiments aimed at understanding whether these differences are ultimately reflected in ribosome composition, potentially giving rise to specialized ribosomes. More broadly, our results contribute to the emerging idea that translational regulation is not uniform across cell types in the brain, and highlight the value of single-cell transcriptomic approaches for uncovering this heterogeneity.
What led you to study RNA or this aspect of RNA science?
Since joining the Genomics Department, I have been continuously working with omics data, and the sheer volume and resolution of single-cell RNA-seq data were remarkable to me. At the same time, we became aware of the ongoing debate around the existence of specialized ribosomes. Given the extraordinary diversity of neuronal subtypes in the brain, and the availability of high-quality scRNA-seq data sets published in recent years, we wondered whether ribosomal protein genes might show differential expression across neuronal subclasses as an initial approach to the question of ribosome specialization, while being mindful that multiple regulatory steps exist between mRNA abundance and the actual incorporation of a ribosomal protein into a functional ribosome. What I found particularly motivating throughout this work was the challenge of handling these large-scale data sets and the excitement of extracting meaningful, novel biological insights from them.
What are some of the landmark moments that provoked your interest in science or your development as a scientist?
From an early age, I was drawn to science-related subjects, and during my teenage years, chemistry particularly captured my attention. I found myself fascinated by understanding how living organisms work at the molecular level. A landmark moment in my path was visiting the Faculty of Sciences and the Instituto de Investigaciones Biológicas Clemente Estable as a child, where my mother worked, and seeing that world up close. That early exposure left a lasting impression and, looking back, it planted the seed that eventually led me to pursue a PhD in biological sciences at that very same institution. Later, joining the Genomics Department during my undergraduate studies proved equally decisive. Being part of such a welcoming and intellectually stimulating group reinforced my commitment to pursuing a career in research.
If you were able to give one piece of advice to your younger self, what would that be?
Keep going. The right decisions tend to emerge on their own as you move forward, and not knowing exactly where you are headed is not a problem. Don't resist coding: eventually, you will come to enjoy it, once you realize the range of possibilities it opens up. And try to enjoy the journey as much as you can, even when things get stressful.
What are your subsequent near- or long-term career plans?
In the near term, I expect to complete my PhD thesis later this year, closing what has been a very rewarding first chapter of my research career. Looking further ahead, I see myself continuing in academia as a researcher, building on everything I have learned during these years, whether through my own independent projects or through collaborations, which I find particularly enjoyable. Ultimately, my goal is to dedicate myself fully to a career in research.




