


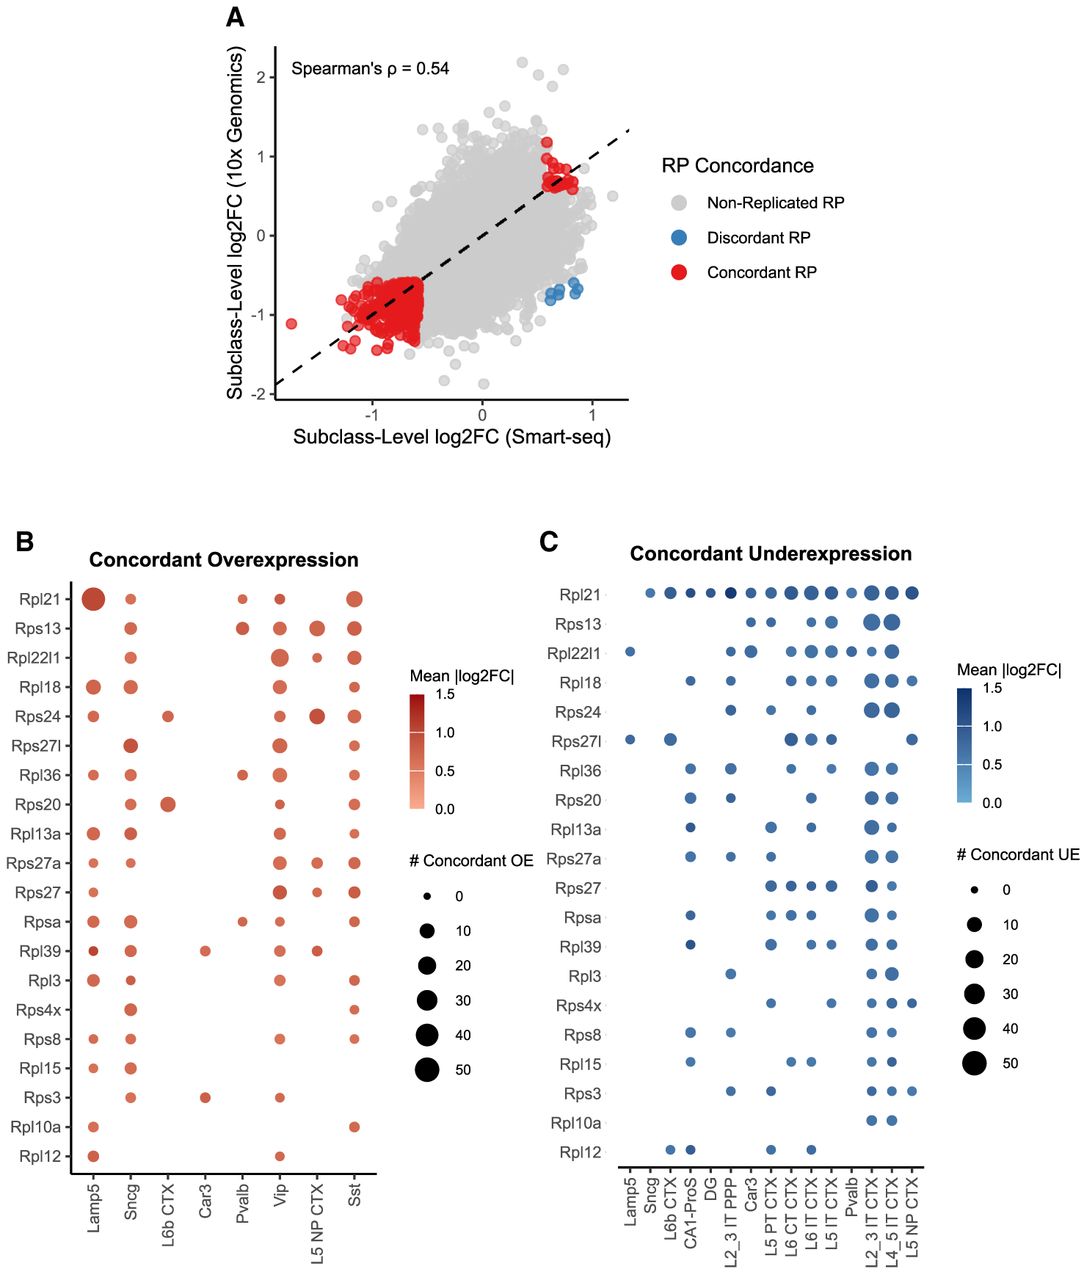
Cross-platform analysis confirms robust subclass-specific RP expression signatures. (A) Scatter plot comparing the RP log2(FoldChange) values from all pairwise subclass comparisons between the Smart-seq2 (x-axis) and 10x Genomics (y-axis) data sets. Each point represents a single gene in a single comparison. Points are colored based on their concordance: Concordant (red; significant in both data sets with the same direction of change), Discordant (blue; significant in both with an opposite direction), or Nonreplicated (gray). The overall Spearman's correlation coefficient is shown. (B,C) Dot plots summarizing the patterns of concordantly overexpressed (B) and underexpressed (C) RP genes. For the top concordantly regulated genes, the size of each dot represents the number of comparisons in which a specific neuronal subclass was identified as the over- or underexpressed subtype in both technologies. The color represents the mean log2(FoldChange) across those concordant events. The analysis confirms key signatures, including the specific overexpression of Rpl21 in Lamp5 neurons and Rps27 in Vip neurons.




