


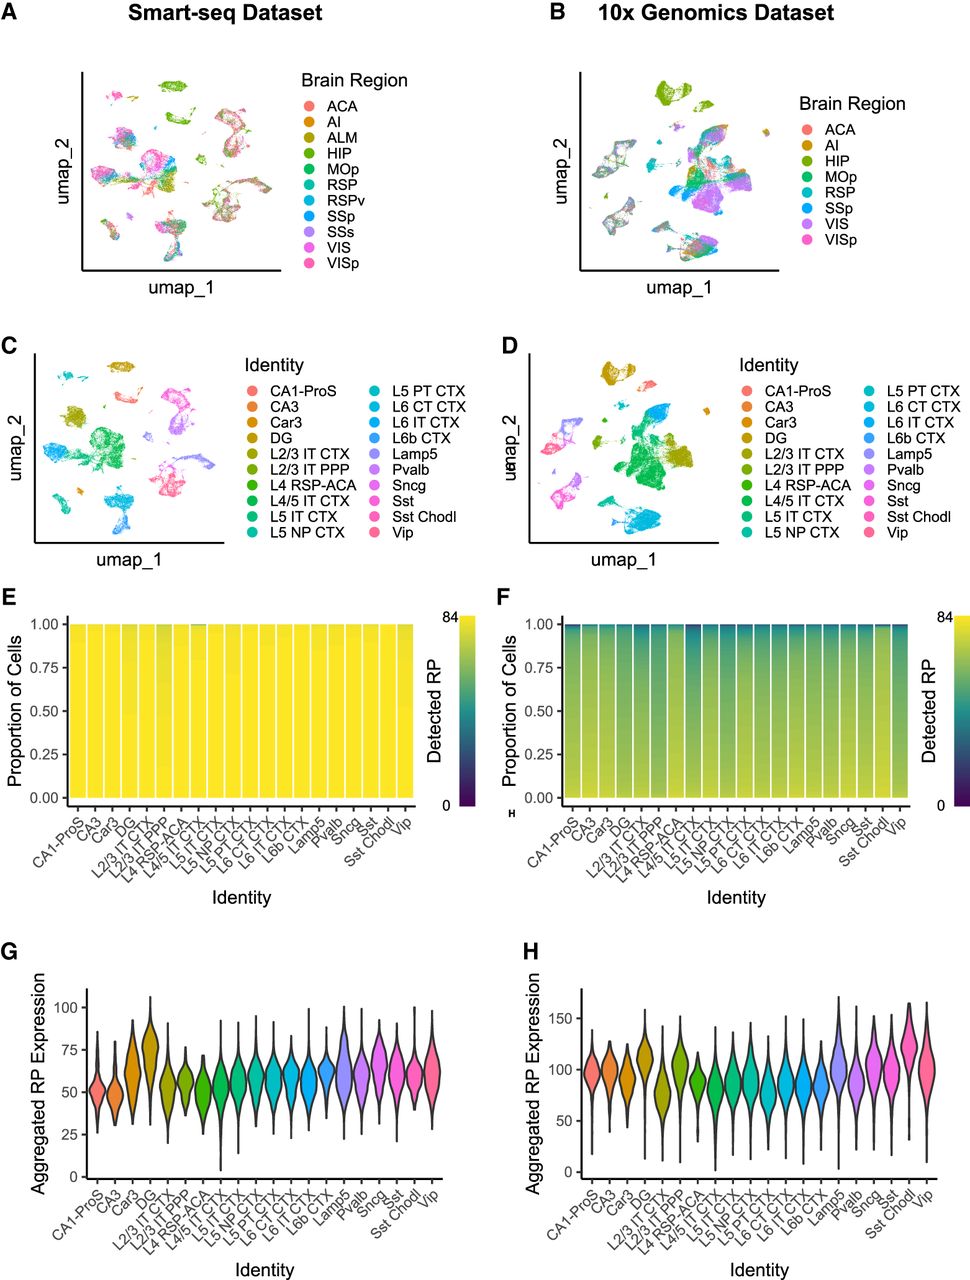
Mapping neuronal subtypes in Smart-seq2 and 10x Genomics data sets highlights differential sensitivity for RP gene detection. (A–D) UMAP visualizations of neuronal cells colored by brain region of origin (A,B) or neuronal subclass (C,D) from the Smart-seq2 (A,C) and 10x Genomics (B,D) data sets. (E,F) Bar plots showing the number of ribosomal protein (RP) genes detected per cell across major neuronal subclasses, in the Smart-seq2 data set (E) and in the 10x Genomics data set (F). (G,H) Violin plots showing the distribution of the summed normalized expression of all 84 RP genes within individual cell types for the Smart-seq2 (G) and 10x Genomics (H) data sets. Brain region abbreviations shown in A and B are as follows: (VISp) primary visual cortex, (VIS) visual cortex, (SSs) supplemental somatosensory cortex, (SSp) primary somatosensory cortex, (RSPv) ventral retrosplenial cortex, (RSP) retrosplenial cortex, (MOp) primary motor cortex, (HIP) hippocampus, (ALM) anterior lateral motor cortex, (AI) agranular insular cortex, (ACA) anterior cingulate area.




