


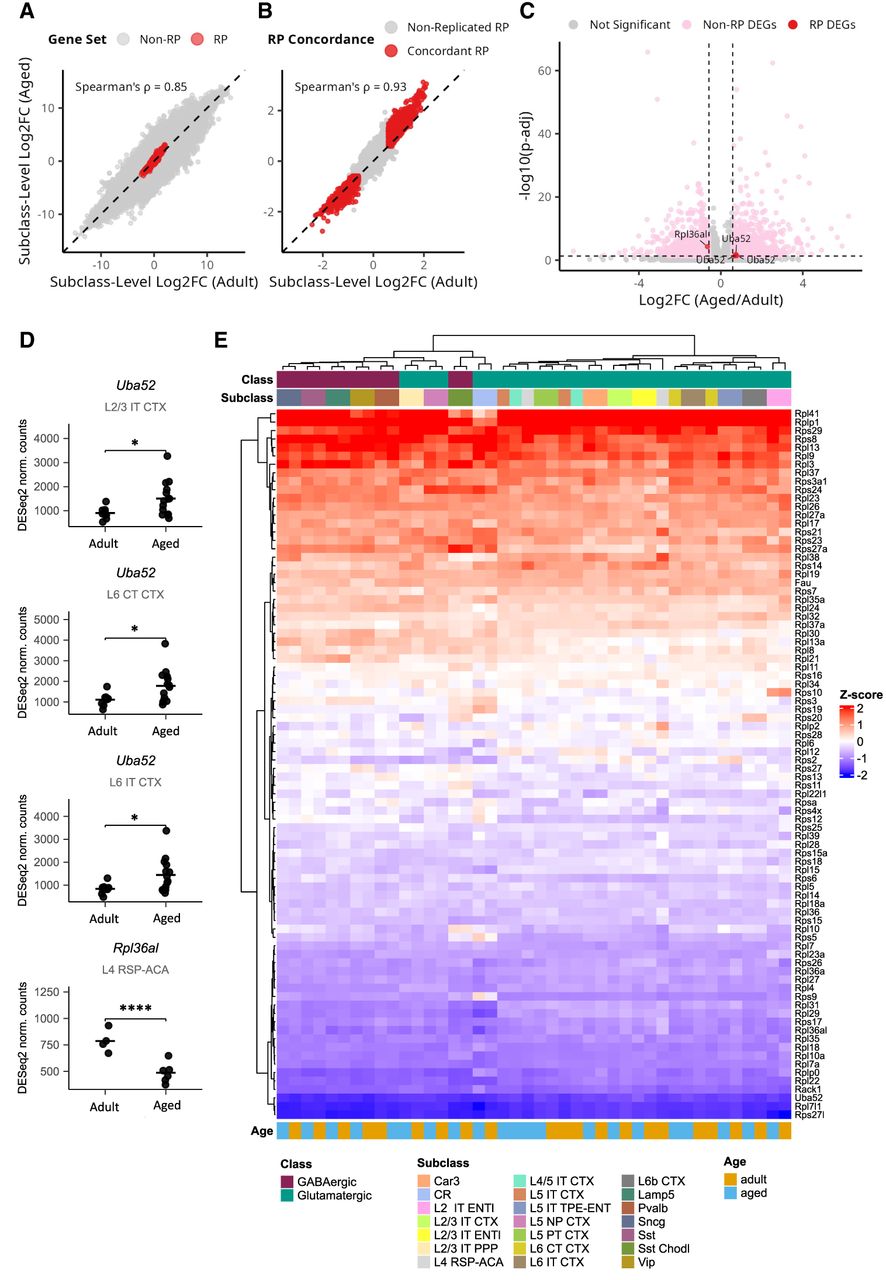
Subtype-specific ribosomal protein expression profiles are largely stable during aging. (A) Scatter plot comparing log2(FoldChange) values from pairwise neuronal subclass comparisons performed independently in adult (x-axis) and aged (y-axis) cohorts using all detected genes. (B) Same analysis as in A, restricted to ribosomal protein (RP) genes only. The high Spearman correlations observed for both all genes (ρ = 0.85) and RP genes alone (ρ = 0.93) indicate that relative expression differences between neuronal subclasses are highly preserved with aging. (C) Volcano plot summarizing the results from direct differential expression comparisons between aged and adult mice within each subclass. Dashed lines indicate the significance thresholds (Padj < 0.05 and |log2(FoldChange)| >0.585). Very few RP genes (red dots) show significant age-related changes, limited to Uba52 and Rpl36al. (D) DESeq2 normalized counts per biological replicate for the two RP genes showing significant changes between aged and adult mice (Uba52 in L2/3 IT CTX, L6 CT CTX, L6 IT CTX and Rpl36al in L4 RSP-ACA neurons). Black dots represent pseudobulk values per replicate, and bars indicate group means. Statistical significance was assessed by pseudobulk DESeq2 analysis: (*) Padj < 0.05, (**) Padj < 0.01, (***) Padj < 0.001, (****) Padj < 0.0001. (E) Heat map of Z-score normalized expression for all 84 RP genes. Hierarchical clustering groups neuronal subclasses from adult and aged mice together (e.g., “Sst adult” with “Sst aged”), demonstrating that the characteristic RP expression profile of each subclass is maintained over the life span.




