


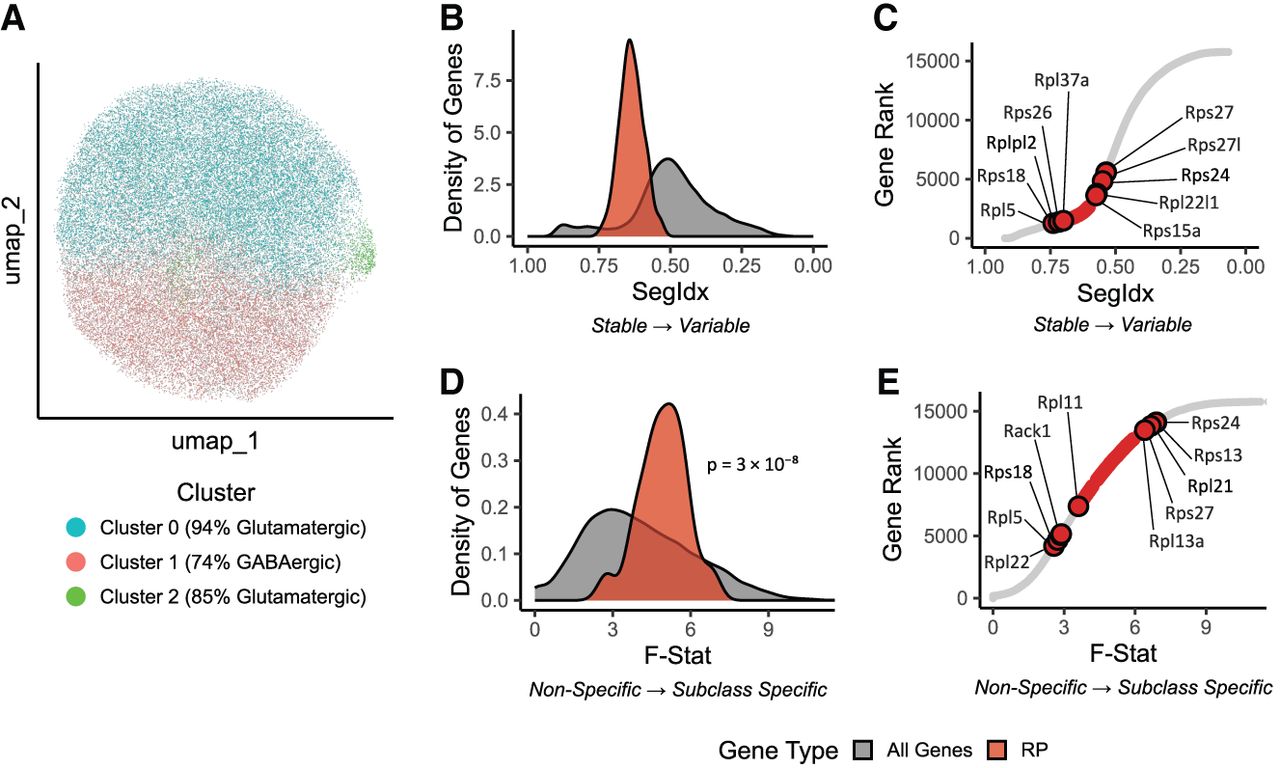
Ribosomal protein genes are stably expressed but show neuron subclass–specific signatures in the Smart-seq2 data set. (A) UMAP visualization of unsupervised clustering based solely on the expression of 84 RP genes. The analysis identifies three clusters that show a strong separation between predominantly GABAergic (Cluster 1) and glutamatergic (Clusters 0 and 2) neurons. (B) Density plot comparing the expression stability index (SegIdx) for all detected genes (gray) versus only RP genes (red). Higher SegIdx values (near 1) indicate more stable gene expression. Note that the x-axis is reversed (ranging from 1 to 0) to facilitate visual comparison with the F-statistic plot in D. (C) Ranked plot of SegIdx values for all genes. The top five most stable and most variable RP genes are highlighted. (D) Density plot comparing the F-statistic, a measure of neuron subclass–specific expression, for all genes (gray) versus RP genes (red). Higher F-statistic values indicate greater subclass specificity. The P-value from a one-sided Wilcoxon rank-sum test assessing whether RP genes show significantly higher F-statistics than the global gene distribution is indicated. (E) Ranked plot of F-statistic values for all genes. The top five most and least subclass-specific RP genes are highlighted.




