


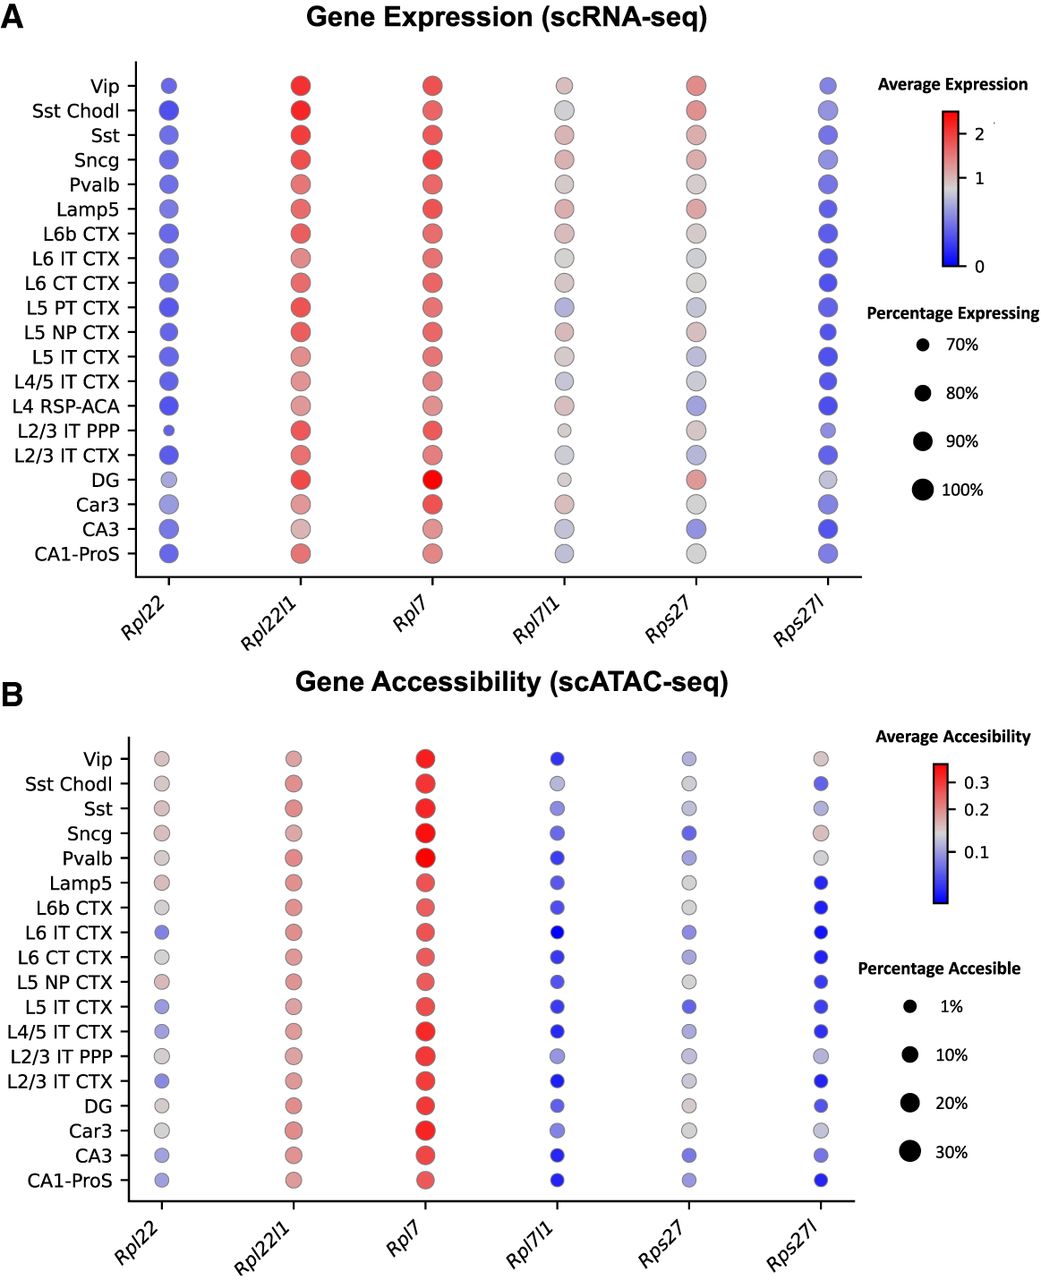
RP paralog expression and chromatin accessibility across neuronal subclasses. (A) Dot plot summarizing the expression patterns for the three RP paralog pairs across neuronal subclasses. The size of each dot corresponds to the percentage of expressing cells, while the color indicates the normalized average expression level. The plot visually confirms that the preferential paralogs are more broadly (larger dots) and highly (redder dots) expressed than their alternative counterparts. (B) Dot plot showing chromatin accessibility for the same paralog pairs across neuronal subclasses, derived from a publicly available scATAC-seq data set (Zu et al. 2023). The size of each dot corresponds to the fraction of nuclei with detected accessible chromatin at the gene locus, and the color indicates mean accessibility expressed as log counts per million (logCPM). In both A and B, the preferentially expressed paralog consistently shows higher expression and greater chromatin accessibility across neuronal subclasses.




