


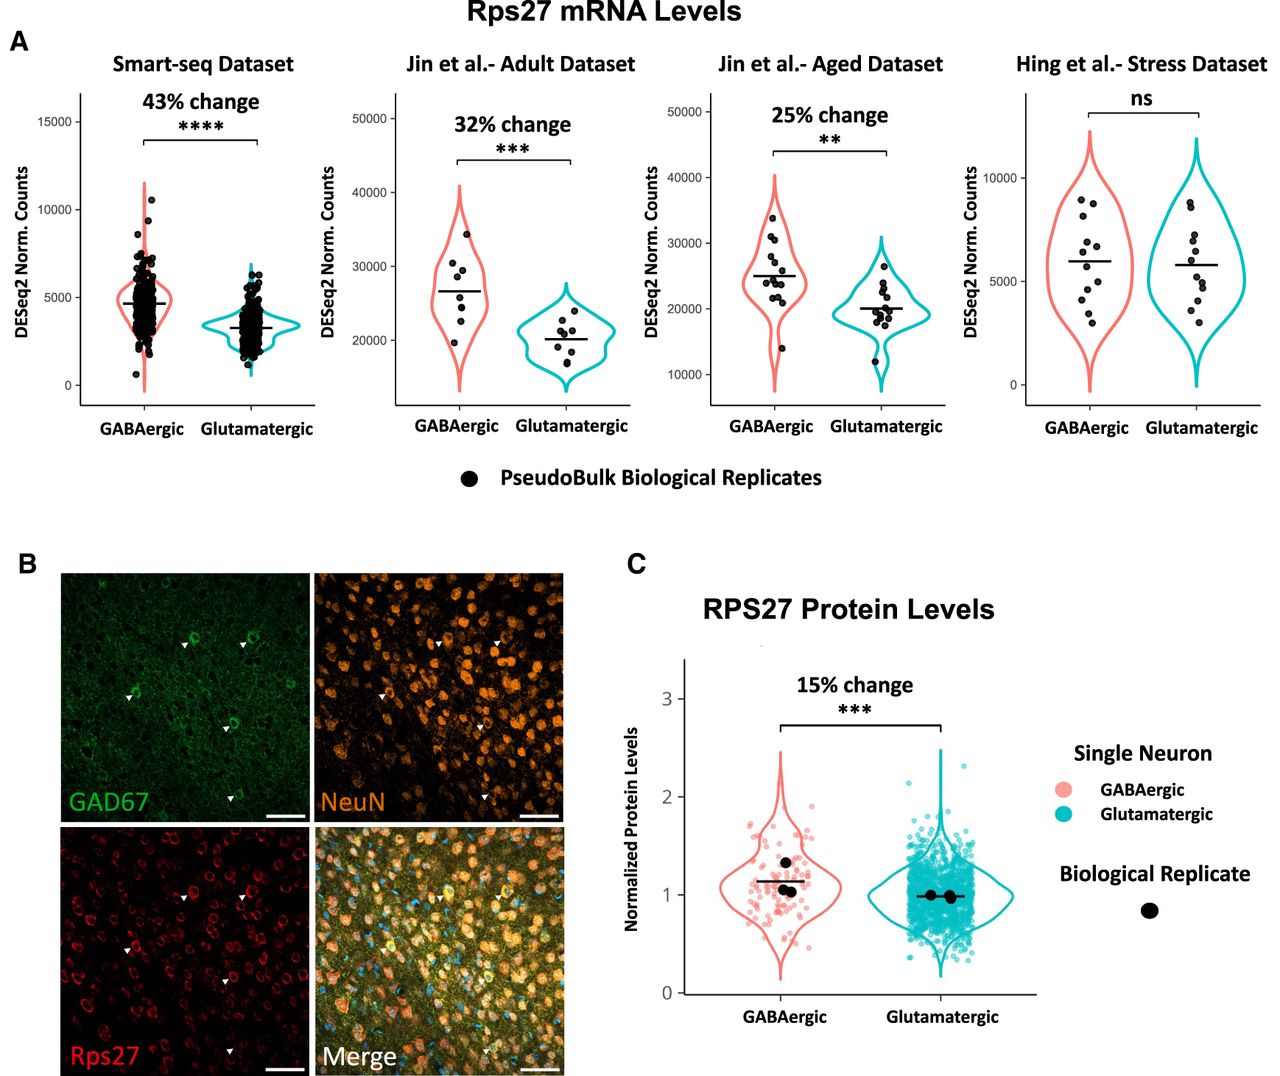
RPS27 protein is enriched in GABAergic neurons of the mouse cerebral cortex. (A) Violin plots showing DESeq2 normalized counts for Rps27 in GABAergic versus glutamatergic neurons across four scRNA-seq data sets. Black dots represent pseudobulk values per biological replicate. Significance was assessed by pseudobulk DESeq2 analysis: (**) Padj < 0.01, (***) Padj < 0.001, (****) Padj < 0.0001; ns, not significant; percent change is indicated above each comparison. (B) Representative confocal images, staining for all neurons (NeuN), GAD67, RPS27, and merged channels including DAPI. White arrows indicate GABAergic neurons detected in this image. Scale bars, 50 µm. (C) Quantification of RPS27 mean fluorescence intensity per neuron (n = 3 mice). GABAergic neurons (GAD67+) show a significant 15% increase in RPS27 protein compared to glutamatergic neurons (GAD67−/NeuN+), assessed by linear mixed model (P = 0.0004).




