


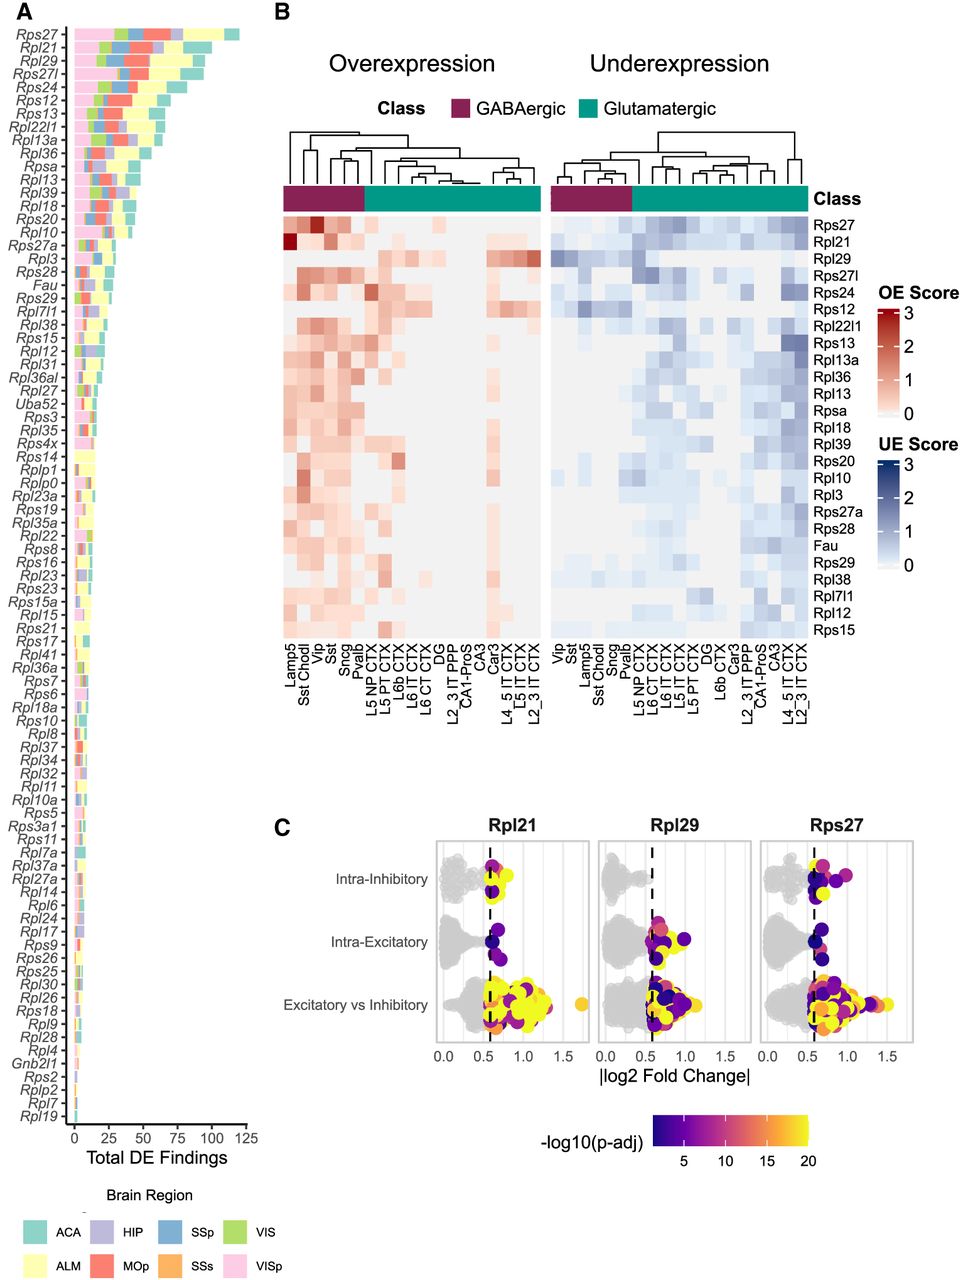
Dissecting the sources of ribosomal protein gene expression variability across neuronal subclasses. (A) Stacked bar chart ranking RP genes by their total number of differential expression (DE) events across all pairwise subclass comparisons. Colors within each bar indicate the contribution of DE events from different brain regions. (B) Heat maps of overexpression scores (red) and underexpression scores (blue) for the 25 most frequently variable RP genes across neuronal subclasses. The score represents the normalized frequency of a gene being significantly up- or downregulated in all comparisons involving a specific subclass. Hierarchical clustering reveals that inhibitory subclasses (e.g., Lamp5, Vip) are primary drivers of overexpression for specific RPs like Rpl21 and Rps27. (C) Scatter plots for the top three most variable RP genes, showing the magnitude [log2(FoldChange)] and statistical significance [color scale; −log10(Padj)] of each DE event. Comparisons are categorized based on whether they occurred within inhibitory subclasses, within excitatory subclasses, or between the two major classes.




