


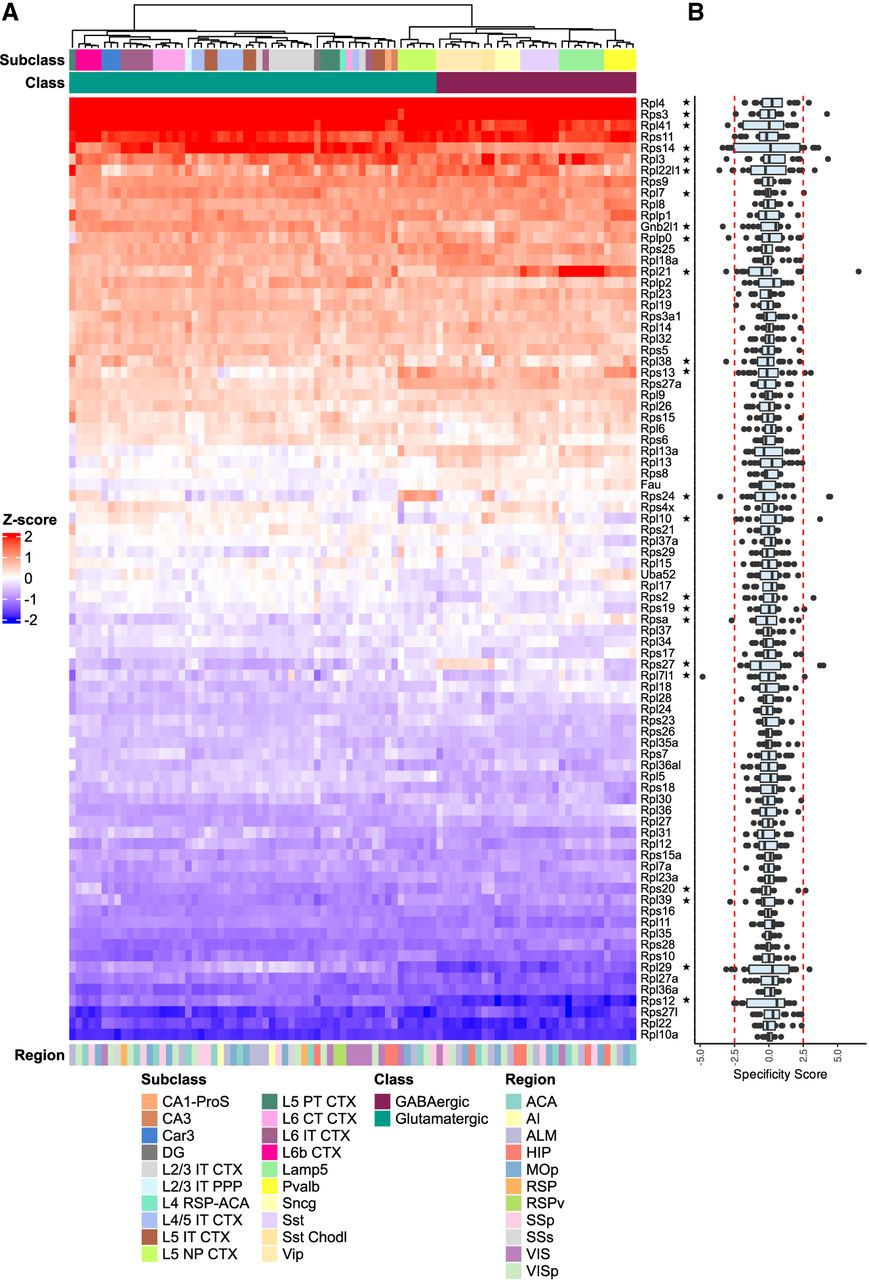
RP expression drives the clustering of major neuronal classes and reveals subclass-specific gene signatures. (A) Heat map showing the Z-score normalized expression of 84 RP genes across different neuronal subclasses and brain regions. Columns are hierarchically clustered based on their RP expression profile, revealing a strong separation between GABAergic and glutamatergic neurons. Annotations indicate the subclass, class, and brain region for each column. Genes identified as subclass-specific in B are marked with an asterisk (*). (B) Boxplots showing the distribution of specificity scores for each RP gene across all neuronal subclasses. The score quantifies the degree to which a gene expression profile is different in specific subclasses. The red dotted lines indicate the threshold used to define specificity (|score| > 2.5). Genes are shown following the same order as in A.




