


Pervasive formation of double-stranded RNAs by overlapping sense/antisense transcripts in budding yeast mitosis and meiosis
- Ugo Szachnowski1,6,
- Emmanuelle Becker2,4,6,
- Igor Stuparević2,5,6,
- Maxime Wery1,
- Olivier Sallou3,
- Mateo Boudet3,
- Anthony Bretaudeau3,
- Antonin Morillon1 and
- Michael Primig2
- 1Institut Curie, Sorbonne Université, CNRS UMR3244, F-75248 Paris, France
- 2Univ Rennes, Inserm, EHESP, Irset (Institut de recherche en santé, environnement et travail) - UMR_S 1085, F-35042 Rennes, France
- 3GenOuest, IRISA, Campus de Beaulieu, F-35000 Rennes, France
- Corresponding author: michael.primig{at}inserm.fr
-
↵6 These authors contributed equally to this work.
-
Handling editor: Mihaela Zavolan
Abstract
Previous RNA profiling studies revealed coexpression of overlapping sense/antisense (s/a) transcripts in pro- and eukaryotic organisms. Functional analyses in yeast have shown that certain s/a mRNA/mRNA and mRNA/lncRNA pairs form stable double-stranded RNAs (dsRNAs) that affect transcript stability. Little is known, however, about the genome-wide prevalence of dsRNA formation and its potential functional implications during growth and development in diploid budding yeast. To address this question, we monitored dsRNAs in a Saccharomyces cerevisiae strain expressing the ribonuclease DCR1 and the RNA-binding protein AGO1 from Naumovozyma castellii. We identify dsRNAs at 347 s/a loci that express partially or completely overlapping transcripts during mitosis, meiosis, or both stages of the diploid life cycle. We associate dsRNAs with s/a loci previously thought to be exclusively regulated by antisense interference, and others that encode antisense RNAs, which down-regulate sense mRNA-encoded protein levels. To facilitate hypothesis building, we developed the sense/antisense double-stranded RNA (SensR) expression viewer. Users are able to retrieve different graphical displays of dsRNA and RNA expression data using genome coordinates and systematic or standard names for mRNAs and different types of stable or cryptic long noncoding RNAs (lncRNAs). Our data are a useful resource for improving yeast genome annotation and for work on RNA-based regulatory mechanisms controlling transcript and protein levels. The data are also interesting from an evolutionary perspective, since natural antisense transcripts that form stable dsRNAs have been detected in many species from bacteria to humans. The SensR viewer is freely accessible at https://sensr.genouest.org.
Keywords
INTRODUCTION
Saccharomyces cerevisiae is a eukaryotic model organism useful for analyzing mitotic cell division and meiotic development. Haploid MATa or MATα cells can undergo mitotic or filamentous growth. In contrast, diploid MATa/α cells can exit mitosis and enter the meiotic developmental pathway in response to nutritional cues (Zaman et al. 2008; Duina et al. 2014).
S. cerevisiae was the first eukaryote for which the entire genome sequence was determined (Goffeau et al. 1996). When tiling arrays covering the yeast genome on both strands became available, long noncoding RNAs (lncRNAs) lacking bona fide open reading frames (ORFs) were identified. Depending on the substrate-specificities of ribonucleases, lncRNAs were classified as Rrp6-sensitive cryptic unannotated transcripts (CUTs) (Wyers et al. 2005; Neil et al. 2009; Xu et al. 2009), Xrn1-sensitive unstable transcripts (XUTs) (van Dijk et al. 2011), and stable unannotated transcripts (SUTs) (Xu et al. 2009). In addition, meiotic unannotated transcripts (MUTs) were found to peak in diploid cells undergoing meiotic development (Lardenois et al. 2011).
Numerous yeast loci express overlapping sense/antisense (s/a) transcripts, whereby sense mRNAs are often down-regulated by the antisense RNA in a process called transcriptional interference (for review, see Pelechano and Steinmetz 2013). Well-studied examples include the diauxic shift (ARO10) (Nevers et al. 2018), sugar metabolism (GAL1) (Houseley et al. 2008; Pinskaya et al. 2009), and meiotic induction (IME4) (Hongay et al. 2006). More recent work has shown that certain s/a loci in yeast form dsRNAs, which regulate mRNA and XUT stability or control the translation of mRNAs encoded by mating type-specific genes during yeast sporulation (Sinturel et al. 2015; Wery et al. 2016; Yeager et al. 2021). Intriguingly, certain dsRNAs formed by s/a transcripts are stable in the mammalian male germline, and others regulate mitotic cell cycle progression in human cells (for review, see Werner et al. 2024).
The Dicer ribonuclease and the RNA-binding protein Argonaute are encoded by conserved genes essential for the activity of small interfering RNAs (siRNA). These siRNAs pair with complementary sequences in their target transcripts to mediate their degradation (for review, see Lax et al. 2020). Saccharomyces cerevisiae lacks the siRNA system, but an engineered strain expressing DCR1 and AGO1 from Naumovozyma castellii has been employed in earlier work on RNA interference in budding yeast that reported dsRNAs in mitotic cells, which involved several thousand mRNAs (Drinnenberg et al. 2009, 2011; Sinturel et al. 2015; Wery et al. 2016).
Few viewers for genome-wide dsRNA signals are available, in spite of accumulating evidence in unicellular model organisms and mammals that stable s/a dsRNA formation is a widespread and likely conserved phenomenon (Portal et al. 2015; Wery et al. 2016; Szachnowski et al. 2019).
We carried out a genome-wide dsRNA profiling study and identified stable dsRNAs at 347 s/a loci that differentially express partially or completely overlapping transcripts during mitosis and/or meiosis. We report dsRNA formation at s/a loci thought to be exclusively regulated by antisense interference, and cases that encode antisense RNAs, which are known to negatively regulate sense mRNA-encoded protein levels. To facilitate interpreting the data, we developed sense/antisense double-stranded RNA (SensR), which is helpful for formulating hypotheses about the regulatory functions of yeast antisense RNAs and for yeast genome annotation. Natural antisense transcripts (NATs) have been observed in numerous species (Camblong et al. 2007, 2009; Swiezewski et al. 2009; Yap et al. 2010; Werner et al. 2014, 2021; Atkinson et al. 2018; Wery et al. 2018a,b; Szachnowski et al. 2019; for review, see Werner et al. (2024). Their ability to form stable dsRNAs with coding and noncoding sense transcripts is therefore relevant for gaining a better understanding of fundamental processes controlling growth and development in eukaryotic cells.
RESULTS
dsRNA profiling mitotic and meiotic stages of the budding yeast life cycle
The yeast genome contains 4690 loci that potentially form dsRNAs because they encode partially or completely overlapping s/a transcripts. This includes 770 mRNA pairs, 320 lncRNA pairs, and 3600 mRNA/lncRNA pairs (Lardenois et al. 2011). To gain a global insight into the prevalence of dsRNA formation during yeast cell division and differentiation, we performed a genome-wide dsRNA profiling experiment using an SK1 wild-type (WT) strain and a background that ectopically expresses Dicer (DCR1) and Argonaute (AGO1) from N. castellii under the control of the TEF1 promoter (DA; Fig. 1A), enabling the strain to process dsRNAs into defined fragments of 19–23 bases (Wery et al. 2016).
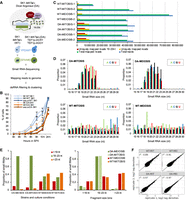
dsRNA profiling method and quality control. (A) A schematic outlines the experimental workflow of the dsRNA profiling experiment. (B) A color-coded line diagram plots culture time in hours (x-axis) against the percentage of cells that have completed Meiosis I, II, and ascus formation in WT and DA strains as outlined in the legend. (C) A color-coded bar diagram plots numbers obtained for different categories of reads (x-axis) against strains and experimental conditions as indicated (y-axis). A legend at the bottom shows the colors of the read types. (D) Color-coded bar diagrams plot RNA fragment size in nucleotides (small RNA size [nt]; x-axis) against the proportion of A, C, G, and U nucleotides in sequence reads (proportion; y-axis) for samples from WT and DA strains in mitosis and meiosis as indicated. Legends show the color code for bases. (E) The color-coded bar diagram to the left plots strains and culture conditions (x-axis) as indicated against the proportion of small RNAs detected in them (y-axis). A legend shows the color code for nucleotide fragment bins. The diagram to the right plots fragment size bins as indicated (x-axis) against the proportion of small RNAs in the WT and DA strains as shown in the legend (y-axis). (F) Scatter plots of log2 transformed tag densities are shown for replicates 1 (x-axis) and replicates 2 (y-axis) for WT and DA strains cultured in rich medium (MIT) and sporulation medium (MEI) as shown. The coefficient of determination (r2) is indicated.
We collected duplicate samples during mitotic growth in rich medium (YPD), and at a time point in sporulation medium (SPII 8h) when ∼20% of the WT and Dicer/Argonaute (DA) cells had entered meiotic M phase (Fig. 1B). It should be noted that the DA strain shows slightly delayed progression through meiotic M phase and, consequently, spore formation. The reason for this phenomenon is unclear, but it might be related to the presence of unphysiological DA activity, which could, for example, influence spindle formation and chromosomal segregation (for review, see Borner et al. 2023).
The duplicate mitotic and meiotic DA/WT total RNA samples displayed homogenous quality (Supplemental Fig. S1A). Total RNA was separated by gel electrophoreses and gel fragments covering the small RNA fraction were excised before the RNA was precipitated and subjected to another round of quality control, which revealed the expected profiles (Supplemental Fig. S1B,C).
Next, we determined the number of total reads (350,378,221), mapped reads (322,162,934), uniquely mapped reads (48,851,609) and uniquely mapped reads that are 19–23 nt in length (26,455,790) across the sample set and observed a homogenous output except in the cases of two outliers (WT-MITOSIS replicate 1 and WT-MEIOSIS replicate 1; Fig. 1C; Supplemental File S1). Importantly, we found a strong enrichment of fragments within the 19–23 nt range in samples from the DA strain, which is in keeping with the size of small RNAs naturally generated by Dcr1 in N. castelli (Fig. 1C,D; Szachnowski et al. 2019). In contrast, the size distribution observed in WT samples was generally homogeneous during mitosis and meiosis (Fig. 1D). While the proportion of small RNAs in the 19–23 nt range is substantially higher in mitotic and meiotic DA cells than in WT cells, we do not, as expected, observe such an effect for RNA fragments that are smaller than 19 nt or larger than 23 nt (Fig. 1E).
Finally, we compared the expression signals (log2 tag densities) between mitotic (MIT) and meiotic (MEI) replicates in both WT and DA strains by computing the r2 coefficient of determination values and found that they are highly similar (WT-MEI 1 and 2 0.91; DA-MIT 1 and 2 0.97; DA-MEI 1 and 2 0.97); the WT MIT replicates display the lowest r2 (0.89), which perhaps reflects the different read numbers (Fig. 1C,F).
Taken together, the results indicate that the strand-specific small RNA-seq protocol performed efficiently. We note that the mitotic sample from the DA strain shows a previously described bias for uracil, whereas the meiotic sample shows peak signals for guanine; see Supplemental Figure S3 in Szachnowski et al. (2019) and Drinnenberg et al. (2009). The reasons for this are currently unclear, but it might reflect altered processing activities during meiotic development. Alternatively, the base variability could be related to the biochemical properties of Dcr1 from budding yeasts, which bind cooperatively along their dsRNA templates, rather than in a sequence-specific manner (Weinberg et al. 2011).
Definition and categories of s/a loci
The term “locus” describes a physical region on a chromosome but is often used as a synonym for a protein-coding gene. For clarity, we employ the term “s/a locus” for cases that involve two partially or completely overlapping genes that encode RNAs transcribed in opposite directions. In general, we observe three types of s/a loci that express mRNA/mRNA (SNM1/PEX29), mRNA/lncRNA (XBP1/SUT1755), and lncRNA/lncRNA (SUT193/SUT1734) pairs (Fig. 2A–C). Given the current state of ncRNA annotation, a definitive answer as to how many genes overlap and to what extent will have to await more precise genomic transcript start/termination site mapping data for all classes of yeast lncRNAs.
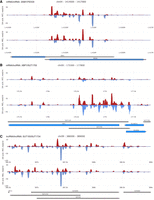
Three major s/a loci classes. (A–C) Examples of dsRNA data are shown for RNA pairs involving different coding and noncoding transcripts as linear filled diagrams. Genome coordinates (x-axis) are plotted against normalized linear reads (read/nt; y-axis). Top and bottom strand signals are given in red and blue. Protein-coding and noncoding genes are shown in blue and gray, respectively. Samples from diploid wild-type (WT a/al.) and DA (a/al.) strains in mitosis (MIT) and meiosis (MEI) are given to the left. RNA types and s/a locus names are given at the top. Images were created with SensR.
dsRNA formation is associated with negative regulation of sense mRNA-encoded proteins by antisense transcripts
It has been observed that the expression of antisense SUTs negatively regulates the levels of proteins encoded by overlapping sense mRNA (Huber et al. 2016). The sole mechanism of this phenomenon has been assumed to be transcription interference; however, it is interesting to note that several of the loci that showed the strongest SUT-dependent effects on protein levels—including YKL068W-A/SUT671 and CHS7/SUT588—form dsRNAs in mitosis and meiosis (Fig. 3A,B). Furthermore, a recent study of antisense expression during yeast gametogenesis (sporulation) has suggested that dsRNAs may contribute to the translational regulation of haploid mating type-specific genes, which are repressed in dividing diploid cells and get induced during meiotic development (Yeager et al. 2021). Indeed, the profiling data for BAR1/SUT612 and FAR1/SUT204, among others, support this notion (Fig. 4A,B). RNA-seq data obtained with samples from synchronized diploid WT cells in G1/S (WT a/al. G1/S) and G2/M (WT a/al. G2/M) show that SUT612 and BAR1 transcript levels are equal (albeit unevenly distributed across the coding regions) and that SUT204 substantially exceeds FAR1 (Fig. 4A,B; Xie et al. 2019). This is consistent with the notion that antisense lncRNAs may have a regulatory role that is based on recruiting the sense mRNA into a stable dsRNA structure, which might affect their subcellular localization or translation (Coban et al. 2024).
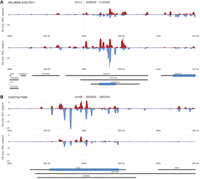
Antisense RNA mediating sense mRNA encoded protein regulation. (A,B) Examples are shown for antisense SUTs that are known to down-regulate overlapping sense mRNA-encoded proteins like in Figure 2.
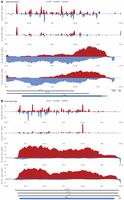
s/a locus dsRNA formation and gene expression. (A,B) A filled line diagram shows dsRNA profiling data (top) and RNA expression data (bottom) for s/a loci indicated at the bottom. Samples are shown to the left and s/a locus annotation and genome coordinates are given at the top.
Identification of s/a loci associated with significant dsRNA formation during growth and development
Next, we identified 347 dsRNAs involving at least one RNA that exhibited significant differential expression between mitotic and meiotic cells using mRNA, SUT, CUT, and MUT annotation data from our tiling array expression analysis based on samples from fermenting, respiring, and sporulating cells (see Supplemental File S2; Lardenois et al. 2011). We clustered the corresponding s/a loci based on their dsRNA signal intensities in mitotic and meiotic samples and categorized them into mRNA/mRNA, mRNA/lncRNA, and lncRNA/lncRNA classes based on yeast genome annotation (Supplemental File S2). Subsequently, we clustered members of the dsRNA classes according to their patterns in mitotic and meiotic samples from the DA strain (Fig. 5A). We found that mRNA/mRNA pairs are mostly bona fide protein-coding genes that overlap so-called dubious ORFs. These ORFs are not thought to encode biologically active proteins because they are not conserved, lack corresponding mRNAs/proteins, and a gene deletion phenotype can often be attributed to the overlapping protein-coding gene; for further details, see the glossary of the Saccharomyces Genome Database (SGD) (Engel et al. 2022). Based on these criteria, it is unlikely that, for example YGL072C (overlapping HSF1) encodes a genuine mRNA, since the dsRNA signal and RNA expression data from Xie et al. (2019) do not appear to correspond to this ORF (Fig. 5B,C).
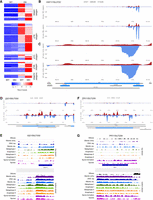
dsRNA classes and s/a locus gene expression. (A) A color-coded heatmap shows z-score transformed (the z-score is the number of standard deviations any given data point is above or below the mean value), and clustered dsRNA signals obtained with WT and DA strains in mitosis (MIT) and meiosis (MEI). A row z-score scale is given at the bottom. (B,C) dsRNA signals are shown as a filled diagram for the region indicated. Normalized strand-specific RNA-seq expression data (read/nt, y-axis) for arrested WT cells released into rich medium and sampled after 40 min (G1/S) and 100 min (G2/M) are plotted for the same region as a filled diagram (x-axis). (D–G) dsRNA formation and RNA expression data are shown for two s/a loci encoding proteins known to be down-regulated during sporulation. RNA-seq data for mitosis versus meiotic development from Brar et al. (2012) are shown as a color-coded filled diagrams for top and bottom strands. Growth and differentiation phases are indicated to the left. Only protein-coding genes are displayed as blue bars. White arrowheads indicate the sense of transcription. Images were created with IGV 2.8.0 and edited for clarity. We note that SUT/MUT ncRNA annotation data are not displayed because for technical reasons, we employed a genome definition file, which contains only mRNA coordinates (the systematic name YFR017C is displayed for IGD1).
We note that top and bottom strand dsRNA signals can be distorted in cases for which expression levels of the s/a RNAs are very different. This phenomenon is likely due to background reads caused by physiological RNA degradation independent of Dcr1 and Ago1; the signal noise is visible in the WT control strains for highly abundant transcripts (see for example, SCR1; Supplemental Fig. S2).
The s/a loci we identified are a rich resource for further exploration of yeast genome annotation, antisense interference, and a possible effect of dsRNA formation on sense mRNA-encoded protein levels. The latter idea is in keeping with our previous observation that highly meiotically induced antisense transcripts are associated with decreased protein levels in the cases of Igd1 (glycogen catabolism), and Pry1 (sterol transport) (Fig. 5D–G; Becker et al. 2017). Should such a mechanism indeed operate during sporulation, it likely functions as a modulating layer of developmental stage-specific regulation rather than a strong on/off switch, since lncRNA levels do not exceed mRNA concentrations during the process (Fig. 5E,G).
Subsequently, we asked which s/a loci are detected in previous related work and our study. To this end, we compared 240 transcripts that were associated with dsRNA formation (see Supplemental Table S5 from Drinnenberg et al. 2009) to 552 protein-coding and noncoding RNAs identified in our study (Supplemental File S2). We identified 15 s/a loci, including one pair of ORFs, nine mRNA/SUT cases, two mRNA/CUT cases, and three mRNA/MUT loci (Fig. 6A).
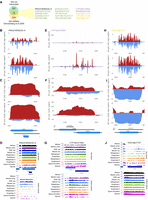
Comparison of dsRNA data output. (A) A Venn diagram shows the result of comparing s/a loci identified in earlier work by Drinnenberg et al. (2009) and our study. Fifteen transcript pairs are shown and color-coded according to the antisense RNA type in black (mRNA), green (SUT), violet (CUT), and orange (MUT). (B–D) Filled line and bar diagrams representing mRNA/mRNA dsRNAs (top), mitotic linear or log2-transformed gene expression data from (Xie et al. 2019) (middle), and Brar et al. (2012) (bottom) are shown for the s/a locus given at the top. (E–G) Filled line and bar diagrams showing dsRNA profiling data and RNA-seq data are given for an mRNA/CUT s/a locus as indicated. (H–J) Filled line and bar diagrams showing dsRNA profiling data and RNA-seq data are given for an mRNA/MUT s/a locus as indicated.
The PRO3/YER023C-A s/a locus shows a meiosis-specific dsRNA signal, which is most likely due to the expression profiles: PRO3 is cell cycle–regulated during mitosis and highly expressed during meiosis, while the antisense transcript peaks in early meiosis (Fig. 6B–D). YER023C-A is annotated as a dubious ORF and does not correspond to the early MUT-like antisense RNA detected by RNA profiling (Fig. 6D).
CTF19/CUT904 is a complex case because the dsRNA data reveal a very weak mitotic signal and a strong meiotic signal predominantly associated with antisense IRC15 that overlaps CTF19’s 3′ UTR (Fig. 6E–G). Both sense and antisense RNAs appear to fluctuate during the mitotic cell cycle and show robust meiotic expression (Fig. 6F,G).
TOS1/MUT147 display a dsRNA signal peaking in differentiating cells, which can be explained by the strong expression bias of MUT147 for meiosis (MUTs are not strictly meiosis-specific but in general show peak levels in differentiating cells; Fig. 6H–J). We note that data shown for PRO3/YER023C-A and TOS1/MUT147 are log2 transformed to reveal minute levels of antisense transcripts in mitotic cells.
The overlap between s/a loci from Drinnenberg et al. (2009) and our study comprises cases that show clear dsRNA signals; however, it is fairly small. This might be a consequence of different strain backgrounds (S288C vs. SK1), distinct methods for dsRNA identification (haploid mitotic growth versus differential expression during diploid mitotic division and meiotic differentiation) and different threshold levels for detection.
The SensR query interface, report page output, and data navigation
To facilitate interpreting dsRNA profiling data for members of the yeast biology community, we have developed the freely available Sense/Antisense double stranded RNA (SensR) online viewer. Users begin a SensR query by pressing the Start button (Fig. 7A) and selecting individual or averaged (merged) samples for data display from pop-up menus by mousing over the sample symbols from three different studies as indicated (Fig. 7B). Next, pop-up menus in select visualization option include the plot type (heatmap, fill, line), the library type (stranded or not stranded), the scale (linear or log2), and data normalization (yes, no; Fig. 7C). Furthermore, it is possible to adjust the output's complexity by selecting items in the gene annotation section, notably different types of noncoding and protein-coding RNAs (Fig. 7D). Users are also able to input the locus of interest in the genomic location section by selecting the chromosome number from a pop-up menu and entering chromosomal coordinates (e.g., chr01 or 1-230218), and by entering systematic or standard gene names for mRNAs and lncRNAs into the text fields (Fig. 7E). Finally, compressed sets of files in bigWig format are available via the download data section in the query form (Fig. 7F). This enables users with bioinformatics skills to further analyze the data using expert software.
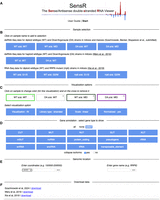
SensR start page and query interface. (A) The welcome page contains a link to the downloadable user guide in PDF format and the Start button. (B) The query interface is shown. (C) Preselected samples are given at the top. Various options for data display are given at the bottom. (D) Options to increase or reduce the data content of the report page are shown. (E) Query options using genome coordinates (left) or gene names (right) are displayed. (F) Data sets defined by references are provided via download links that allow for retrieving compressed files in bigWig format for further analyses using standalone software solutions.
The dsRNA profiling experiment was designed to allow for the detection of dsRNAs formed in diploid yeast cells during asynchronous mitotic growth in rich medium with glucose (YPD) and meiotic development in a liquid sporulation medium (SPII). Our mitotic dsRNA samples (DA a/al. MIT) are comparable to YPD and YPA (presporulation medium, which is rich medium with acetate instead of glucose) tiling array expression data available via the Saccharomyces Genomics Viewer (SGV; http://sgv.genouest.org; Lardenois et al. 2011) and the Mitosis sample in the RNA-seq data set as published by Brar et al. (2012) (Supplemental Fig. S3). For reasons related to the timing of meiotic landmark events in the strain background and sporulation efficiency, users should compare the meiotic dsRNA (DA a/al. MEI) sample to SPII 3h, 4h tiling array expression data. Likewise, the DA-MEI sample should be compared to Meiotic entry and DNA replication RNA-seq samples. To illustrate the approach to interpreting the data, we compared RNA versus dsRNA profiling data at the YDR061W/SUT470 and PCH2/SUT449 s/a loci. The former yields robust dsRNA signals in mitosis and meiosis that are explained by corresponding RNA expression levels, while the latter yields no dsRNA signals because PCH2 mRNA is undetectable in cells that undergo mitotic growth in YPD, and SUT449 peaks late in meiosis (Supplemental Fig. S3A,B).
The SensR output page shows a header, which includes a text field for genome coordinates (top left) or individual genes (top right), and arrows that enable users to move up- or downstream from the initial target region. Furthermore, the report page contains a zoom function and the possibility to download the data as images in PNG and vectorized SVG formats when mousing over the camera symbol (Fig. 8A).
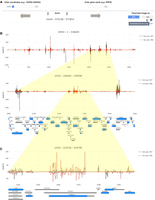
Zooming from a chromosome to an individual gene. (A) Query options, zoom, up/downstream shifting functions, and the buttons for selecting the format of images to be downloaded via the camera icon are shown. (B,C) An example of color-coded line diagrams for samples as indicated in the legend (top right corner) from an entire chromosome and selected regions is shown. Genome coordinates (x-axis) are plotted against expression data (read/nt). Protein-coding genes are shown in blue and noncoding genes in gray. The genome coordinates of the selected regions are given at the top.
The genome coordinates in bases (x-axis) are plotted against the mitotic and meiotic sample's read/nucleotide value (read/nt, normalized measures for the number of reads mapped to the locus [see Materials and Methods for details] y-axis). Users are able to generate a global view of an entire chromosome by entering the appropriate genome coordinates, such as chr03 1-316620; this approach allows for rapidly zooming in on loci showing unusually strong signals or clusters of dsRNAs by entering appropriately adjusted genome coordinates. Such an approach identifies a strong dsRNA signal associated with the s/a locus TVS1|YCR061W/SUT458 during rapid mitotic growth and division (Fig. 8B,C). We note that this gene is involved in chemical stress responses and the protein level is lowest in untreated cells cultured in rich medium with glucose and peaks in stressed and quiescent cells (see SGD at www.yeastgenome.org for data and references) (Engel et al. 2022). It would be interesting to study the TVS1/SUT458 RNA levels, dsRNA formation, and protein levels under various growth and stress conditions.
SensR provides color-coded line diagrams, filled diagrams, and a heatmap display as shown in DA a/al. MIT and DA a/al. MEI samples for YDR061W/SUT470, for which the dsRNA signals (displayed as linear values) precisely correspond to the yeast genome annotation data (Fig. 9A–C). Both sense and antisense transcripts appear to be expressed at fairly comparable levels during the diploid cell cycle (as shown via log2-transformed expression data to avoid signal squashing by highly expressed adjacent genes; Fig. 9D).
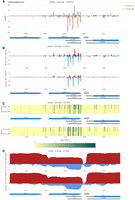
SensR data display options. (A) A color-coded line diagram plots linear dsRNA profiling data (read/nt, x-axis) for a selected s/a locus in samples from a diploid Dicer/Argonaut strain cultured in rich medium or sporulation medium (DA a/al. MIT and MEI) against genome coordinates (y-axis). (B,C) The dsRNA data are displayed for the same region as a filled diagram (linear) or a heatmap (log2). (D) Corresponding log2-transformed RNA-expression data are shown for the region as determined in WT (a/al.) samples at G1/S and G2/M phases as indicated to the left.
DISCUSSION
Stable dsRNA formation of mRNA and lncRNA pairs is of considerable interest for a better understanding of mechanisms involved in eukaryotic gene regulation. dsRNAs formed by overlapping mRNAs and coding/lncRNAs are associated with transcript stability and subcellular localization in budding yeast and cell cycle progression in mammalian cells. Interestingly, the male germline was found to harbor a large number of dsRNAs that are enriched in NATs (Portal et al. 2015; Sinturel et al. 2015; Wery et al. 2016; Werner et al. 2021; Coban et al. 2024).
Little is known about the biological roles of dsRNAs that involve sense mRNAs and antisense lncRNAs other than controlling transcript stability and silencing endogenous retrotransposons (Drinnenberg et al. 2009; Sinturel et al. 2015; Wery et al. 2016). Emerging evidence associates RNA pairing with altered protein levels during meiotic development (Becker et al. 2017; Yeager et al. 2021). Consistently, a relevant study showed that antisense SUTs down-regulate the levels of proteins encoded by overlapping sense mRNAs, but the mechanism underlying this phenomenon is not completely understood. Our dsRNA profiling data indicate that several of these loci form stable dsRNAs, which is in keeping with a subtle negative regulatory role of protein levels for certain paired RNAs (Huber et al. 2016). Such a mechanism would imply that antisense transcripts strongly induced under certain conditions could recruit most, if not all of the sense transcripts into dsRNAs, which could impair processes such as translation. We note that the control of protein synthesis via dsRNA formation by mRNAs and so-called NATs is a widely accepted mechanism in mammals that has been known for many years (for review, see Faghihi and Wahlestedt 2009).
It is currently not entirely clear to what extent yeast dsRNAs are physiologically relevant apart from regulating transcript stability/localization. It is possible that dsRNA structures per se fulfil regulatory roles; one example would be an analogous human dsRNA formed by overlapping sense-antisense lncRNAs that interact with a cell cycle regulator (Portal et al. 2015). In related work, pervasive formation of dsRNAs that triggers a gene copy number-dependent RNA degradation mechanism was suggested to be a mechanism for preventing gene amplification by transposable elements (Cruz and Houseley 2014).
We have observed that growth- or developmental stage-specific dsRNA signals typically are due to the absence of either sense or antisense transcripts in one of the conditions (see Supplemental File S2; Supplemental Fig. S3). The currently available transcriptome and dsRNA profiling data were generated with different technologies (Affymetrix tiling arrays and Illumina RNA-seq) in different SK1-derived strain backgrounds, which makes a combined data analysis challenging. It would, in any case, be interesting to integrate strand-specific genome-wide RNA-, dsRNA-, ribosome-, and protein-profiling data in a comprehensive experiment that includes samples from a fermenting, respiring, and sporulating yeast DA strain. A more thorough analysis, including dsRNA detection by immunoprecipitation and RNA-seq using the J2 antibody as in Werner et al. (2021), would enable us to ask if dsRNAs always form when both s/a RNAs are expressed, and it would identify a core set of robust dsRNAs that are detected independently of the method employed. Such an approach would likely allow for insights into the full spectrum of dsRNAs present in dividing and differentiating cells.
Further experiments, such as in cis and in trans overexpression of antisense RNAs in combination with (semi)quantitative immunoprecipitation of dsRNAs, and quantification of corresponding sense mRNA/protein levels are needed to clarify the question if mRNA translation is affected by s/a RNA pairing in yeast. Given the broad implications of dsRNA formation in eukaryotic biology, we are confident that the data available via SensR and the NCBI's GEO repository will inspire and facilitate further work in S. cerevisiae and, in the rare cases of highly conserved s/a loci (such as yeast RRP6/MUT1312 and human EXOSC10/EXOSC10-AS1) also mammalian model organisms and humans.
MATERIALS AND METHODS
Yeast strains, media, and sporulation assays
We employed SK1 WT and DA strains as described; genotypes are detailed in Table 1 (Wery et al. 2016). We cultured cells in standard rich medium with glucose (YPD) or acetate (YPA) and in sporulation medium (SPII) at 30°C as previously reported (Primig et al. 2000). Progression through the meiotic developmental pathway was monitored by determining the formation of bi-, and tetranuclear cells during Meiosis I and II (MI, MII), and ascus formation using standard procedures based on DAPI staining and UV-light microscopy (Primig et al. 2000).
Yeast strains
Small RNA-seq raw data production
We prepared small RNA libraries as described (Sinturel et al. 2015). We followed the recommendations outlined in the TruSeq Small RNA Sample Preparation Guide (Illumina). We purified small RNAs from total RNA run on a 15% TBE-urea polyacrylamide gel and controlled the quality of the total RNA fraction and purified small RNAs using RNA Chips and a 2100 BioAnalyzer (Agilent). We performed single-end sequencing (40 bases) of the libraries on a HiSeq 2500 sequencer (Illumina). We removed adapter sequences using cutadapt, and uniquely mapped reads to the S288C reference genome allowing for three mismatches using Bowtie version 0.12.7 (Langmead et al. 2009). The number of total reads, mapped reads, and unique mapped reads in general and unique mapped reads comprising 19–23 nt, in particular, are summarized in Supplemental File S1.
RNA profiling data visualization
Expression data obtained with GeneChips covering the entire yeast genome on both strands (Tiling arrays) are available for viewing and as downloadable heatmaps in PDF format via http://sgv.genouest.org. RNA-seq data from Brar et al. (2012) were imported into the Integrative Genomics Viewer 2.8.0 (IGV; see https://igv.org) and displayed using color-coded bar diagrams.
dsRNA profiling data analysis
We mapped unique reads onto the S. cerevisiae S288C sacCer3 reference genome (v64) using TopHat version 2.0.9 (Trapnell et al. 2012). We extended the annotation of the reference genome to include several classes of lncRNAs (CUTs, SUTs, and MUTs, as reported in Lardenois et al. 2011) and set the parameters to align each read only once (max-multihits = 1), allowing for two mismatches. We obtained tag densities for genes, dubious ORFs, sn(o)RNAs, tRNAs, and classes of lncRNAs after quantification and normalization with CuffLinks version 2.2.1 (Trapnell et al. 2012). To detect highly differentially expressed elements, we performed a stringent analysis, whereby we first selected elements with at least one abundance value above the 90th percentile, and then we filtered for elements with a fold change above five. Finally, we used the Limma R Package, implementing a t-test with linear estimation of variance to detect differentially expressed reads in the remaining elements (Bonferroni corrected P-value <0.01). We then carried out an analysis in R to detect all pairs of overlapping elements showing an overlap of >200 bases from the reference genome, including several classes of lncRNAs. We scored a pair of transcripts as overlapping when at least one element was retrieved by the differential analysis. We included our previously reported data for the yeast proteome and transcriptome in the context of SGD's functional annotation in the analysis output (Supplemental File S2; Lardenois et al. 2011; Lavigne et al. 2012; Ng et al. 2020).
dsRNA data transformation, clustering, and visualization
For data visualization, we employed the Row Z-score, a scaling method commonly used in heat maps. This technique enhances signals for genes that exhibit similar patterns of differential gene expression across a given sample set. The Z-score is calculated using the formula z = (x - μ)/σ, whereby x represents the signal value, μ is the mean value across all samples, and σ is the standard deviation. s/a loci were organized into five groups based on the transcript types that were paired (mRNA/mRNA, mRNA/SUT, mRNA/CUT, mRNA/MUT, and lncRNA/lncRNA), and clustered using a supervised algorithm.
Raw RNA-seq data deposition
We deposited the dsRNA profiling data reported in this publication to NCBI's Gene Expression Omnibus (GEO) (Edgar et al. 2002). Raw data are accessible via the GEO Series accession number GSE77446.
Database development
SensR displays data from high-throughput sequencing technologies in the context of genome annotation information. The viewer
employs profiling data in bigWig format and gene annotation data in gtf format; the data are stored locally on the server.
SensR runs on the open-source Apache web server under the Linux operating system (Ubuntu). The html graphical user interface
is generated by a PHP script. A JavaScript Object Notation (JSON) object containing image information is generated by a Python
script; the output image is produced by the Plotly JavaScript open-source graphing library using the JSON object. Data normalization was carried out using the total read number
and the formula
 where x is the minimal total mapped read number for all samples.
dsRNA data viewer
The dsRNA profiling data set and complementary data published by Wery et al. (2016) and Xie et al. (2019) are available online via the genomics Sense/Antisense dsRNA expression (SensR) viewer accessible at http://sensr.genouest.org. Users are also able to download sets of compressed data files in bigWig format via the query page for further analysis using expert software. The site provides access to a succinct user guide.
SUPPLEMENTAL MATERIAL
Supplemental material is available for this article.
ACKNOWLEDGMENTS
This study was in part funded by a postdoctoral fellowship by La Region Bretagne (SAD) and a Croatian Science Foundation Grant (IP-2022-10-6851) to I.S., ANR (“DNA-life”—ANR-15-CE12-0007) and ERC (“DARK”—consolidator grant) to Antonin Morillon, and La Ligue Contre le Cancer (CD35 and CD29) to Michael Primig. Inserm and the University of Rennes provided further funding. High-throughput sequencing was performed by the ICGex NGS platform of the Curie Institute that was supported by grants ANR-10-EQPX-03 (Equipex) and ANR-10-INBS-09-08 (France Génomique Consortium) from the Agence Nationale de la Recherche (“Investissements d'Avenir” program), by ITMO-Cancer Aviesan (Plan Cancer III), and by the SiRIC-Curie program (SiRIC Grant INCa-DGOS-465 and INCa-DGOSInserm_12554). Data management, quality control, and primary analysis were performed by the Bioinformatics platform of the Curie Institute.
Footnotes
-
Article is online at http://www.rnajournal.org/cgi/doi/10.1261/rna.080290.124.
- Received October 18, 2024.
- Accepted January 4, 2025.
This article is distributed exclusively by the RNA Society for the first 12 months after the full-issue publication date (see http://rnajournal.cshlp.org/site/misc/terms.xhtml). After 12 months, it is available under a Creative Commons License (Attribution-NonCommercial 4.0 International), as described at http://creativecommons.org/licenses/by-nc/4.0/.




