


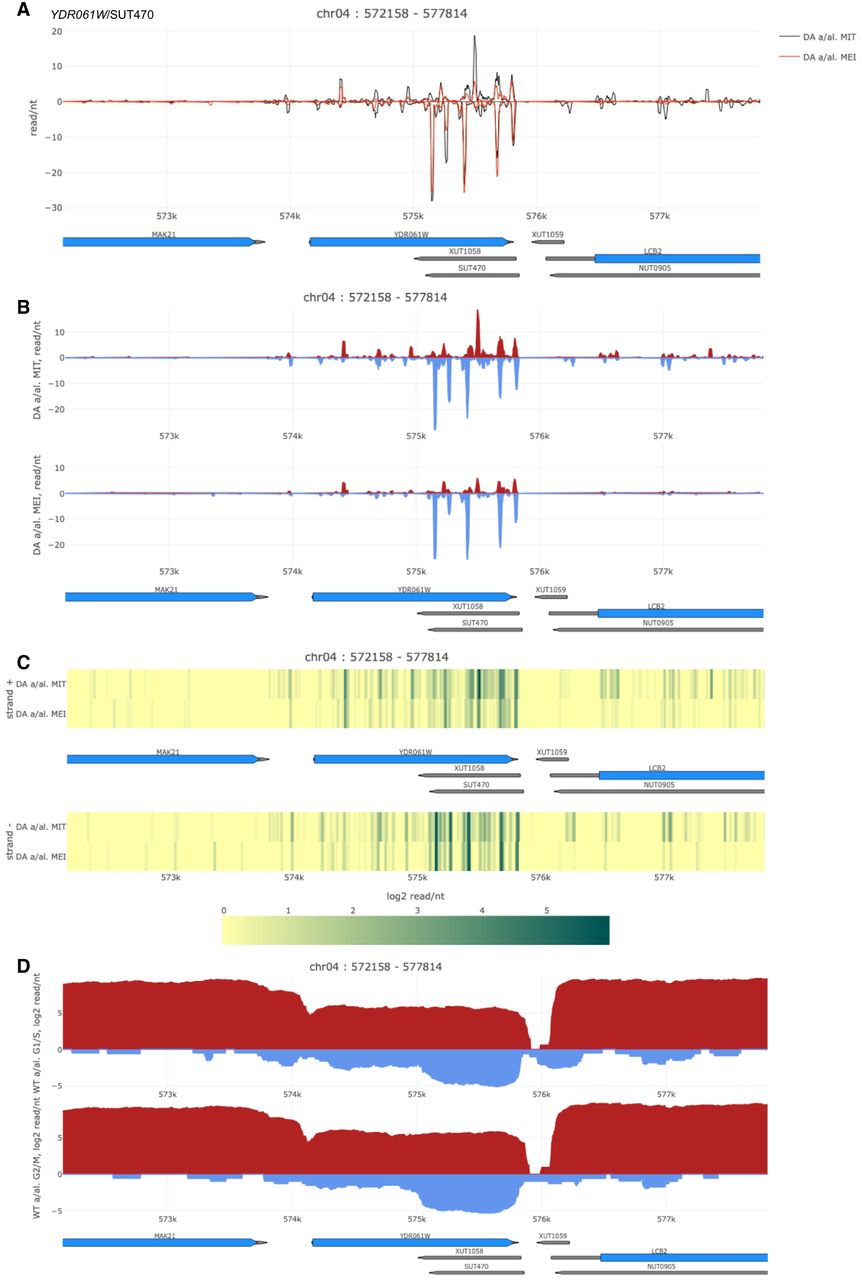
FIGURE 9.
SensR data display options. (A) A color-coded line diagram plots linear dsRNA profiling data (read/nt, x-axis) for a selected s/a locus in samples from a diploid Dicer/Argonaut strain cultured in rich medium or sporulation medium (DA a/al. MIT and MEI) against genome coordinates (y-axis). (B,C) The dsRNA data are displayed for the same region as a filled diagram (linear) or a heatmap (log2). (D) Corresponding log2-transformed RNA-expression data are shown for the region as determined in WT (a/al.) samples at G1/S and G2/M phases as indicated to the left.




