


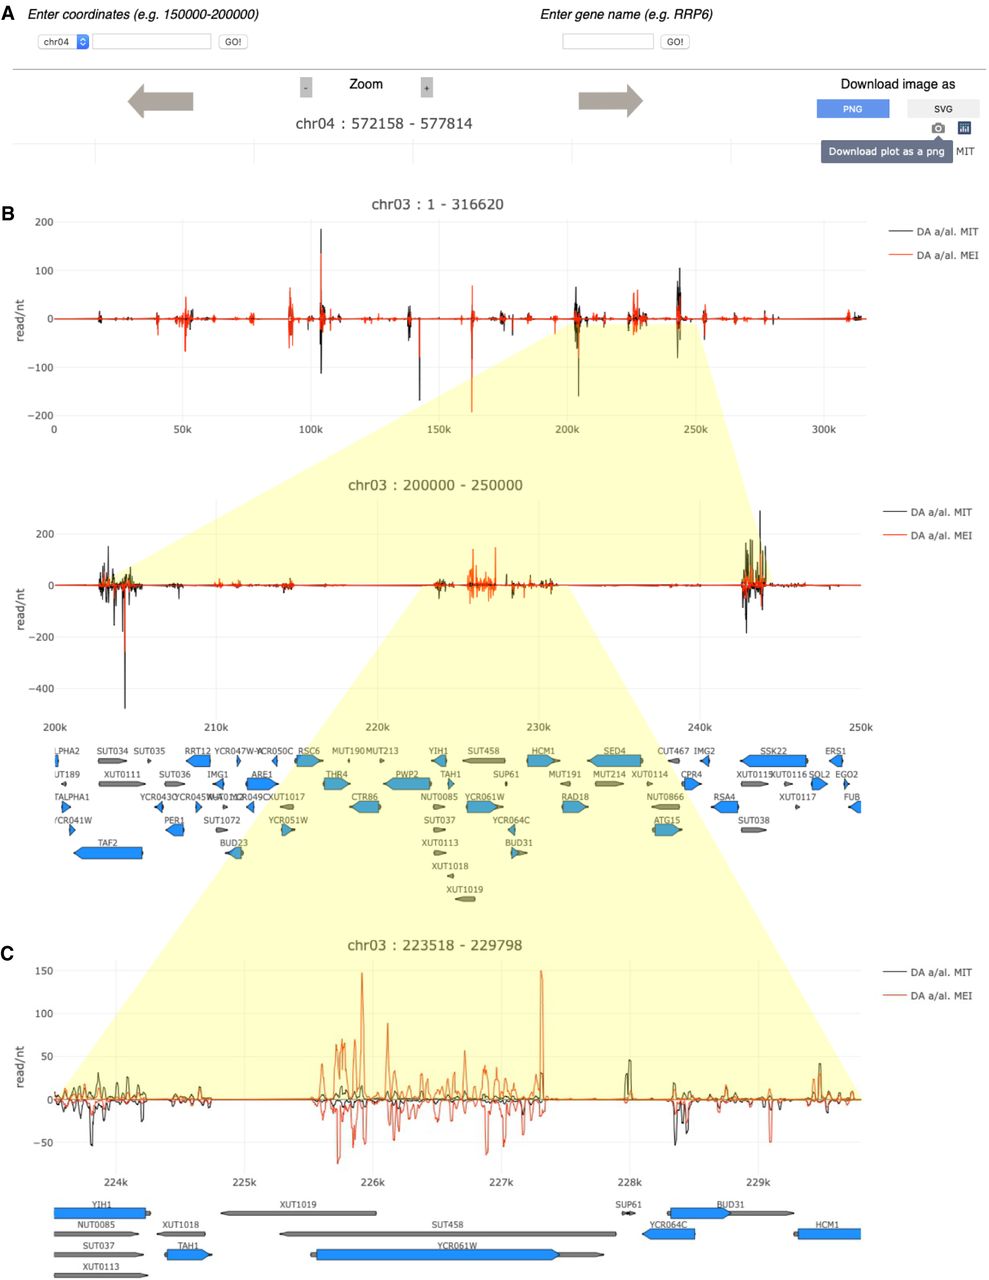
FIGURE 8.
Zooming from a chromosome to an individual gene. (A) Query options, zoom, up/downstream shifting functions, and the buttons for selecting the format of images to be downloaded via the camera icon are shown. (B,C) An example of color-coded line diagrams for samples as indicated in the legend (top right corner) from an entire chromosome and selected regions is shown. Genome coordinates (x-axis) are plotted against expression data (read/nt). Protein-coding genes are shown in blue and noncoding genes in gray. The genome coordinates of the selected regions are given at the top.




