


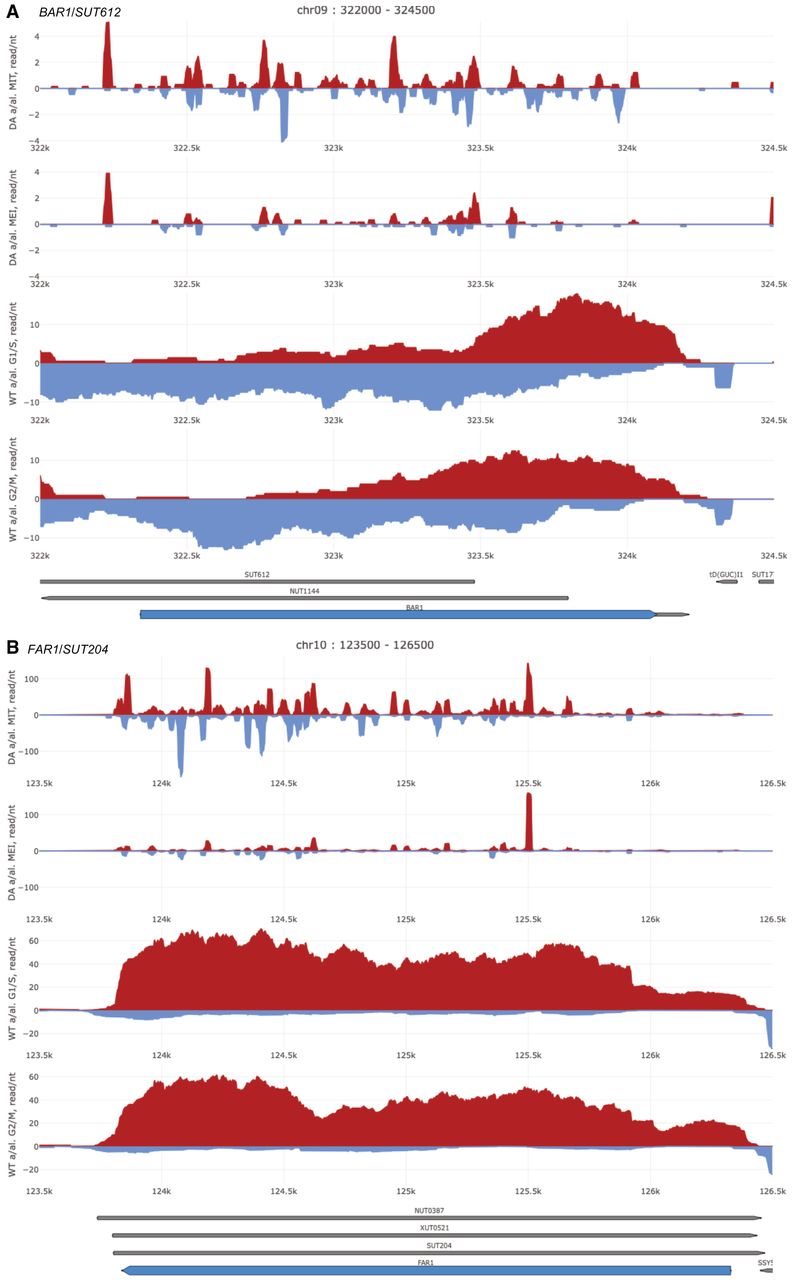
FIGURE 4.
s/a locus dsRNA formation and gene expression. (A,B) A filled line diagram shows dsRNA profiling data (top) and RNA expression data (bottom) for s/a loci indicated at the bottom. Samples are shown to the left and s/a locus annotation and genome coordinates are given at the top.




