


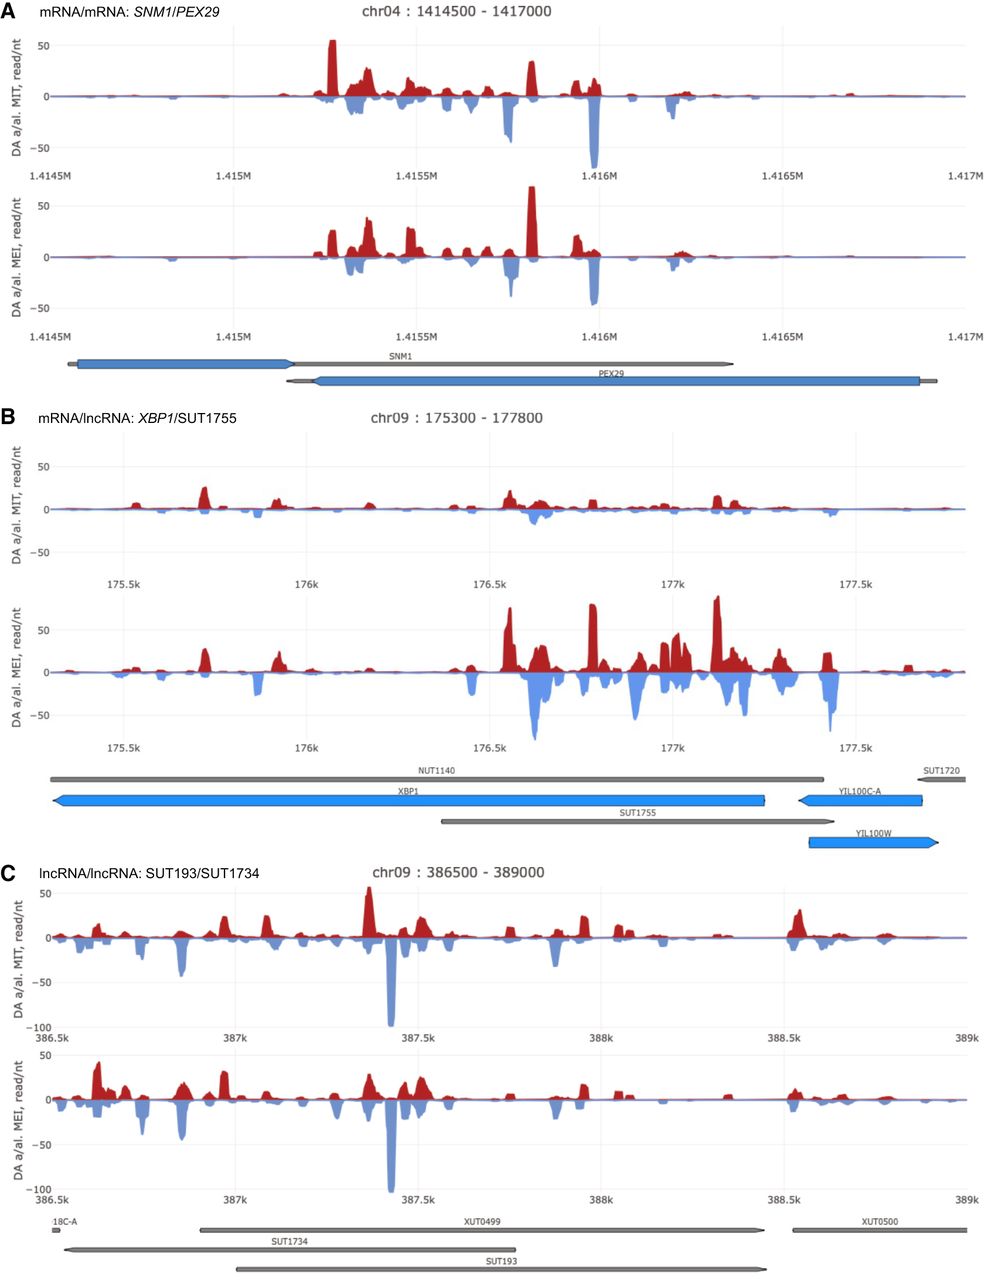
FIGURE 2.
Three major s/a loci classes. (A–C) Examples of dsRNA data are shown for RNA pairs involving different coding and noncoding transcripts as linear filled diagrams. Genome coordinates (x-axis) are plotted against normalized linear reads (read/nt; y-axis). Top and bottom strand signals are given in red and blue. Protein-coding and noncoding genes are shown in blue and gray, respectively. Samples from diploid wild-type (WT a/al.) and DA (a/al.) strains in mitosis (MIT) and meiosis (MEI) are given to the left. RNA types and s/a locus names are given at the top. Images were created with SensR.




