


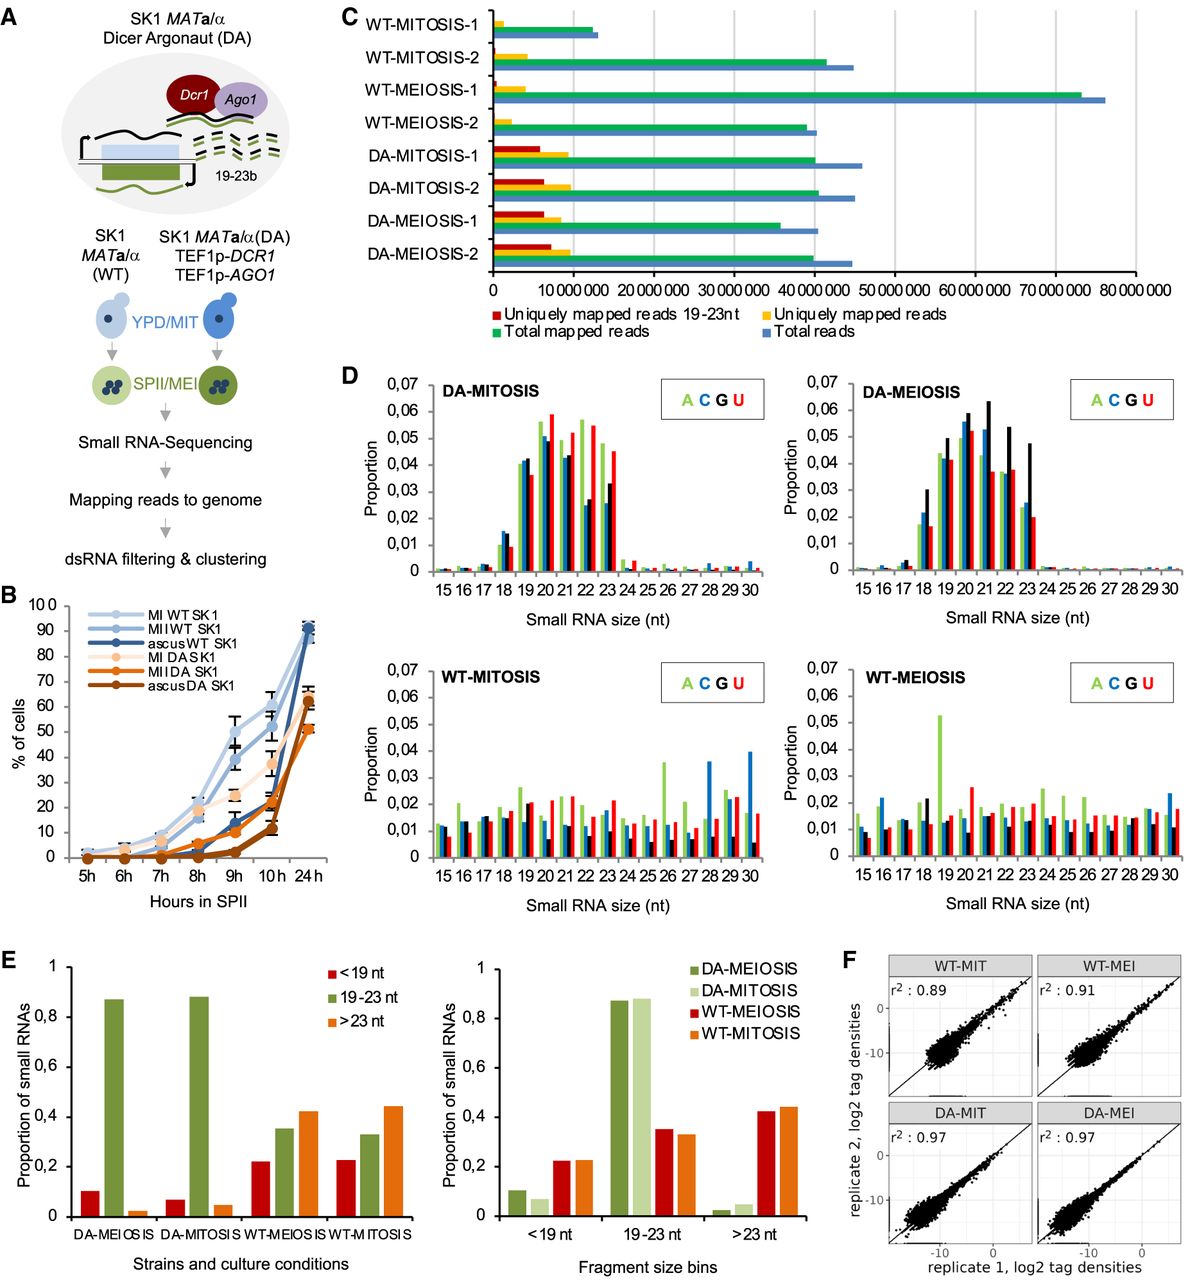
dsRNA profiling method and quality control. (A) A schematic outlines the experimental workflow of the dsRNA profiling experiment. (B) A color-coded line diagram plots culture time in hours (x-axis) against the percentage of cells that have completed Meiosis I, II, and ascus formation in WT and DA strains as outlined in the legend. (C) A color-coded bar diagram plots numbers obtained for different categories of reads (x-axis) against strains and experimental conditions as indicated (y-axis). A legend at the bottom shows the colors of the read types. (D) Color-coded bar diagrams plot RNA fragment size in nucleotides (small RNA size [nt]; x-axis) against the proportion of A, C, G, and U nucleotides in sequence reads (proportion; y-axis) for samples from WT and DA strains in mitosis and meiosis as indicated. Legends show the color code for bases. (E) The color-coded bar diagram to the left plots strains and culture conditions (x-axis) as indicated against the proportion of small RNAs detected in them (y-axis). A legend shows the color code for nucleotide fragment bins. The diagram to the right plots fragment size bins as indicated (x-axis) against the proportion of small RNAs in the WT and DA strains as shown in the legend (y-axis). (F) Scatter plots of log2 transformed tag densities are shown for replicates 1 (x-axis) and replicates 2 (y-axis) for WT and DA strains cultured in rich medium (MIT) and sporulation medium (MEI) as shown. The coefficient of determination (r2) is indicated.




