


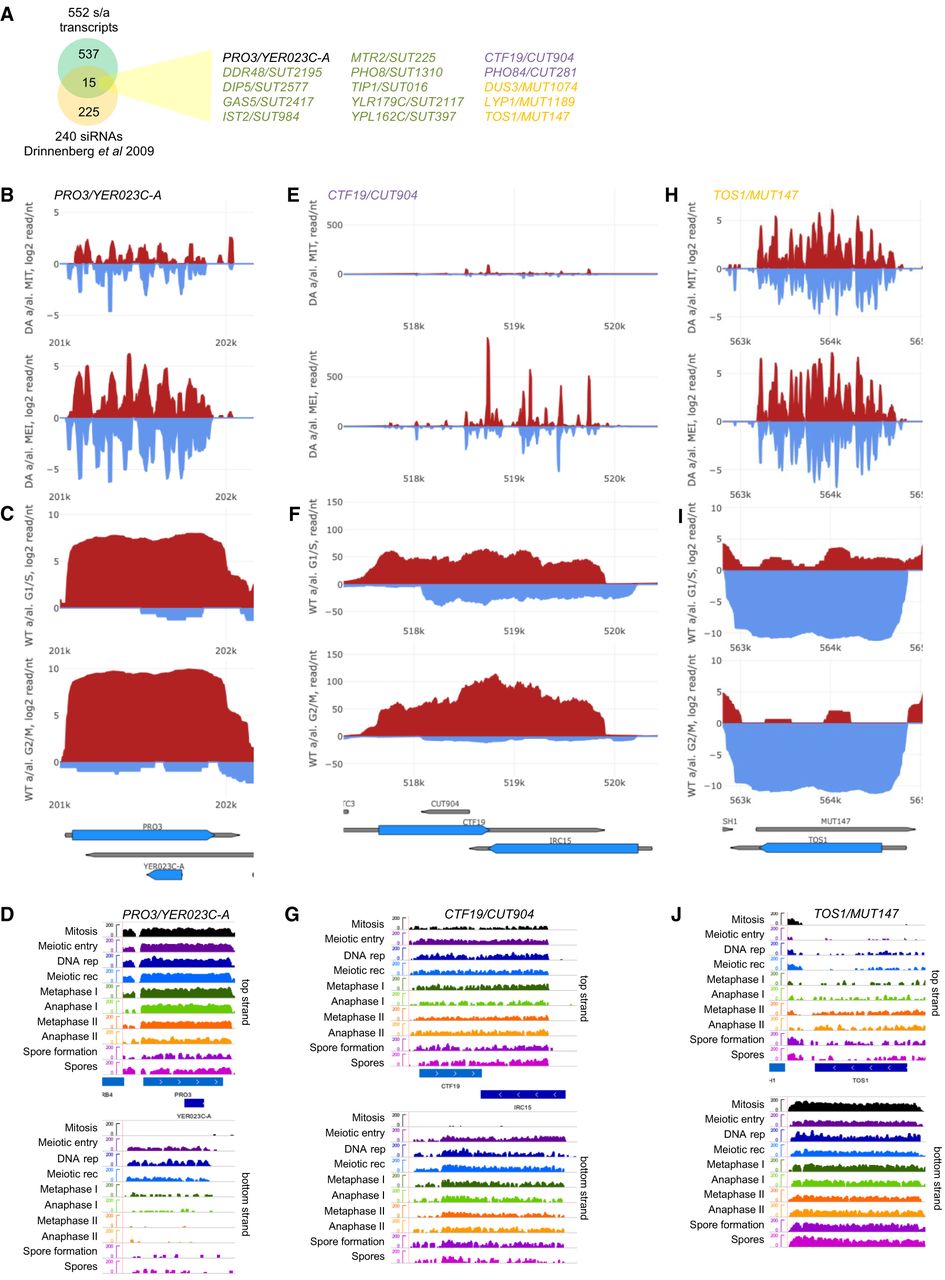
Comparison of dsRNA data output. (A) A Venn diagram shows the result of comparing s/a loci identified in earlier work by Drinnenberg et al. (2009) and our study. Fifteen transcript pairs are shown and color-coded according to the antisense RNA type in black (mRNA), green (SUT), violet (CUT), and orange (MUT). (B–D) Filled line and bar diagrams representing mRNA/mRNA dsRNAs (top), mitotic linear or log2-transformed gene expression data from (Xie et al. 2019) (middle), and Brar et al. (2012) (bottom) are shown for the s/a locus given at the top. (E–G) Filled line and bar diagrams showing dsRNA profiling data and RNA-seq data are given for an mRNA/CUT s/a locus as indicated. (H–J) Filled line and bar diagrams showing dsRNA profiling data and RNA-seq data are given for an mRNA/MUT s/a locus as indicated.




