


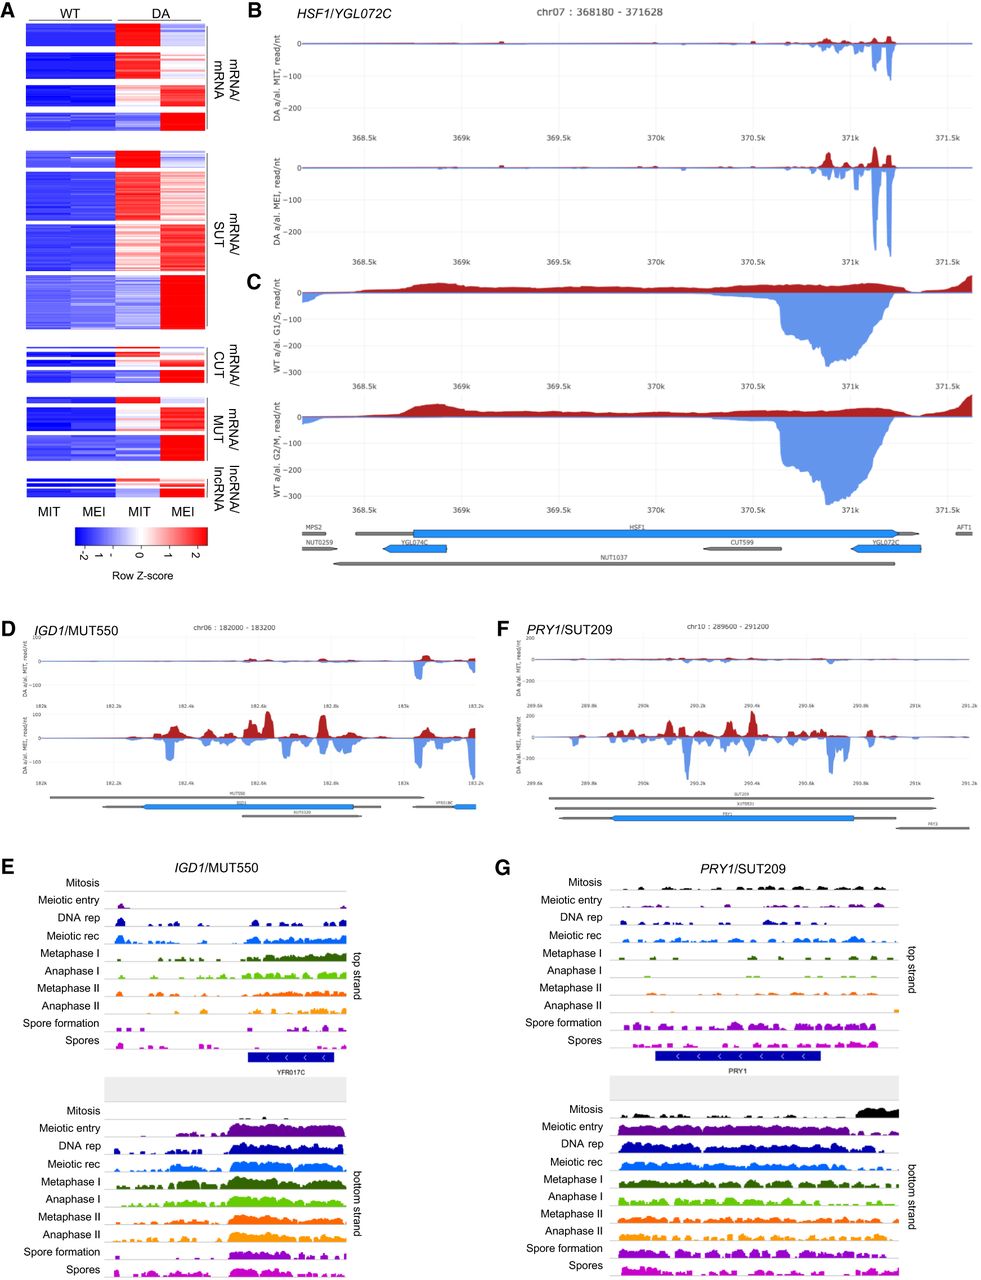
dsRNA classes and s/a locus gene expression. (A) A color-coded heatmap shows z-score transformed (the z-score is the number of standard deviations any given data point is above or below the mean value), and clustered dsRNA signals obtained with WT and DA strains in mitosis (MIT) and meiosis (MEI). A row z-score scale is given at the bottom. (B,C) dsRNA signals are shown as a filled diagram for the region indicated. Normalized strand-specific RNA-seq expression data (read/nt, y-axis) for arrested WT cells released into rich medium and sampled after 40 min (G1/S) and 100 min (G2/M) are plotted for the same region as a filled diagram (x-axis). (D–G) dsRNA formation and RNA expression data are shown for two s/a loci encoding proteins known to be down-regulated during sporulation. RNA-seq data for mitosis versus meiotic development from Brar et al. (2012) are shown as a color-coded filled diagrams for top and bottom strands. Growth and differentiation phases are indicated to the left. Only protein-coding genes are displayed as blue bars. White arrowheads indicate the sense of transcription. Images were created with IGV 2.8.0 and edited for clarity. We note that SUT/MUT ncRNA annotation data are not displayed because for technical reasons, we employed a genome definition file, which contains only mRNA coordinates (the systematic name YFR017C is displayed for IGD1).




