


Structural analysis of the lncRNA SChLAP1 reveals protein binding interfaces and a conformationally heterogenous retroviral insertion
- 1Department of Biochemistry, Duke University School of Medicine, Durham, North Carolina 27710, USA
- 2Department of Chemistry, Duke University, Durham, North Carolina 27708, USA
- 3Department of Chemistry, University of Toronto, Mississauga, Ontario, L5L1C6, Canada
- Corresponding author: amanda.hargrove{at}utoronto.ca
-
Handling editor: Ling-Ling Chen
Abstract
The lncRNA second chromosome locus associated with prostate 1 (SChLAP1) was previously identified as a predictive biomarker and potential driver of aggressive prostate cancer. Recent work suggested that SChLAP1 may bind the SWI/SNF chromatin remodeling complex to promote prostate cancer metastasis, though the exact role of SWI/SNF recognition is debated. To date, there are no detailed biochemical studies of apo SChLAP1 or SChLAP1:protein complexes. Herein, we report the first secondary structure model of SChLAP1 using SHAPE-MaP in vitro, in cellulo, and ex cellulo (protein-free). Comparison of the ex cellulo and in cellulo data via ΔSHAPE identified putative protein binding regions within SChLAP1. In addition, phylogenetic analysis revealed that SChLAP1 is a primate-conserved lncRNA, with two exons significantly derived from primate-specific retroviral insertions. In particular, we characterized a complex structural landscape in a protein binding region at the 3′-end of SChLAP1 derived from a THE1B-type retroviral insertion, suggesting a role for an exapted RNA structure in SChLAP1:protein recognition and prostate cancer progression. Lastly, pulldowns of SChLAP1 substructures enabled identification of previously unestablished SChLAP1-interacting proteins. This work lays the foundation for future efforts to selectively target and disrupt SChLAP1 structures and/or protein interfaces and to develop new therapeutic avenues in prostate cancer treatment.
Keywords
INTRODUCTION
Prostate cancer is one of the most commonly diagnosed cancers among American men, alone accounting for 27% of all cancer diagnoses in men, and it is the second leading cause of cancer-related death in American men (Siegel et al. 2022). While several treatment options are available for prostate cancer, including prostatectomy, radiation-based therapies, chemotherapy, immunotherapy, and hormone deprivation therapies (PDQ® Adult Treatment Editorial Board, https://www.cancer.gov/types/prostate/patient/prostate-treatment-pdq), none of these treatments provide a cure for prostate cancer. Additionally, the subsequent emergence of metastatic prostate cancer, also known as aggressive prostate cancer, in a subset of patients rapidly results in treatment resistance and a significantly bleaker prognosis (Siegel et al. 2022). Given the high incidence of prostate cancer and the correspondingly large clinical burden of metastatic prostate cancer, there is an urgent and unmet need for specific therapeutic strategies that target molecular drivers of aggressive prostate cancer.
Noncoding RNA remains an underexplored area for therapeutic development, particularly via small molecule–based therapies (Warner et al. 2018; Costales et al. 2020; Falese et al. 2021). Long noncoding RNAs (lncRNAs), generally defined as nontranslated transcripts ≥200 nt in length, are often differentially expressed throughout developmental stages, tissue types, and disease states (Mattick et al. 2023). Following the ENCODE project and identification of thousands of new lncRNAs (Djebali et al. 2012; ENCODE Project Consortium 2012), additional work, particularly from the FANTOM consortium, began annotating these transcripts and found biochemical indices of function historically ascribed solely to proteins (Carninci et al. 2005; Hon et al. 2017). Although there are over 100,000 identified lncRNAs (Mattick et al. 2023), only ∼20,000 of these have been implicated in biological function (Hon et al. 2017), and an even smaller portion of these have been biochemically characterized for either housekeeping or disease/cancer-associated functions (McFadden and Hargrove 2016).
The lncRNA second chromosome locus associated with prostate-1 (SChLAP1) is a prime example of the incongruity between the identification of cancer-associated lncRNAs and characterization of their biochemical function. In 2011, Prensner et al. identified the transcript prostate cancer associated transcript 114 (PCAT-114; later renamed SChLAP1) as overexpressed in tumor prostate tissue compared to benign prostate tissue (Prensner et al. 2011). In other work, Gerashchenko et al. determined that patient-derived tumors with high SChLAP1 transcript levels correlated with a Gleason score of 9, where 10 is the highest possible score and most at-risk group (Gerashchenko et al. 2018). Additionally, SChLAP1 levels correlated with high levels of epithelial-to-mesenchymal transition (EMT) markers such as vimentin (VIM), fibronectin (FN1), and matrix metalloproteinase 2 (MMP2), further supporting the correlation between SChLAP1 overexpression and prostate cancer metastasis found in multiple clinical studies (Prensner et al. 2013, 2014; Mehra et al. 2014, 2016; Chua et al. 2017; Gerashchenko et al. 2018; Kidd et al. 2021). Furthermore, Mehra et al. determined that ∼16% of clinically localized prostate cancers in American men exhibit high SChLAP1 transcript levels, suggesting use of SChLAP1 as an early detection biomarker (Mehra et al. 2014). A mechanistic role for SChLAP1 in promoting prostate cancer progression was also supported in other cell-based in vitro and in vivo experiments. Intracardiac injection of 22Rv1 (human-derived prostate cancer) cells with stable SChLAP1 knockdown into severe combined immunodeficiency mice showed a significant reduction in the number and size of metastases as compared to a nontargeting shRNA negative control. In addition, siRNA-mediated knockdown of SChLAP1 in human prostate cancer cell lines significantly reduced in vitro invasion in Boyden chamber assays as compared to nontargeting control siRNA and displayed equivalent results as compared to siRNA-mediated knockdown of EZH2 mRNA, a known promoter of cell proliferation (Prensner et al. 2013).
Furthermore, Prensner et al. showed that overexpression of SChLAP1 in the noncancerous RWPE-1 (human healthy prostate) cell line via lentiviral transduction transformed the usually noninvasive prostate cells into invasive prostate cells (as assessed by a Boyden chamber assay), supporting SChLAP1 as sufficient for promoting invasion, which was also confirmed in an independent study (Prensner et al. 2013; Raab et al. 2019). From these works, SChLAP1 overexpression was identified as a factor in three hallmarks of carcinogenesis: metastasis, proliferation, and invasion. However, despite the demonstrated biological importance of SChLAP1 in prostate cancer progression, identification of a molecular mechanism has remained elusive. Initial work from Prensner et al. identified a specific interaction between SChLAP1 and the SWItch/sucrose nonfermentable (SWI/SNF) chromatin remodeling complex (Prensner et al. 2013), which catalyzes ATP-dependent chromatin remodeling through sliding or ejection of nucleosomes from DNA and exhibits mutations in at least one of its component subunits in nearly 25% of all cancers (Roberts and Orkin 2004; Shain and Pollack 2013; Kadoch et al. 2016; Mittal and Roberts 2020). Specifically, Prensner et al. observed SChLAP1-dependent eviction of the SWI/SNF complex from chromatin, resulting in gene expression changes and facilitating an aggressive phenotype (Prensner et al. 2013). However, more recent work has identified broad, potentially nonspecific interactions between the SWI/SNF complex and RNA (Cajigas et al. 2015; Raab et al. 2019; Grossi et al. 2020; Skalska et al. 2021). In addition, Raab et al. observed that SWI/SNF remained chromatin-associated regardless of SChLAP1 expression, suggesting that genome-wide eviction of SWI/SNF was not the source of the SChLAP1-induced phenotype and that other protein interactions may be required for SChLAP1-promoted cancer aggression (Raab et al. 2019). Since these studies, several other proteins and/or protein complexes have been proposed to interact with SChLAP1, including (1) polycomb repressive complex 2 (PRC2), a histone methyltransferase (Huang and Tang 2021), (2) DNA (cytosine-5)-methyltransferase 3A (DNMT3A), a DNA methyltransferase (Huang and Tang 2021), (3) heterogeneous nuclear ribonucleoprotein L (HNRNPL) (Ji et al. 2019), and (4) heterogeneous nuclear ribonucleoprotein D0 (HNRNPD) (Du et al. 2021), which are involved in RNA processing. While the interaction between SChLAP1 and HNRNPL was localized to a specific exon within SChLAP1 (Ji et al. 2019), the specific regions of SChLAP1 involved in intermolecular recognition remain undefined.
In summary, despite these identified protein interactions and the established role for SChLAP1 in supporting aggressive prostate cancer, there is little knowledge regarding the RNA features within SChLAP1 that mediate these interactions. Elucidating the sequence– and/or structure–function relationships within SChLAP1 is critical to our understanding of both prostate cancer metastasis and the potential for SChLAP1 as a therapeutic target. Herein, we report first insights into the relationships among SChLAP1 sequence, structure, and function. First, we found that SChLAP1 is a primate-conserved lncRNA with several regions that may have been generated through retroviral insertion during primate evolution. We then generated the first in vitro secondary structural model of SChLAP1 isoform (Iso.) 1 in vitro via selective 2′-hydroxyl acylation analyzed by primer extension and mutational profiling (SHAPE-MaP) (Siegfried et al. 2014) and dimethyl sulfate mutational profiling and sequencing (DMS-MaPseq) (Zubradt et al. 2017). Through our subsequent in cellulo and ex cellulo SHAPE probing and analyses via ΔSHAPE, we identified putative protein binding regions and significantly unfolded regions across SChLAP1 in cells. We additionally identified a complex structural landscape at the 3′-end of SChLAP1 in a region derived from a potential retroviral insertion that additionally corresponds to a putative protein binding region. Lastly, using proteomics, we identified SChLAP1-binding proteins for several RNA structures identified in our work. Via western blot, we further validated SChLAP1 binding of four proteins that have previously been implicated in prostate cancer progression, suggesting that the identified SChLAP1:protein interactions may be involved in aggressive prostate cancer. As the first detailed biochemical and structural analysis of SChLAP1, this work proposes an important functional role of RNA structures within SChLAP1 for protein recognition and ultimately the metastatic phenotype associated with SChLAP1 overexpression in prostate cancer.
RESULTS
Evolutionary analysis reveals conserved and potentially functional exons of SChLAP1
Conserved RNA motifs within prokaryotic and eukaryotic transcripts are often indicative of critical function. Thus, we performed a BLAST search of the NCBI RefSeq database to identify potential homologous SChLAP1 sequences in nonhuman genomes (Zhang et al. 2000; O'Leary et al. 2016). This search revealed several nonhuman primate (NHP) sequences of SChLAP1, all of which were predicted to be noncoding but have no functional annotation to date (Fig. 1A; Supplemental Table S1). SChLAP1 sequences were not called in any nonprimate species, suggesting that SChLAP1 emerged during primate evolution, consistent with general evidence of greater lncRNA content with increasing organismal complexity and evidence that many lncRNAs are primate specific (Derrien et al. 2012; Liu et al. 2013; Mattick et al. 2023). To further evaluate SChLAP1 conservation, we examined phyloP scores for SChLAP1 in the UCSC Genome Browser (Kent et al. 2002; Pollard et al. 2010). Beginning with a 447-mammal set, we observed generally near-zero phyloP scores throughout the transcript, indicative of poor conservation (Fig. 1B; Supplemental Appendix). In contrast, phyloP scores were generally more positive in a more restricted 30 mammal (27-primate) set, indicative of conservation (Fig. 1B; Supplemental Appendix). These results suggested that SChLAP1 shows stronger conservation when comparing within the primate lineage and further supports SChLAP1 as a primate-conserved lncRNA. However, in both phyloP analyses, we observed generally negative phyloP scores for exon 1 of SChLAP1, indicative of accelerating evolution in this region of the transcript.
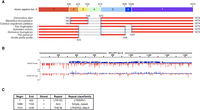
Phylogenetic analysis of SChLAP1. (A) BLAST search of isoform 4 of SChLAP1 (containing all possible human exons) against the RefSeq database. (Top) Isoform 4 of SChLAP1 with each exon shown for reference. The 3′-positions of each exon in the human SChLAP1 are labeled. (Bottom) Sequence alignments of all identified SChLAP1 homologs against human SChLAP1 isoform 4. The 5′- and 3′-positions of alignment against human SChLAP1 are noted. All BLAST alignment scores were >200. Asterisk denotes Pan troglodytes aligning at nucleotides 1006 rather than 1007. (B) PhyloP analysis of SChLAP1 isoform 4 using phyloP 30-way (top) or 447-way (bottom). Figure generated in Integrative Genomics Viewer (Robinson et al. 2011). (C) RepeatMasker analysis of SChLAP1 Iso. 1 (see also Supplemental Fig. S1).
While our BLAST search uncovered several complete putative SChLAP1 homologs in NHPs, we noted that multiple other genes (both human and NHP, including protein-coding and noncoding genes) aligned with exon 1 of SChLAP1 (not shown). This result suggested that repeat insertions, occurring not only within SChLAP1 but also in other genomic regions, may have resulted in spurious alignment in our BLAST search. These insertions (i.e., transposable elements [TEs]) are highly promiscuous DNA elements that can replicate independently from the host cell. TEs can become incorporated into coding and noncoding genome sequences and result in the formation of novel functions, such as protein recognition and/or RNA structures in lncRNAs (Johnson and Guigó 2014). To search for potential TE insertions, we analyzed the SChLAP1 Iso. 1 sequence using RepeatMasker (http://www.repeatmasker.org), focusing on SChLAP1 Iso. 1 hereafter as it is the most abundant isoform of SChLAP1 (Prensner et al. 2013). We identified two long terminal repeats (LTRs) within SChLAP1: LTR12C (DFAM accession DF0000402) within exon 1 (nucleotides 1–322; 95.3% of exon 1) and THE1B (DFAM accession DF0000818) within exon 7 (nucleotides 1123–1436; 46.9% of exon 7; Fig. 1C; Supplemental Fig. S1; Storer et al. 2021). LTRs occur at the 5′- and 3′-ends of retroviral genomes and are involved in viral processes such as replication. After integration into the host genome, the central components of the retroviral genome may be removed across evolution by recombination, such that only the LTR sequences remain (so-called solo-LTRs) (Babaian and Mager 2016; Johnson 2019). LTRs constitute over 8% of the human genome, and these sequences may be epigenetically silenced or, in contrast, “exapted” (i.e., co-opted) by the host genome for various functionalities including as promoters/enhancers (Babaian and Mager 2016; Johnson 2019). The occurrence of these sequences in SChLAP1 suggested that some of SChLAP1 function may be the result of such exaptation from these insertions and resultant RNA sequence/structure.
Our BLAST search results are consistent with evidence of retroviral insertion in exons 1 and 7. LTR12C, derived from human endogenous retrovirus 9 (HERV-9), is a Hominoidea (i.e., ape)-specific insertion. Our BLAST search only observed this sequence in Homo sapiens, Gorilla gorilla gorilla, Pan troglodytes, P. paniscus, Nomascus leucogenys, and Hylobates moloch genomes, all of which are of Hominoidea phylogeny (Schoch et al. 2020; Storer et al. 2021). In comparison, the BLAST results did not identify LTR12C insertions nor the SChLAP1 exon 1 sequence within the Colobus angolensis palliates, Cercocebus atys, or Mandrillus leucophaeus genomes (Fig. 1A); these results are consistent with known phylogeny as these species are Old World monkeys and thus of non-Hominoidea phylogeny (Schoch et al. 2020). The other retroviral insertion in SChLAP1 (THE1B) belongs to the MaLR (mammalian apparent LTR-retrotransposons) family of repeat elements. In contrast to LTR12C, THE1B is specific to Simiiformes (i.e., simians), which contains both Hominoidea and Old-World monkeys (Schoch et al. 2020; Storer et al. 2021). In turn, a complete exon 7 sequence was observed in both lineages in our BLAST search. Our results indicated that THE1B resulted in the formation of approximately half of exon 7. Given that both LTR12C and THE1B insertions are selectively found in Hominoidea and Simiiformes, respectively, we believe these data may explain why SChLAP1 did not show evidence of conservation outside of the primate lineage. TE insertions also explain the low/negative phyloP scores (i.e., accelerating evolution) in these regions of the transcript.
Using the USCS Genome Browser (Kent et al. 2002), we found that the LTR12C sequence alignment to the 5′-end of human SChLAP1 not only overlaps with the majority of SChLAP1 exon 1 but also includes the promoter region of the SChLAP1 gene (Supplemental Fig. S2). Potential retroviral incorporation within the SChLAP1 promoter has been mentioned in previous work (Prensner et al. 2013; Babaian and Mager 2016), and this analysis suggested the insertion may have also introduced novel sequence/structures into the 5′-end of the SChLAP1 transcript.
Sequence and bioinformatic analyses identify potentially functional SChLAP1 substructures
To complement our phylogenetic analysis, we used additional sequence and bioinformatic analyses to identify regions of SChLAP1 that may be crucial to its function. As above, we focused our structural analysis on SChLAP1 Iso. 1. To begin, we used ScanFold 2 (Andrews et al. 2022) to predict thermodynamically favorable and likely functional RNA secondary structures within SChLAP1. Specifically, ScanFold 2 folds a given transcript in sliding folding windows, shuffles the sequence of each window (100 times each in our case), and thereafter calculates the folding energy of each shuffled sequence. The folding energies for the native versus shuffled sequences are compared via Z-score (defined as the average minimum free energy [MFE] of the shuffled sequences subtracted from the MFE and divided by the standard deviation), where Z-scores of −1 and −2 indicated a folding window 1 and 2 standard deviations more stable than the shuffled folds, respectively. Previous work has found that regions with significantly lower energies of folding in the native versus shuffled sequence are often enriched in functional roles (Andrews et al. 2018, 2022). From this work, we identified multiple SChLAP1 structures with significantly low Z-scores (Fig. 2, top), including (1) predicted stem–loops in 5′-end of SChLAP1 (i.e., containing the LTR12C insertion); (2) the junction between exon 2 and exon 5 of SChLAP1 (hereafter referred to as the E2–E5 junction); (3) a predicted helix from nucleotides 989–1056 (within exon 7); and (4) an adjacent predicted three-way junction (3WJ, nucleotides 1141–1213) and stem–loop (nucleotides 1224–1242), both located within exon 7 and the THE1B insertion. We obtained concordant structure predictions with three independent runs of the ScanFold 1 algorithm on the SChLAP1 Iso. 1 sequence (Supplemental Fig. S3; Andrews et al. 2018). These analyses support the presence of potentially functional RNA structures within SChLAP1 on the basis of their favorable sequence-based folding properties. The above RepeatMasker analysis also suggested that some of these structures may have been derived through retroviral insertion.
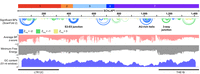
ScanFold 2 (Andrews et al. 2022) prediction of SChLAP1 Isoform 1. (Top) Significant base pairs identified using ScanFold 2. Second and third row depict average base-pair Z-score and minimum free energy of folded windows calculated by ScanFold. Bottom row shows GC content calculated over 51 nt windows. Exon coordinates of SChLAP1 Iso. 1 are depicted along with coordinates of LTR12C and THE1B insertions. Figure generated in Integrative Genomics Viewer (Robinson et al. 2011).
Additionally, we calculated the GC content of SChLAP1 in 51 nt sliding windows to identify regions of structure correlated with the more stable hydrogen bonding provided by canonical GC base pairs versus AU base pairs (Fig. 2, bottom). Overall, SChLAP1 comprises 44.5% GC but contains windows as high as ∼70% GC. Several ScanFold predicted structures occur in such high-GC regions; however, we observed that one highly predicted structure (nucleotides 989–1056) occurs within a remarkably GC-depleted region of the transcript. We refer to this predicted structure as the AU-rich helix where it appears in our analysis below.
Development of a secondary structure model for SChLAP1 in vitro using SHAPE-MaP
Our work so far has indicated that there are thermodynamically predicted functional structures within the SChLAP1 RNA transcript, some of which were derived from retroelements inserted into the primate lineage. We next set out to generate an experimentally informed secondary structure model of SChLAP1 using SHAPE-MaP. We first began by generating an in vitro structure SChLAP1 model as a preliminary reference to evaluate the propensity of these structures to form both in vitro and in cells (analyzed below). To this end, we performed SHAPE-MaP and DMS-MaP on in vitro transcribed SChLAP1 Iso. 1 isolated using a semi-native purification protocol, where both heat denaturing and harsh buffer exchanges are avoided, as previous work found this protocol superior in maintaining a homogenously folded RNA as compared to denaturing protocols (Somarowthu et al. 2015; Adams et al. 2019). We chose the SHAPE reagent 5-nitroisatoic anhydride (5NIA) for its enhanced cell permeability compared to other SHAPE reagents and precedence for use of 5NIA in prostate cancer cells (Busan et al. 2019), which enabled comparable use of 5NIA in both in vitro and in cellulo experiments.
The in vitro secondary structure model of SChLAP1 was generated with SHAPE and DMS probing, which were performed with independent batches (i.e., transcribed, purified, and probed on different days) of SChLAP1 RNA. As SChLAP1 is >1400 nt, which hinders sequencing analysis on Illumina-based platforms, we generated four overlapping amplicons (positions 1–500, 400–903, 800–1300, and 1200–1436) from the probed RNA to facilitate sequencing. These four amplicons were independently reverse transcribed (SuperScript II and Mn2+ for SHAPE probing, TGIRT for DMS) and amplified for sequencing. The SHAPE sequencing data were processed using the ShapeMapper (Busan and Weeks 2018) and SuperFold (Smola et al. 2015b) pipelines, whereas the DMS-MaPseq program was used to process the DMS data (see Materials and Methods; Zubradt et al. 2017). In both SHAPE and DMS experiments, we observed a lack of chemical reactivity in a poly(A) stretch of SChLAP1 (position 1088–1104), which is consistent with work from Kladwang et al. showing that chemical modifications in poly(A) regions are bypassed by reverse transcriptases and result in incongruous chemical modification frequency and mutational profiling results (Kladwang et al. 2020). To avoid biasing our resultant model as predicted by SuperFold/RNAstructure, we manually set this poly(A) stretch to “undefined” in the input .shape and .map files for all SHAPE-informed structure predictions of SChLAP1; setting these nucleotides to undefined removes all chemical reactivity data from these nucleotides, preventing these data from biasing the predicted secondary structure.
The MFE model (Supplemental Fig. S4A) and predicted base pairs (Supplemental Fig. S5A) of in vitro SChLAP1 reveal a complex structural landscape, including significantly base-paired regions of varying secondary structure types as well as large single-stranded regions. Pseudoknot prediction was performed as published (Smola et al. 2016; Wan et al. 2022), but predictions were not incorporated into the structure models reported herein due to lack of evidence for pseudoknot formation in SChLAP1 in our downstream in cellulo analysis (see Supplemental Text 1; Supplemental Fig. S6). The DMS data showed good agreement with the in vitro SHAPE data (Supplemental Fig. S4A) and resulted in greater modification of adenosines and cytidines over guanosines and uridines as expected (Supplemental Fig. S4B). We also observed agreement for several local structures between our SHAPE-informed partition functions and ScanFold models (Supplemental Fig. S5A). These include the aforementioned AU-rich helix, the 3WJ and adjacent stem–loop, and the E2–E5 junction. The agreement between these models gives independent support for the formation of these various substructures in in vitro SChLAP1 as predicted by ScanFold 2.
Ex cellulo SHAPE probing of SChLAP1 reveals cell-derived RNA structures
As our in vitro chemical probing data supported the presence of functionally important structures within the SChLAP1 RNA, we next set out to generate a secondary structure model for cell-derived SChLAP1 RNA to identify whether these structures or others fold in a physiologically relevant context. We performed SHAPE probing of endogenous SChLAP1 isolated from LNCaP prostate cancer cells, a common model cell line with high SChLAP1 expression as compared to normal prostate cells (Prensner et al. 2013) and with a known metastatic phenotype. Due to the retroviral insertion in exon 7, which overlapped completely with amplicon 4 used in our in vitro probing, we extended the coordinates of amplicon 4 from what was used in our in vitro experiments to avoid amplification of other THE1B-containing transcripts (see Materials and Methods).
We began our in-cell structure modeling with RNA that was gently isolated from LNCaP cells and Proteinase K treated (i.e., ex cellulo RNA) using previously established protocols to extract cellular RNA without heat-denaturing (Smola et al. 2015a, 2016). Two independent replicates of ex cellulo probing of SChLAP1 yielded reactivity profiles with good agreement (Pearson's R = 0.72). The resultant secondary structure arc diagrams (Fig. 3A; Supplemental Fig. S5B,C) and MFE model (Fig. 4, see below) revealed a complex structure for cell-derived SChLAP1, with an array of predicted structures across the length of the transcript. We also observed agreement among several structures identified in our ex cellulo SHAPE data, in vitro SHAPE data, and ScanFold data (Supplemental Fig. S5), including the E2–E5 junction, AU-rich helix, and 3WJ, giving independent support for the formation of these structures and their ability to form in cells.
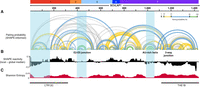
SChLAP1 secondary structure generated through ex cellulo SHAPE-MaP from LNCaP cells (representative of two independent replicates). (A) Arc diagram showing the SHAPE-informed base-pair predictions across ex cellulo SChLAP1. Arc diagram of second replicate shown in Supplemental Figure S5C. (B) Median SHAPE reactivity of 51 nt windows across the length of SChLAP1 subtracted from the global median (SHAPE = 0.31). (C) Shannon entropy plot across SChLAP1. Blue boxes denote low SHAPE/Shannon regions that were reproducible across both biological replicates. Figure generated in Integrative Genomics Viewer (Robinson et al. 2011).
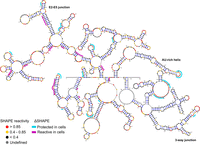
ΔSHAPE analysis of SChLAP1. Significant in-cell protected or enhanced regions identified in both replicates of ΔSHAPE (see Materials and Methods) are mapped over a representative MFE structure of ex cellulo SChLAP1. SChLAP1 structure visualized in VARNA (Darty et al. 2009).
We further analyzed our ex cellulo SHAPE data to identify putative functional structures within cell-derived SChLAP1. Work by Siegfried et al. characterizing HIV-1 genomic RNA found that RNA structural elements classified as (1) highly structured (i.e., low SHAPE reactivity) and (2) well-determined (i.e., low Shannon entropy), which are referred to as low SHAPE/Shannon (lowSS) regions, were significantly enriched in previously unknown functional roles (Siegfried et al. 2014). This metric has since been used to identify novel functional regions, including in the Dengue virus RNA genome (Dethoff et al. 2018), XIST lncRNA (Smola et al. 2016), and HCV genome (Wan et al. 2022). To identify if SChLAP1 contained lowSS regions, we calculated the SHAPE reactivity (51 nt local median compared to global median, Fig. 3B) and Shannon entropy (51 nt windows, Fig. 3C) to identify lowSS sites. In our SChLAP1 model, we identified three lowSS regions: nucleotides 1–165 (within LTR12C insertion), nucleotides 398–478 (E2–E5 junction), and nucleotides 989–1056 (AU-rich helix) (Fig. 3, blue bars). These lowSS regions agree well with ScanFold-predicted structures (Fig. 2).
Additionally, we observed that the nucleotides between the above-mentioned lowSS regions (i.e., nucleotides 166–397, which contains portions of exon 1 and 2, and nucleotides 479–988, which contains portions of exons 5 and 7 and the entirety of exon 6) display both elevated SHAPE reactivities and Shannon entropies relative to the median (Fig. 3B,C). This result indicated that these regions are generally single-stranded and/or conformationally heterogenous. Consistent with these results, the arc diagrams of the two ex cellulo probing replicates vary considerably in these regions (Supplemental Fig. S5C). In contrast, downstream from the lowSS site located at nucleotides 989–1056 (i.e., nucleotides 1057–1436), we observe low SHAPE reactivity alongside high Shannon entropy (Fig. 3B,C), indicating a highly structured but poorly predicted and/or conformationally heterogenous structure. This highly structured region correlates well to the THE1B insertion within SChLAP1 (nucleotides 1123–1436).
We next compared the consistency of our in vitro and ex cellulo SHAPE profiles using Pearson correlation coefficients. We calculated the correlations using 51 nt sliding windows for both replicates of our ex cellulo SChLAP1 against our in vitro SHAPE data. We observed regions of high correlation between our ex cellulo and in vitro data alongside regions of low/modest correlation (Supplemental Fig. S7). In particular, SChLAP1 nucleotides 1–204, 318–477, and 960–1105 were the largest regions with high correlation between our in vitro and ex cellulo data (defined as having Pearson R ≥ 0.5 in both replicates, a threshold chosen heuristically based on previous comparisons of in vitro and in/ex vivo chemical probing studies [Sherpa et al. 2018; Frank et al. 2020; Manfredonia et al. 2020]). Thus, these regions are more likely to recapitulate a similar structure in vitro and ex cellulo. These regions also align with the aforementioned lowSS regions in our ex cellulo data (Fig. 3). We also identified smaller regions that show correlation between the in vitro and ex cellulo models, particularly within nucleotides 803–857, which corresponds to a predicted stem and 5′-end portion of a large, single-stranded loop in our in vitro (Supplemental Fig. S4A) and ex cellulo (Fig. 4) MFE models.
Identification of protein binding regions via in cellulo SHAPE
SChLAP1 has been documented to interact with several proteins (see Introduction). As our in vitro and ex cellulo work identified potentially functional secondary structures within SChLAP1 (in particular, ScanFold and lowSS regions) as well as single-stranded regions that could additionally function in protein binding, we next performed in cellulo SHAPE probing to identify whether these structures persist in cells and/or function as putative protein binding regions that may be involved in any of the aforementioned interactions. For consistency with the ex cellulo experiments, in cellulo SHAPE probing was performed in the LNCaP cell line. The resultant SHAPE reactivity profiles between two independent replicates showed good agreement (Pearson's R = 0.59). For reference, replicate in cellulo SHAPE probing experiments of endogenously expressed Xist lncRNA yielded a Spearman correlation coefficient of 0.50 (Smola et al. 2016). We then used the ΔSHAPE algorithm to identify protein binding regions/structures of SChLAP1 by comparing our in cellulo reactivity data and ex cellulo data, as the ΔSHAPE algorithm has previously identified protein binding sites in other lncRNAs and viral RNAs (Smola et al. 2016; Frank et al. 2020; Jones et al. 2020; Schmidt et al. 2020; Przanowska et al. 2022; Wan et al. 2022).
The results of two replicates of ΔSHAPE analysis are shown on a representative MFE structure from our ex cellulo probing (Fig. 4); each replicate (see Materials and Methods) is individually shown in Supplemental Figure S8. Across both replicates of ΔSHAPE analysis, we observed indications for protein binding (in-cell protections) in both structured regions and relatively unstructured regions as previously identified in our ex cellulo analysis. For example, the three lowSS regions in our ex cellulo model, that is, the beginning of exon 1/LTR12C insertion, the E2–E5 junction, and the AU-rich helix, each contain in cellulo protected nucleotides, indicating that these structures likely participate in intermolecular interactions and suggesting a role for these highly predicted RNA structures in protein binding. Additionally, we observed significant in-cell protections within the remainder of exon 5, which was found to be relatively high in SHAPE reactivity and Shannon entropy and suggestive of an unstructured, single-stranded region (Fig. 3). These data suggested that this region functions as a single-stranded “landing pad” for protein binding, with similar regions observed in other RNAs such as Xist (Smola et al. 2016; Weeks 2021). Lastly, we observed significant in-cell protections in the low SHAPE, high Shannon 3′-end of SChLAP1 (within THE1B insertion), indicating that this region plays important roles for protein binding. In particular, these protections were observed in the aforementioned 3WJ (supported by ScanFold [Fig. 2] as well as our in vitro/ex cellulo predicted base pairs [Fig. 3; Supplemental Fig. S5]) and a CU-rich single-stranded region (nucleotides 1313–1335, observed in our in vitro/ex cellulo SHAPE-informed MFE models [Fig. 4; Supplemental Fig. S4A]). As this region corresponds to the THE1B LTR insertion (Fig. 1C; Supplemental Fig. S1), these results suggested that the formation of this SChLAP1:protein recognition interface occurred de novo through a retroviral insertion within primate evolution.
Several putative protein binding regions identified herein are consistent with previous work from other groups, supporting the validity of our ΔSHAPE data. For example, in-cell protections observed in exon 2 are consistent with recent work from Ji et al., where binding between SChLAP1 exon 2 and HNRNPL facilitated activation of the NF-κB pathway in glioblastoma (Ji et al. 2019). In separate work, HNRNPL was found to promote prostate cancer cell growth, and knockdown of HNRNPL significantly diminished LNCaP cell growth but not RWPE-1 cell growth, indicating cancer-specific functions for HNRNPL (Fei et al. 2017). While exon 2 lacks the full poly(CA) consensus sequence found for HNRNPL via RIP-seq (Fei et al. 2017), a CA-rich region (nucleotides 341–349) overlaps with an in-cell protected region in our ΔSHAPE data (nucleotides 347–349) and may support weak or indirect interaction with HNRNPL. In addition, protein binding with exon 7 is in line with previous work from the Chinnaiyan group. Preliminary work from Sahu revealed that a deletion of 250 nt (from position 1001–1250, termed the Deletion 5 region) of SChLAP1 Iso. 1 inhibited SChLAP1-driven invasion and binding to the SWI/SNF complex (Sahu 2015). These coordinates overlap with two regions of in-cell protection, the former within the AU-rich helix and the latter within the predicted 3WJ in the THE1B insertion. Both sites are also contained within favorable ScanFold-predicted structures (Fig. 2). While interaction with the SWI/SNF complex is contested (Raab et al. 2019), the role of this particular region in protein recognition is supported by our work.
Analysis of unfolded regions in cellular SChLAP1 compared to ex cellulo
Alongside the above in-cell protections, we also observed regions of in-cell enhancement of reactivity (i.e., nucleotides more reactive in cellulo as compared to ex cellullo data) by ΔSHAPE, indicating the unfolding of some structures in cells as compared to the ex cellulo model. In particular, in-cell enhancements appeared to be enriched at the 5′-end of the transcript and more limited in the remaining sequence (Fig. 4; Supplemental Fig. S8B). Within the first 500 nt of SChLAP1 (i.e., the first 34.8% of sequence), 76 of 130 (58.5%) and 82 of 120 (68.3%) instances of in-cell enhancement are observed in replicates 1 and 2 of ΔSHAPE analysis, respectively (Supplemental Fig. S8B). While the ΔSHAPE algorithm emphasizes robust local changes in SHAPE reactivity (Smola et al. 2015a, 2016), we hypothesized that the abundance of in cellulo enhancements called by ΔSHAPE at the 5′-end of SChLAP1 may be reflective of larger scale structural changes. To analyze broader conformational changes between ex cellulo and in cellulo SChLAP1, we calculated the overall SHAPE reactivity change in 51 nt windows between our ex cellulo and in cellulo samples as was used with the Xist lncRNA (Smola et al. 2016). Several regions of significant SHAPE reactivity change were identified (Supplemental Fig. S8C). Of particular note, we observed significant enhancement of SHAPE reactivity of exon 1 in cells, which was consistent with the multiple ΔSHAPE-identified in cellulo reactivity enhancements we observed (Fig. 4; Supplemental Fig. S8B). These results suggested a broad structural unfolding of this region in cells, in contrast to the significant indications for structuredness of this region in vitro and in silico, including the ScanFold predictions (Fig. 2, top; Supplemental Fig. S3), high GC content (Fig. 2, bottom), in vitro probing data (Supplemental Figs. S4A, S5A), and ex cellulo probing data (Figs. 3, 4), where significant structure was indicated. Additionally, we identified several in-cell protections by ΔSHAPE in this region (Fig. 4; Supplemental Fig. S8B), indicating that local sites of in cellulo protection occur and suggesting participation in intermolecular interactions.
Similar to exon 1, we observed that the E2–E5 junction showed enhancement of SHAPE reactivity in cellulo by ΔSHAPE (Fig. 4; Supplemental Fig. S8B). However, our ΔSHAPE data indicated that the majority of in-cell enhancements in this region are located on the 5′-end of the E2–E5 junction. Despite these in-cell enhancements, the structure of the E2–E5 junction is still strongly predicted in the arc diagram for our in-cell data (Supplemental Figs. S8A, S9A). We examined the SHAPE reactivities of the largest strands in this structure (nucleotides 398–412 and 464–478, the former containing multiple in-cell enhancements) and observed statistically significant enhancement of SHAPE reactivity in cellulo compared to ex cellulo for the 5′-strand, but not the 3′-strand in this region (Supplemental Fig. S9B). In addition, we observed ΔSHAPE in cellulo protections in a small stem–loop in the E2–E5 junction (nucleotides 449–461, Fig. 4), suggesting that protein binding occurs within this structure despite the presence of in cellulo enhancements elsewhere. From these data, we hypothesize that protein binding within the E2–E5 junction occurs primarily on the 3′-portion of the structure but not the 5′-portion. As a result, the 5′-stem of the structure, while putatively base-paired to the 3′-stem in vitro and ex cellulo, is more accessible to chemical modification in cellulo. We note that this proposed disruption would be distinct from the broader unfolding observed for exon 1/LTR12C insertion.
While the 5′-end of SChLAP1 appears to be generally unfolded in cells, we observed a few ΔSHAPE in cellulo enhancements at the 3′-end of SChLAP1 (Fig. 4; Supplemental Fig. S8B). This result is supported by the presence of highly predicted base pairs at the 3′-end rather than the 5′-end of SChLAP1 in cellulo (Supplemental Fig. S8A). Thus, we believe that most of the structures at the 3′-end of SChLAP1, such as the AU-rich helix and 3WJ, remain folded in cells, allowing these RNA structures to function within cells as well-folded protein binding substructures.
In vitro folding analysis of SChLAP1 3′-end reveals conformational heterogeneity in the THE1B LTR insertion
As our above work characterized SChLAP1 secondary structures and identified protein binding interfaces, we next set out to evaluate if any of these recognition elements participated in tertiary/higher order structural complexity. We specifically focused on the 3′-end of SChLAP1 for several reasons. First, this region showed generally low SHAPE reactivity yet high Shannon entropy. While the low SHAPE reactivity indicated that this region is structured, the high Shannon entropy suggested the presence of several possible conformations with unique SHAPE reactivities, which may or may not dynamically interconvert. The correlation coefficients comparing our ex cellulo and in vitro SHAPE profiles varied more between replicates at the 3′-end of SChLAP1 than at the 5′-end (Supplemental Fig. S7), suggesting structural variability between experiments in this region. Second, evidence of retroviral insertion (e.g., of THE1B) in this region indicated that the local RNA structures may have emerged from an external source; indeed, recent evidence points to the role of TEs in forming de novo RNA structural domains. In particular, Feschotte and coworkers compared the predicted structures of 100 lncRNAs with high TE content (over 96% of sequence) to 100 low-TE content lncRNAs (<3% of sequence) and observed a greater propensity for statistically significant secondary structures in high-TE lncRNA as evaluated by a sequence randomization approach similar to ScanFold (Kapusta et al. 2013). While THE1B insertions have been previously analyzed for their roles as gene promoters and enhancers for both coding and noncoding genes (Lamprecht et al. 2010; Young et al. 2013; Dunn-Fletcher et al. 2018), to our knowledge they have not been analyzed in the context of modifying RNA structure. Thus, this evidence for a structured RNA domain corresponding to the THE1B insertion, along with evidence that the THE1B insertion remains folded in cells while the LTR12C insertion is unfolded in cells, led us to hypothesize that this insertion could have resulted in the formation of a complex structural landscape leading to functional protein binding capability.
To assess the folding landscape of the 3′-end of SChLAP1, specifically within exon 7 and the THE1B insertion, we used native gel electrophoresis. This method was chosen due to its flexibility to accommodate RNA of various sizes and ability to assess varying conditions (e.g., salt identity and concentration) in an efficient manner (Woodson and Koculi 2009). Using our ex cellulo model along with additional structure predictions in RNAstructure (Bellaousov et al. 2013) as guidance for substructures to study, two strongly predicted structures from the 3′-end of SChLAP1 were chosen for analysis by native gel electrophoresis: Arm A (nucleotides 949–1116), which contains the above-mentioned lowSS AU-rich helix, and Arm B (nucleotides 1117–1428), which contains the 3WJ and corresponds to the THE1B insertion (Supplemental Fig. S10A).
We began by looking at two variables, magnesium (Mg2+) concentration and annealing method, and their impact on Arm A/B migration by gel electrophoresis. Mg2+ is a divalent cation known to be crucial for the stabilization of RNA tertiary structures (Butcher and Pyle 2011), whereas the method of RNA annealing, specifically whether the RNA is snap-cooled or slow-cooled, may modify the resultant conformational landscape of the RNA population (Somarowthu et al. 2015). In our initial examination of these variables, wherein Arm A/B were snap- or slow-cooled in filtration buffer and thereafter incubated with varying Mg2+ concentrations (0, 2.5, 5, 7.5, and 10 mM Mg2+; protocol designed for consistency with our chemical probing above), Arm A migrated at a consistent distance and as one conformer via native gel regardless of either variable (Fig. 5, top). This result indicated that neither the annealing protocol nor the Mg2+ concentration significantly impacts the resultant structure of Arm A. We note that this finding does not rule out more subtle conformational changes that may occur within Arm A. In contrast, for Arm B we observed an unexpected trend between Mg2+ concentration and annealing protocol (Fig. 5, bottom). When Arm B is snap-cooled, Mg2+ addition significantly alters the conformational space of Arm B, favoring the formation of two central conformations over a lower and higher conformation observed at low magnesium concentrations (e.g., 0 and 2.5 mM Mg2+). However, when Arm B is slow-cooled, this Mg2+ dependence is greatly reduced, and Arm B migrates in one major conformer throughout the magnesium titration. We note that slow-cooling of Arm B results in a minor population of more slowly migrating (higher molecular weight) band that is not observed in snap cooling, which we attribute to dimerization.
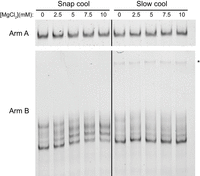
Native gel electrophoresis of Arm A and Arm B with varying annealing protocols and magnesium concentrations. RNA was snap- or slow-cooled in filtration buffer (50 mM K-HEPES pH 7.5, 150 mM KCl, 0.1 mM EDTA) before incubation with the given Mg2+ concentration. Asterisk denotes putative Arm B dimer favored in slow cooling. RNA was purified using the “kit-purified” approach. Arm A gel is representative of two biological replicates, and Arm B gel is representative of three biological replicates.
Next, we evaluated how snap- and slow-cooling impact the migration of Arm B when incubated with divalent cations besides Mg2+. We evaluated the migration of Arm B in response to 5 mM Ba2+, Sr2+, Ca2+, Mn2+, or Ni2+ (all as metal chlorides). We chose these divalent metals as their roles in RNA folding and stability have been assessed in previous studies, particularly for RNA G-quadruplexes and the Tetrahymena ribozyme, and they cover an array of chemical properties including radius, charge density, and hydration enthalpy (Koculi et al. 2007; Balaratnam and Basu 2015). As above, Arm B was snap- or slow-cooled in filtration buffer before incubation with the indicated divalent metal. For snap-cooled Arm B, we found that some metals, such as Ba2+ and Sr2+, resulted in Arm B migrating primarily in the lowest conformer (i.e., fastest moving band), previously observed with 0 mM Mg2+. However, when incubated with other metals, such as Mn2+ and Ni2+, the additional, higher apparent conformations of Arm B are preferred (Fig. 6A). Again, this trend was not observed for slow-cooled Arm B (Fig. 6B), where the lowest conformer is observed regardless of the identity of the divalent metal.
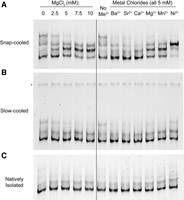
Native gel electrophoresis of Arm B with various divalent metals and annealing conditions. Arm B was prepared by snap-cooling (A), slow cooling (B), or native isolation (C) in filtration buffer (see Materials and Methods) before incubation with divalent metals. Asterisk denotes dimer favored during slow cooling. Black line through gels is for reference only; magnesium titration and incubation for other divalent metals was run on the same gel for each panel. RNA was generated using FPLC purification, and each gel was run in biological duplicate (kit-purified of snap- and slow-cooled Arm B run in triplicate, Supplemental Fig. S10B).
Given that changes in Arm B migration in the presence of divalent metal were dependent on snap- or slow-cooling, we next compared natively purified Arm B, where the cotranscriptionally folded structure is preserved. We isolated Arm B using the same native purification approach that we used for full-length SChLAP1 and thereafter incubated the RNA with the aforementioned divalent metals. We observed that the metals did not induce a significant change in migration for natively folded Arm B (Fig. 6C), that is, Arm B migrated as one major conformer regardless of the identity of the divalent metal. We additionally confirmed that the differences inherent to the native purification workflow did not impact the resultant RNA conformational landscape by snap- and slow-cooling Arm B that had previously been natively purified. The same trends were observed for these samples by native gel: snap-cooling Arm B that was previously natively purified resulted in the above-mentioned metal-dependence that was not observed if natively purified Arm B was slow-cooled (Fig. 6; Supplemental Fig. S10B).
Together, our native gel data suggested that metal recognition by Arm B is significantly altered by annealing method, wherein snap-cooled Arm B showed altered migration by divalent metals depending on their identity, but slow-cooled and natively folded Arm B showed largely consistent migration regardless of divalent metal. These results indicated that (1) a structural difference within Arm B occurs between snap- and slow-cooling, (2) slow-cooling rather than snap-cooling much more effectively mimics the native fold of Arm B, and (3) divalent metals alter the conformational landscape of a nonnative Arm B fold. These data give support for multiple discrete conformations within this region of SChLAP1 in vitro, which may in turn explain the elevated Shannon entropy observed in our ex cellulo SHAPE data (Fig 3C). As stated above, this complex structure additionally appears to function as a protein binding region.
THE1B insertion within SChLAP1 may form a G-quadruplex, but is not sufficient to explain its conformational heterogeneity in vitro
Mg2+ is generally thought to favor RNA compaction, but in our experiments, an increase in apparent size is observed with increasing Mg2+. The order of divalent cation identity in increasing the apparent size of snap-cooled Arm B is reminiscent of recent work of divalent metal recognition of G-quadruplexes, where metals such as Ni2+ induced an unfolded conformation of a G-quadruplex at lower concentrations over other metals such as Ba2+ (Balaratnam and Basu 2015). To evaluate potential G-quadruplex formation, we snap- and slow-cooled Arm B in a modified filtration buffer wherein the concentration of the G-quadruplex stabilizing cation K+ (in the form of KCl) was varied from 0 to 150 mM prior to separation by native gel. We observed a significant change in migration for both annealing conditions with increasing K+, indicating the presence of a K+-dependent structure regardless of annealing protocol (Fig. 7A). As a control, we studied the impact of K+ on Arm A migration, and we observed no change in migration in response to K+ for Arm A (Supplemental Fig. S11A). This result suggested that a G-quadruplex forms within Arm B in both annealing protocols and that G-quadruplex formation may be a component of the structural landscape in Arm B/THE1B.
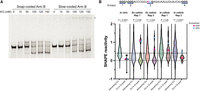
Analysis of G-quadruplex formation of Arm B by native gel electrophoresis and SHAPE. (A) Native gel electrophoresis of kit-purified Arm B in response to varying KCl concentrations and annealing conditions. Gel is representative of two biological replicates. (B, top) Sequence of predicted G-quadruplex in Arm B by QGRS Mapper (Kikin et al. 2006). G-tracts are numbered, and guanosines predicted to participate in G-quadruplex are in bold. (Bottom) Violin plots comparing the reactivities of guanosines in predicted G-quadruplex to the remaining guanosines in each SHAPE probing experiment reported herein. Reactivities below −1 or above 2 were not plotted here but were included in statistics. A line at SHAPE = 0.4 is shown for reference as SHAPE reactivities above this value are unfavorable for base-pairing (Hajdin et al. 2013). Significance was calculated using a Kolmogorov–Smirnov test for each experiment. Nucleotides 1208 and 1209 are indicated by color coding.
To further investigate potential G-quadruplex formation, we used QGRS Mapper (Kikin et al. 2006) against the SChLAP1 Iso. 1 sequence to search for potential G-quadruplex forming regions. Searching with the default parameters, which allows G-quadruplex formation within a 30 nt window, we identified four lowly predicted potential G-quadruplex forming regions (Supplemental Fig. S11B, left). However, extending the maximum allowed G-quadruplex to 45 nt facilitated the prediction of a three-tract G-quadruplex (tract referring to the number of guanosines in a row per strand of the putative G-quadruplex) located within Arm B (nucleotides 1194–1228) (Supplemental Fig. S11B, right). This predicted G-quadruplex was the only predicted G-quadruplex with three G-tracts, which we hypothesized could confer added stability to this fold compared to the other predicted G-quadruplexes in SChLAP1, which only contained two G-tracts. In addition, this predicted G-quadruplex would have two large loops, one of which (nucleotides 1211–1225) was predicted by RNAstructure (Bellaousov et al. 2013) to form a stem–loop structure itself (Supplemental Fig. S11C).
This computational result supports our K+-dependent native gel studies, where evidence of G-quadruplex formation was observed in Arm B (and thus the THE1B insertion). However, we note that this G-quadruplex overlaps with the coordinates of the ScanFold/SHAPE-informed 3WJ (nucleotides 1141–1213) and adjacent stem–loop (nucleotides 1224–1242), indicating that a nonquadruplex conformation is also thermodynamically predicted.
Analysis of SHAPE data indicates a structured but nonquadruplex conformation of Arm B/THE1B insertion in cell-derived SChLAP1
Given the above indication of a G-quadruplex structure in Arm B of SChLAP1 in vitro, and its overlap with favorably predicted nonquadruplex secondary structures, we evaluated our in vitro and in/ex cellulo SHAPE data for evidence of G-quadruplex formation. Recent work from Schneekloth and coworkers using the probe 2-methylnicotinic acid imidazolide found that guanosines participating in a G-quadruplex within the NRAS mRNA 5′ UTR were generally low in SHAPE reactivity in vitro, supporting their structuredness (Balaratnam et al. 2023). We analyzed the SHAPE reactivity of the predicted G-quadruplex within Arm B identified above (nucleotides 1194–1228) to evaluate its structuredness and indications of quadruplex formation. In four of our five probing experiments, we observe a statistically significant decrease in SHAPE reactivity of the guanosines participating in the putative G-quadruplex compared to the SHAPE reactivity of all remaining guanosines (Fig. 7B), suggesting that the guanosines in this potential G-quadruplex are indeed functioning in an RNA structure that hinders SHAPE reactivity. While statistical significance was not obtained for in-cell replicate 1, the data trends in the same direction and may be consistent with heterogeneity of this structure in in cellulo RNA as indicated above. However, we observed that two residues in this predicted G-quadruplex (nucleotides 1208 and 1209, within G-tract 3) showed a large enhancement in SHAPE reactivity in our ex cellulo data as compared to our in vitro data (Fig. 7B). While our in vitro data showed low SHAPE reactivity in each G-tract, consistent with our K+-dependent native gels for Arm B that indicated G-quadruplex formation (Fig. 7A), the heightened SHAPE reactivity in our ex cellulo data for G-tract 3 in cell-derived SChLAP1 suggested nonquadruplex structure. This trend is also observed in the in cellulo data, although with greater variation between the replicates (Fig. 7B).
A nonquadruplex, 3WJ structure for this region is supported by our representative ex cellulo MFE structure (Fig. 4), which is in line with our ScanFold predictions (Fig. 2). In this model, the above-mentioned nucleotides 1208 and 1209 are base-paired across a 1 nt bulge, which may introduce more flexibility in these nucleotides despite their base-pairing and thus yield heightened SHAPE reactivity for these nucleotides in cell-derived RNA. Thus, while the data suggested that Arm B of SChLAP1, which encompasses the THE1B insertion, has a propensity to form G-quadruplexes, especially in vitro, this conformation appears less likely to form in cell-derived SChLAP1. Nonetheless, the combined data supports the SHAPE reactivity predictions of a structured region in the 3′-end of SChLAP1 with multiple discrete, potentially interconverting, structures.
Identification of protein binding partners for structured regions of SChLAP1
Based on our structural modeling and ΔSHAPE data, we selected four substructures of SChLAP1 for biotin pulldowns followed by mass spectrometry protein identification: the E2–E5 junction, the AU-rich helix, the 3WJ, and the CU-strand. As described above, the E2–E5 junction and the AU-rich helix were lowSS regions in our ex cellulo structure model (Fig. 3). While well-folded ex cellulo, the E2–E5 junction showed indications of in cellulo unfolding (Fig. 4; Supplemental Fig. S9), which we hypothesized could be due to protein-induced structural changes. The AU-rich helix (within Arm A) appeared to remain well-folded in cellulo as evidenced by a lack of ΔSHAPE in-cell enhancements, suggestive of a structurally stable site of RNA:protein interaction. The 3WJ (within Arm B) showed structural complexity/heterogeneity in our native gel work. While we attribute some of this architecture to G-quadruplex formation in vitro, comparison to our SHAPE data suggested that a nonquadruplex conformation was more likely for this region in cells (Fig. 7). Lastly, the CU-strand (within Arm B) is high in SHAPE reactivity in both our in vitro and ex cellulo models (Fig. 4; Supplemental Fig. S4A), indicating that it is likely single-stranded in a variety of conditions. The MFE structures of all RNA constructs used (in the absence of any SHAPE data) are shown in Supplemental Figure S12 and are largely consistent with the structures observed in our experimentally informed structural modeling of SChLAP1.
Protein pulldowns were performed for the above four constructs, which were ordered as biotinylated RNA oligonucleotides from IDT. The immobilized constructs were incubated with nuclear lysate derived from the LNCaP cell line. Silver staining of pulldown samples showed successful isolation of proteins by all constructs in comparison to a beads-only control (Fig. 8A). We submitted the eluates of the four RNA pulldown samples for analysis via qualitative proteomics. Approximately 5000 proteins were identified across all constructs in our experiment (Supplemental Data 3). We selected the 100 most abundant proteins across all four pulldowns for future analysis, which together constituted ∼70% of the signal intensity (Supplemental Fig. S13A). Gene ontology analysis revealed enrichment for functions related to RNA binding (Supplemental Fig. S13B), as expected. While we note that analysis of the highest signal proteins, particularly in a qualitative mass spectrometry experiment, may bias toward abundant proteins or limit contribution of transient interactions, we expected that this list would give a useful starting point for identifying previously undescribed SChLAP1:protein interactions with potential importance in prostate cancer.
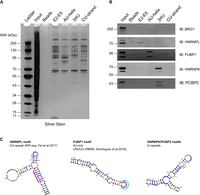
Identification of SChLAP1 substructure binding proteins. (A) Silver stain of pulldown eluates. Gel is representative of two independent experiments. (B) Western blot for BRG1, HNRNPL, FUBP1, HNRNPK, and PCBP2 in pulldown samples. Western blots are representative of two independent experiments. (C) Comparison of previously identified binding motifs to ΔSHAPE sites identified in our work. Structures of E2–E5 junction, AU-rich helix, and 3WJ with ΔSHAPE sites indicated are reprinted from Figure 4. Purple highlights represent motifs for HNRNPL, FUBP1, or HNRNPK/PCBP2.
To identify putative structure-specific protein interactions for follow up validation by western blot (see Materials and Methods), we first normalized the abundance for a particular protein in each of the four pulldowns to a scale of 0–1 across the pulldowns. We heuristically defined putative structure-specific protein interactions as proteins with this normalized score ≤0.3 compared to the maximum pulldown (set to 1); that is, for a given protein across the four pulldowns, the three nonmaximum pulldowns had to have abundance values <30% of the maximum pulldown for a protein to be considered potentially SChLAP1 substructure-specific. Multiple proteins showed similar protein counts across multiple constructs (see Supplemental Fig. S13C for examples), which we attribute to nonspecific RNA:protein interactions. Out of the 100 top proteins, only 17 passed our selection criteria, having normalized scores for all three nonmaximum pulldowns of <0.3 (Supplemental Fig. S13C). We focused on proteins isolated by the E2–E5 junction, AU-rich helix, or 3WJ given the single-stranded nature of the CU-strand. The list of candidate proteins is shown in Supplemental Figure S13C, from which antibodies were selected.
Based on our selection criteria, the following proteins were evaluated for their presence in protein pulldown eluates by western blot: HNRNPL (most abundant for the E2–E5 junction), far upstream element binding protein 1 (FUBP1, most abundant for AU-rich helix), heterogeneous nuclear ribonucleoprotein K (HNRNPK, most abundant for 3WJ), and poly(rC) binding protein 2 (PCBP2, most abundant for 3WJ). In addition, we evaluated the binding of BRG1 to each of these constructs given the previous work on SChLAP1:SWI/SNF interactions (see Introduction).
Western blot and mass spectrometry analyses produced concordant findings. By western blot, HNRNPL was only observed to bind the E2–E5 pulldown sample (see Supplemental Text 2). Similarly, FUBP1 was only observed in the AU-helix pulldown, and HNRNPK and PCBP2 were only observed for the 3WJ pulldown (Fig. 8B). We additionally inspected each substructure for overlap with previously identified consensus sequences for these RNA-binding proteins (RBPs) (Fig. 8C). A CA-repeat within the E2–E5 junction overlaps with the ΔSHAPE site identified in our work (see Supplemental Text 2). While FUBP1 is generally considered to bind AU-rich sequences (Debaize and Troadec 2019), previous RNA Bind-n-Seq studies identified a more specific UNUUU motif for FUBP1:RNA interactions (Dominguez et al. 2018). Accordingly, we observed two concatenated UNUUU motifs overlapping the ΔSHAPE we identified in the AU-rich helix. Lastly, HNRNPK and PCBP2 are both polyC binding proteins (Makeyev and Liebhaber 2002). Five tracts containing three or more cytosines are observed in the 3WJ (Fig. 8C). In addition, analysis of RNA Bind-n-Seq as well as eCLIP data has suggested that HNRNPK preferentially binds RNA in secondary structure contexts (Dominguez et al. 2018; Lubelsky and Ulitsky 2018), which is in line with our findings of HNRNPK binding to the 3WJ. Of particular note, each of these proteins have themselves been implicated in prostate cancer progression (see Discussion), suggesting that some of their activity may come in part through their interaction with SChLAP1.
BRG1, while observed in the input sample (Fig. 8B), was not observed by western blot in any pulldown sample. Based on these data, we do not rule out BRG1 binding to these substructures in vivo. However, we believe that HNRNPL, FUBP1, HNRNPK, and PCBP2 constitute a set of preferred, selective protein interactors for these SChLAP1 substructures in vitro.
DISCUSSION
The study of lncRNA structure–function relationships is of great interest to the scientific community from both a basic science perspective as well as therapeutic one. While three-dimensional analysis of lncRNA structure by methods such as X-ray diffraction (XRD), nuclear magnetic resonance (NMR), and cryo-electron microscopy (cryo-EM) are limited, in large part due to lncRNA size and conformational dynamics, chemical probing methods such as SHAPE-MaP combined with phylogenetic analyses have provided insight into these large biomolecules, exemplified by XIST (Lu et al. 2016; Smola et al. 2016; Jones and Sattler 2019). Importantly, these chemical probing methods have often informed and/or reproduced three-dimensional structure findings and have even expanded upon them as seen in rRNA (Mustoe et al. 2019) and Dengue virus genomic RNA (Dethoff et al. 2018).
The analyses presented herein have produced the first targeted secondary structure model of the lncRNA SChLAP1, which serves as a foundation for further biochemical and biophysical analyses. Our phylogenetic work suggested that SChLAP1 is a primate-conserved lncRNA. In addition, RepeatMasker analysis revealed the insertion of two LTRs within SChLAP1 (Fig. 1C; Supplemental Fig. S1): LTR12C and THE1B. While outside the scope of this work, we hypothesize that reactivation of a retroviral promoter, derived from LTR12C, may be responsible for SChLAP1 overexpression in prostate cancer. Consistent with this idea, recent work from Feng and coworkers uncovered reduced methylation of the SChLAP1 promoter in castration-resistant prostate cancer samples over benign prostate samples (Zhao et al. 2020).
Examining SChLAP1 in cellulo revealed significant disruption of structures at the 5′-end of the transcript relative to other data, particularly within the LTR12C insertion (Supplemental Fig. S8C). This result indicated that these regions are unfolded in the cellular environment despite having significant ability to form RNA structures as indicated by ScanFold (Fig. 2) and in vitro/ex cellulo probing (Figs. 3, 4; Supplemental Fig. S4), which is supported by work from Rouskin and coworkers that reported active unfolding of RNA structures in vivo (Rouskin et al. 2013). As ΔSHAPE simultaneously identified in-cell protections at the 5′-end, it is likely that regional intermolecular contacts (e.g., RNA–protein interactions) co-occur with this observed unfolding. Whether this unfolded conformation of the LTR12C insertion relates to SChLAP1's ability to participate in intermolecular interactions in cells is worthy of further investigation. In contrast, while we observe disruption of the E2–E5 junction in cells (Supplemental Fig. S9), we hypothesized that this is the result of protein binding occurring primarily on the E2–E5 3′-end, thereby freeing the E2–E5 5′-end for SHAPE modification. Our proteomics studies identified HNRNPL as a E2–E5-binding protein. In a recent study, HNRNPL was found to unfold RNA stems and thereby regulate splicing of the MALT1 gene (Jones et al. 2022). We hypothesize that HNRNPL, possibly alongside other coassociated proteins, may be responsible for the unfolding we observe in the E2–E5 junction in cells.
In contrast to the 5′-end, the 3′-end of SChLAP1 appears to remain folded in cells, as evidenced by lack of in-cell enhancements (Fig. 4; Supplemental Fig. S8). Further, this region also showed indications for protein binding by ΔSHAPE and includes a significant portion of the aforementioned 1001–1250 region found critical for SWI/SNF binding (Sahu 2015), indicating that this region may be functionally relevant for prostate cancer progression. Despite these data, which indicated significant structure and function, the 3′-end of SChLAP1 is also high in Shannon entropy and therefore was indicated to contain multiple possible structures (Fig. 3C). To further analyze this conformational heterogeneity, we used native gel electrophoresis to characterize this region, named Arm B, derived from the THE1B insertion. We observed support for multiple structures within Arm B as evidenced by (1) changes in migration in the presence of some divalent metals, but not others, (2) the dependence of annealing protocol for these changes in migration, and (3) the role of potassium in altering Arm B migration. We observed no evidence of these trends in our control structure, Arm A, indicating that these trends are specific to Arm B. This is the first work to our knowledge that has analyzed the RNA conformational landscape of a THE1B insertion, which is notable given that THE1B insertions are common in the human genome at over 18,000 copies (Storer et al. 2021). These results indicated that the insertion of this retroviral domain may have introduced a structured yet conformationally diverse protein binding hub within SChLAP1 that may facilitate a role in promoting aggressive prostate cancer.
Alongside our structural characterization of Arm B, we found evidence of protein binding in this region through pulldowns of two strongly predicted substructures within this domain, the 3WJ and CU-strand, suggesting that the Arm B domain functions at least in part through protein interactions. We expect that future work will determine how the structural dynamics of Arm B impact protein recognition. However, our current data support that this low SHAPE, high Shannon region plays a functional role in SChLAP1. Historically, SHAPE-MaP studies of lncRNAs or viral genomic RNAs often prioritize lowSS regions due to their enrichment in functional roles (Weeks 2021). However, RNAs can vary significantly in their lowSS content (Weeks 2021). For example, the HIV-1 RNA genome and the human U1 snRNA consists of 40% and 78% lowSS nucleotides (see Weeks 2021 for review and other examples), respectively, while the human SLNCR1 lncRNA contain no lowSS regions (Schmidt et al. 2020). In contrast to various efforts to characterize lowSS regions, few studies to our knowledge have specifically examined low SHAPE, high Shannon regions closely. Our work suggested that Arm B, a low SHAPE/high Shannon region, may dynamically interconvert between structures to allow potentially multiple functions within SChLAP1. We hope that our work spurs future efforts to characterize possible functions of low SHAPE, high Shannon RNA structures.
While the landscape within Arm B may be in part due to G-quadruplex formation in vitro, our analysis suggested that other, nonquadruplex containing conformations are accessed preferentially in cell-derived RNA. We expect that higher resolution methods, such as chemical cross-linking or cryo-EM, will better define the contacts within Arm B that determine this conformational landscape. In addition, we expect that further investigation of the Arm B structure, including probing with new methods and reagents in vitro and in cellulo, as well as obtaining 3D structure information, will also give greater insight into the contacts that are changed between its native and nonnative conformations, as was recently used for the Tetrahymena ribozyme (Li et al. 2022).
While several putative protein binding regions identified in this work are in agreement with previous studies, including exon 2 and the Deletion 5-region (Sahu 2015; Ji et al. 2019), our protein binding work provides other candidates for SChLAP1:protein interactions and places them within an experimentally informed structural context. FUBP1, originally documented as a DNA-binding protein and activator of c-Myc expression (Duncan et al. 1994), was recently implicated in prostate cancer progression by Yan and coworkers, where high FUBP1 expression in prostate cancer patients was associated with poor patient outcomes (Yan et al. 2024). Similarly to HNRNPL discussed above, FUBP1 knockdown inhibited the growth of prostate cancer cell lines, but not the RWPE-1 cell line (Yan et al. 2024). In the above-mentioned study that identified HNRNPL activity in prostate cancer (Fei et al. 2017), knockdown of HNRNPK was also found to inhibit cell growth of both prostate cancer and the healthy prostate RWPE-1 cell line (Fei et al. 2017). HNRNPK upregulation in prostate cancer has also been observed in an independent study (Barboro et al. 2009). Lastly, PCBP2 was found to be the target of a natural product to inhibit prostate cancer progression (Huang et al. 2023). We expect that future studies will evaluate the functional role for these SChLAP1:protein interactions in prostate cancer and identify the extent to which the activity of these proteins in promoting prostate cancer is driven by their interactions with SChLAP1.
We also note that our ΔSHAPE and pulldown data suggested that the THE1B retroviral insertion introduced de novo sites of protein interaction within SChLAP1. Indeed, both HNRNPK and PCBP2, which bound the 3WJ within Arm B in our pulldown data, have been found to bind repetitive elements in the human genome. For example, Boyle and coworkers developed a CLIP analysis pipeline that allowed for repetitive element-aware assignment of peaks. Examining ENCODE data, the authors observed significant binding by HNRNPK to LTR elements in K562 and HepG2 cells. Similarly, PCBP2 also showed significant binding to repetitive elements (Boyle et al. 2023). In separate work, the Ulitsky group discovered SINE-derived nuclear RNA localization (SIRLOINs) sequences, which are Alu-derived sequences that promote nuclear localization in an HNRNPK-dependent manner. Examining ENCODE eCLIP data with a computational modeling program, the authors found that HNRNPK eCLIP peaks most often occurred within RNA structural contexts such as multiway junctions (Lubelsky and Ulitsky 2018). This structural analysis is in line with our data wherein HNRNPK is binding to an RNA secondary structure.
In our pulldown experiments, we did not observe significant isolation of SWI/SNF subunit BRG1 by any of our constructs. This finding does not rule out SWI/SNF:SChLAP1 interaction. Indeed, SWI/SNF binding to SChLAP1 in cells by RIP has been observed in two independents studies (Prensner et al. 2013; Raab et al. 2019), and functional roles for RNA:SWI/SNF recognition have been observed in a number of systems, including X-inactivation and nuclear paraspeckle formation among others (Cajigas et al. 2015; Kawaguchi et al. 2015; Wang et al. 2015; Hu et al. 2016; Lino Cardenas et al. 2018; Huang et al. 2019; Jégu et al. 2019; Grossi et al. 2020) despite known promiscuous binding of SWI/SNF across the genome and transcriptome (Cajigas et al. 2015; Raab et al. 2019; Grossi et al. 2020; Skalska et al. 2021). However, our work suggested that the SWI/SNF complex is not the preferred in vitro binding partner of the SChLAP1 substructures evaluated in our study. Future work should evaluate if any sequence or structure preference exists for SWI/SNF binding to RNA (compared to nonspecific binding). Such efforts, along with in-cell cross-linking methods such as eCLIP, will help evaluate if there is a specific SWI/SNF binding motif that occurs within SChLAP1 or the other lncRNAs to which SWI/SNF binds.
Our work suggested avenues of research for RNAs beyond SChLAP1. It is estimated that ∼50% of the human genome consists of transposable elements, with 8% being derived from retroviruses (Lander et al. 2001). However, it is estimated that over 70% of human lncRNAs contain a TE-derived sequence (Kapusta et al. 2013). We hypothesize that Arm B of SChLAP1 may become one of multiple examples of a transposable element resulting in the structural complexity. We believe the variables we tested in our native gel studies, including salt dependence and annealing protocol, will be useful in identifying similar structures within other transposon sequences. It is also interesting that within SChLAP1, LTR12C appears unfolded in cells, while THE1B remains structured, despite being generally similar in their length (322 vs. 314 nt) and GC content (54.7% vs. 46.2%) within SChLAP1. Future efforts should evaluate if similar trends are observed for other transcribed retrotransposons and identify the driving factors of such folding versus unfolding (e.g., helicases, remodeling by nonhelicase proteins, or interactions with other classes of biomolecules). These studies could ultimately facilitate the development of predictive models for the likely in-cell structure for these sequences.
In conclusion, we observed that SChLAP1 has a complex secondary structure, containing a multitude of intramolecular interactions both in vitro and in cellulo, many of which are potentially functional sites of RNA:protein recognition that may facilitate its role in prostate cancer progression. We believe the putative structure–function relationships identified here will facilitate both fundamental understanding of prostate cancer progression and the development of specific therapeutic strategies against SChLAP1 for prostate cancer treatment. In particular, our work identifies single-stranded regions of SChLAP1 that may be amenable to antisense oligonucleotide (ASO)/siRNA-based therapies alongside more structured regions, which we hypothesize may be amenable to small molecule–based therapies (Warner et al. 2018; Costales et al. 2020; Falese et al. 2021). We expect that future work will capitalize on the potential for SChLAP1 as a diagnostic marker and therapeutic target to ultimately yield better patient outcomes for those with aggressive prostate cancer.
MATERIALS AND METHODS
Cell culture
LNCaP cells were obtained from the Duke University Cell Culture Facility and were authenticated with short tandem repeat and mycoplasma testing. Cells were grown in RPMI 1640 media (Gibco) with 10% fetal bovine serum (FBS, Gibco) at 37°C in a humidified atmosphere with 5% CO2. All experiments were performed on cells <20 passages before retrieving a fresh vial from cryopreservation.
Phylogeny analysis
BLAST search (Zhang et al. 2000) was performed using isoform 4 of SChLAP1 as it contains all possible exons of human SChLAP1. The following search paramaters were used to putatively identify primate homologs of SChLAP1: Database = Reference RNA Sequences (refseq_rna) (O'Leary et al. 2016), Optimize for: more dissimilar sequences (discontiguous megablast). Figure 1 was generated using MegaBLAST, comparing each identified primate sequence (Supplemental Table S1) to isoform 4. PhyloP values were retrieved from the UCSC Genome Browser using the Table Browser (Kent et al. 2002). The following settings were used: clade: mammal; genome: human; assembly: GRCh38/hg38; group: comparative genomics. For the 30-mammal comparison, the following settings were used: track: cons 30 primates; table: cons 30 mammals (phyloP30way). For the 447-mammal comparison, the following settings were used: track: Cactus 447-way; table: 447 phyloP REV (phyloP447wayBW). PhyloP scores were exported for each exon and thereafter combined into a single file for subsequent analysis. The coordinates for SChLAP1 exons in the hg38 assembly were as follows (all Chromosome 2): exon 1: 180,692,104–180,692,441; exon 2: 180,724,596–180,724,690; exon 3: 180,725,191–180,725,291; exon 4: 180,823,933–180,824,070; exon 5: 180,827,241–180,827,507; exon 6: 180,899,650–180,899,718; exon 7: 180,916,273–180,916,939. PhyloP scores are provided in Supplemental Data 2.
RepeatMasker analysis of SChLAP1
RepeatMasker (http://www.repeatmasker.org/) was performed on the SChLAP1 Isoform 1 sequence with the following settings: search engine: RMBlast; speed/sensitivity: default; DNA source: human. No lineage annotation options were selected. Alignment options: no alignments returned; masking options: repetitive sequences replaced by strings of N's; contamination check: no contamination check; repeat options: masked interspersed and simple repeats; artifact check: report E. coli insertion element artifacts; matrix: RepeatMasker choice.
Structure analysis with ScanFold
Identification of significant local RNA structures was performed with ScanFold 2 (Andrews et al. 2022) using the following parameters: window size: 120; step size: 1; randomizations: 100; temperature: 37; filter value: −2; global refold: false; competition: true. For ScanFold 1 (Andrews et al. 2018), the following settings were used: window size: 120; step size: 1; randomizations: 30; shuffle type: mono; temperature: 37; competition: true; global refold: false.
DNA template and primers
All oligos were purchased from Integrated DNA Technologies (IDT). For generation of full-length SChLAP1 isoform 1 for in vitro transcription, the SChLAP1 sequence was inserted downstream from a bacteriophage T7 RNA polymerase promoter and upstream of the BamHI restriction site. Plasmid growth was performed by transformation into NEB5α competent cells (New England Biolabs) following manufacturer's instructions and subsequent selection on LB agar plates with ampicillin (100 µg/mL final) for overnight growth at 37°C. A single colony was propagated in LB broth with ampicillin selection, and plasmids were isolated using the QIAGEN Plasmid Kit. The plasmid was linearized using BamHI-HF (New England Biolabs), following manufacturer protocol. Linearized plasmid was purified using QIAGEN DNA Mini Kit. PCR reactions were performed using Q5 High-Fidelity DNA polymerase (New England Biolabs) and purified using DNA Clean and Concentrator 5 Kit (Zymo). To generate Arm A and Arm B, primers unique to the Arm A or Arm B were ordered, with the forward primer bearing a 5′ overhanging T7 promoter sequence such that the T7 promoter would be incorporated during PCR. See Supplemental Table S2 for all construct sequences, Supplemental Table S3 for primer sequences, and Supplemental Table S4 for RNA sequences.
In vitro SHAPE probing of SChLAP1
In vitro transcription (IVT) for SChLAP1 Isoform 1 was completed following the procedure from Adams et al. with some modifications (Adams et al. 2019). T7 RNA polymerase was a generous gift from Blanton Tolbert's lab (Case Western). No RNase inhibitor was used in any of the steps. IVT of these constructs was performed by mixing: 200 µL 10× transcription buffer (400 mM Tris-HCl pH 8.0, 100 mM NaCl, 120 mM MgCl2, 20 mM spermidine, 0.1% Triton X-100), 200 µL rNTPs (25 mM equimolar mix), 25 µL T7 RNA polymerase (custom preparation), 25 µL yeast inorganic pyrophosphatase (YIPP, 2 kU/mL, New England Biolabs), 50 µg PCR-amplified DNA template; 100 µL molecular biology grade DMSO (5% final), and nuclease-free water up to 2 mL. This mixture was aliquoted into 1.5 mL Eppendorf tubes at 500 µL each and incubated at 37°C for 2–4 h. DNase I, Proteinase K treatments, and RNA concentration were followed as outlined in Adams et al. (2019). Following concentration of the reaction with 100 kDa MWCO Amicon filter to a final volume of 1 mL, size exclusion chromatography was performed at room temperature using Bio-Rad NGC FPLC. A Cytiva (formerly GE Healthcare) HiPrep Sephacryl 16/60 S-500 column was used for SChLAP1 WT. An isocratic method was used using 1× filtration buffer (FB; 50 mM K-HEPES, pH 7.5, 150 mM KCl, 100 μM EDTA pH 8.0). Prior to use, columns were washed with three column volumes (CVs) of 1:1 RNaseZAP (Ambion) followed by three CV nuclease-free water (DEPC-treated Milli-Q water), and finally equilibrated with 3 CV 1× FB. Flow rates were between 0.5 and 0.75 mL/min, and 0.5 mL fractions were collected. RNA peaks were monitored using UV255 absorbance. The largest absorbance of the product peak and two surrounding fractions were used for downstream experiments. Nanodrop and/or Qubit confirmed RNA concentration, and purity was verified using agarose gel electrophoresis before proceeding. SChLAP1 isoform 1 was typically purified by SEC at ∼90 ng/µL for all probing reactions and were diluted with 1× FB if necessary to achieve this concentration.
RNA from the FPLC was maintained at room temperature prior to addition of MgCl2 to a final concentration of 5 mM final (i.e., 2.5 µL of 10× magnesium concentration in FB was added to 20 µL RNA for a total of 22.5 µL). These reactions were then incubated at 37°C for 30 min. 5 nitroisatoic anhydride (5NIA, MilliporeSigma) was prepared in DMSO immediately before probing. Following incubation with MgCl2, 5NIA was added to each reaction, flicked to mix, and incubated at 37°C for 10 min. At 10 min, each reaction was quenched by adding 33% final volume BME (Sigma-Aldrich) and placed on an ice block prechilled to −20°C. Prior to ethanol precipitation, Sephadex G-50 columns (Cytvia/GE Healthcare) were used to remove the hydrolyzed 5NIA reagent, following the manufacturer's instructions. SChLAP1 isoform 1 was probed in one biological replicate with SHAPE reagent and an independent biological replicate with DMS.
DMS chemical probing
In vitro DMS probing was completed following protocols from the Rouskin lab (Zubradt et al. 2017). PCR, IVT, and FPLC purification of SChLAP1 Iso. 1 were completed as described above. Following FPLC purification, RNA samples were adjusted to 300 mM HEPES and 5 mM MgCl2 before incubation at 37°C for 30 min prior to DMS probing. DMS (EMD Millipore) was diluted into 100% molecular biology grade ethanol for a final concentration of 2% upon addition to the RNA sample and was prepared immediately prior to use to limit oxidation. DMS was incubated with the RNA at 37°C for 5 min while shaking at 500 rpm. The reaction was quenched after 5 min by adding 33% final volume BME (MilliporeSigma) and placed on an ice block prechilled to −20°C.
In cellulo SHAPE
In-cell SHAPE probing was performed with the reagent 5NIA in the LNCaP cell line following previous protocols (Smola et al. 2015a, 2016; Busan et al. 2019). Specifically, LNCaP cells were plated at 5 × 10⁵ cells per well in a 6-well plate and grown for ∼2 days. On the day of the experiment, cells were washed with 1 mL warm PBS (GenClone), and 900 µL complete media was added to each well. To control wells, 100 µL anhydrous DMSO (Invitrogen) was added. For SHAPE-probed wells, 100 µL of freshly prepared 250 mM 5NIA was added. Gentle swirling was used to evenly distribute the SHAPE reagent. The reactions were incubated in an incubator at 37°C for 15 min. After probing, the media were removed, and cells were washed with 1 mL warm PBS. Total RNA from each reaction was extracted with TRIzol reagent and resuspended in nuclease-free water. The solutions were treated twice with DNase I and thereafter purified using RNA Clean/Concentrator 25 columns (Zymo).
Ex cellulo SHAPE
Ex cellulo SHAPE was performed with 5NIA following previous protocols with RNA isolated from the LNCaP cell line (Smola et al. 2015a, 2016; Busan et al. 2019). Cells were grown to ∼80% confluency in a T-75 flask. The cells were trypsinized, pelleted, and resuspended in ice-cold PBS. Four million cells were centrifuged and resuspended in 2.5 mL freshly prepared lysis buffer (40 mM Tris-HCl [pH 7.9], 25 mM NaCl, 6 mM MgCl2, 1 mM CaCl2, 256 mM sucrose, 0.5% [vol/vol] Triton X-100, 1000 U/mL RNase inhibitor [Promega], and 450 U/mL DNase I [Roche]) and rocked at 4°C for 5 min. This mix was centrifuged at 2250g for 2 min at 4°C. The resultant pellet (nuclei) was resuspended in 2.5 mL Proteinase K buffer (40 mM Tris-HCl [pH 7.9], 200 mM NaCl, 1.5% w/v SDS, and 500 μg/mL Proteinase K [MilliporeSigma]) and treated for 45 min at ∼20°C. After Proteinase K treatment, 2.5 mL phenol:chloroform:isoamyl alcohol (25:24:1) pre-equilibrated with 1.1× refolding buffer (55 mM K-HEPES pH 7.5, 165 mM KCl, 5.5 mM MgCl2, 0.11 mM EDTA; chosen for consistency with in vitro work) was added, and the sample was vortexed and centrifuged at 4000g for 15 min at 4°C. The aqueous phase was isolated, and the pre-equilibrated phenol:chloroform:isoamyl alcohol extraction was repeated. Thereafter, the aqueous phase was mixed with 2.5 mL chloroform, vortexed, and centrifuged as above. The aqueous phase was isolated, and the chloroform extraction was repeated. The resultant aqueous phase was buffer exchanged into 1.1× refolding buffer using PD-10 columns (Cytvia) following the gravity protocol. The eluate was separated into two tubes of equal volume (∼1.7 mL) and incubated at 37°C for 30 min. DMSO was added to the control tube, and 5NIA (25 mM final) was added to the SHAPE-treated well. Reactions were incubated at 37°C for 15 min. Control and probed RNA was isolated by ethanol precipitation and resuspended in 87 µL nuclease-free water. DNase treatment and column clean-up were performed identically to the in cellulo samples.
RNA reverse transcription
To sequence SChLAP1 for mutational profiling, we used an amplicon workflow wherein SChLAP1 was sequenced in four overlapping amplicons of maximum 500 nt (∼600 upon addition of sequencing adaptors; amplicon sequences provided in Supplemental Table S2). Each amplicon overlapped with the adjacent amplicons via a 100 bp window. Thus, four unique reverse transcription reactions (one for each amplicon) were performed for each condition (mock or SHAPE probed) to generate sequencing profiles for the full SChLAP1 sequence for each experiment. For generating sequencing profiles for cell-derived amplicon 4, SChLAP1 was initially reverse transcribed with the amplicon 4 reverse primer followed by PCR with the amplicon 4 reverse primer and the amplicon 3 forward primer. The subsequent product was gel purified and underwent PCR amplification with step 1 primers specific to the original amplicon 4 coordinates. Sequences for all primers are provided in Supplemental Table S3. Reverse transcription reactions were performed with blunt-end primers (i.e., no overhangs).
Reverse transcription of probed RNA was adapted from previous protocols (Smola et al. 2015b; Adams et al. 2019). For in cellulo probed RNA, ∼2000 ng total RNA (mock or 5NIA probed) was mixed with 1 µL 10 µM reverse primer (unique to each amplicon) and brought to 10 µL final in nuclease-free water. For ex cellulo probed RNA, 750 ng RNA was used as the input for RT. Primers were annealed by incubating at 65°C, followed by incubation on ice for 15 min. To these mixes, 8 µL 2.5× MaP buffer was added (125 mM Tris-HCl pH 8, 187.5 mM KCl, 25 mM DTT, 1.25 mM dNTP mix, and 15 mM MnCl2), followed by 2 µL SuperScript II (Invitrogen). Reactions were incubated at 25°C for 10 min, 42°C for 3 h, 70°C for 15 min, and then stored at −20°C. Reverse transcription reactions were cleaned up using DNA Clean and Concentrator 5 columns (Zymo) before proceeding to PCR and library preparation.
For reverse transcription of in vitro probed SChLAP1 WT, 1 µg of RNA was diluted into 16 µL of nuclease-free water and divided such that 250 ng RNA went into each RT reaction. To each reaction, 1 µL of 1 µM respective primer was added and incubated at 65°C for 5 min before the reaction was placed on ice. Then, 8 µL of 2.5× MaP Buffer was added and incubated at 42°C for 2 min before addition of 1 µL SuperScript II Reverse Transcriptase (Thermo Fisher) and incubation at 42°C for 3 h. Samples were heat inactivated at 70°C for 15 min.
Reverse transcription for in vitro DMS-treated samples was adapted from previous protocols (Zubradt et al. 2017), 0.5 μg RNA was mixed with 2 μL 10× FSB (500 mM Tris pH 8.0, 750 mM KCl, 100 mM DTT), 1 μL dNTPs (10 mM equimolar mix), 1 μL TGIRT-III Reverse Transcriptase (200 U/μL, InGex), 1 μL of 10 μM respective reverse primer, 1 μL of 1M DTT, and brought to 20 µL final with nuclease-free water. The reactions were incubated at 65°C for 90 min and inactivated at 85°C for 5 min.
SHAPE library preparation
Following reverse transcription, SChLAP1 amplicons were initially amplified using blunt end primers (Supplemental Table S3). Thereafter, library preparation was performed using a two-step PCR reaction to add on Illumina primers following the amplicon workflow outlined previously (Smola et al. 2015b). Step 1 PCR primer sequences are provided in Supplemental Table S3. PCR was performed using the Q5 High-Fidelity Polymerase (New England Biolabs). After each PCR step, amplicons were gel purified as needed using 1% or 2% agarose EX E-gels (Invitrogen) and Zymoclean Gel DNA Recovery Kit (Zymo), and thereafter quantified using a Qubit dsDNA High Sensitivity (HS) Assay Kit (Invitrogen). After completion of library preparation, samples were submitted to the Duke University School of Medicine Sequencing and Genomic Technologies Shared Resource. Samples were pooled and sequenced on an Illumina MiSeq Sequencer using Reagent Kit v3 (2 × 300 bp).
DMS library preparation
Following reverse transcription (outlined above), DMS-probed samples were amplified into dsDNA using blunt-end primers. These samples were submitted to the Whitehead Institute for Biomedical Research Genome Technology Core for tagmentation prior to sequencing, as described above.
Bioinformatics pipeline
SHAPE reactivity profiles, error estimates, mutation counts, and sequencing depths were obtained using the ShapeMapper pipeline (v 2.1.5) developed by the Weeks lab (UNC-Chapel Hill) (Busan and Weeks 2018). All default parameters were used. Samples were filtered at ≥1000 nt read depth.
After running ShapeMapper for each amplicon, amplicons within the same experiment were normalized using the box-plot method (Low and Weeks 2010). Mutation rates and error values from the output reactivity profiles were manually averaged within the overlapping regions for each experiment. The 5 nt upstream of the reverse primer binding sites were not considered for averaging due to low fidelity of SuperScript II at reverse transcription start sites, consistent with previous work (Przanowska et al. 2022). If a nucleotide had a defined mutation rate in the overlapping windows for one amplicon, but not the other (e.g., defined in amplicon 3, but not in amplicon 4), the mutation rate from the amplicon where it was defined was taken forward without averaging. Thereafter, the normalization scale was calculated. Specifically, the interquartile range (IQR) of the averaged data was calculated, and nucleotides with mutation rates 1.5× the IQR were removed from calculation of the normalization scale. The normalization scale was calculated as the average of the top 10% of the remaining nucleotides. The mutation rates and standard errors of all nucleotides were divided by this normalization scale to give a normalized .map file. The 5′ primer binding site, 3′ primer binding site (with 5 nt upstream, this site excluded), and any nucleotides that were undefined in starting map files were set as undefined in these updated map files. In addition, a poly(A) stretch (nucleotides 1088–1104) were excluded from normalization and were set to −999 in the final reactivity data due to bypass of chemical probing data in poly(A) stretches (Kladwang et al. 2020).
As it was previously established that 5NIA has a bias for reactivity with adenosines, the map files generated above were rescaled using scale_nuc.py from the Weeks group using the command ‐‐reagent 5NIA (Busan et al. 2019). After rescaling, these final map files were used for downstream analyses. These reactivities, along with DMS reactivities (below), are provided in Supplemental Data 1.
For DMS probing, mutation counts were calculated in the DMS-MaPSeq program from the Rouskin group (Zubradt et al. 2017). DMSO-only mutation counts were subtracted from DMS-probed mutation counts. The mutation counts for adenosine and cytosine nucleotides were normalized following the above protocol. Normalized reactivities were manually overlaid onto the SHAPE-informed minimum free energy structure of in vitro SChLAP1 Iso. 1 (Supplemental Fig. S4A).
Structure modeling
Arc diagrams and Shannon entropies for full-length SChLAP1 were generated using SuperFold (v1.0) (Smola et al. 2015b). Minimum free energy structure models of full-length SChLAP1 (in vitro and ex cellulo) were generating using the RNAstructure command line with SHAPE data as input and the command ‐‐maxdistance 600 used (Reuter and Mathews 2010). For smaller constructs (e.g., Arm A and Arm B), the RNAstructure web server was used with default parameters (Bellaousov et al. 2013).
Pseudoknot predictions were carried out using ShapeKnots in the RNAstructure command line with default parameters (Hajdin et al. 2013). SHAPE reactivities from ex cellulo and in vitro data were divided into 600 nt windows separated by 100 nt. Pseudoknots predicted in multiple folding windows were considered (Smola et al. 2016; Wan et al. 2022). SHAPE reactivities were manually inspected for compatibility with pseudoknot formation and additionally checked against in cellulo reactivity (see Supplemental Text 1).
G-quadruplex prediction was performed using QGRS Mapper (Kikin et al. 2006), with default parameters used except for as mentioned in the Results section for the maximum length parameter.
Identification of protein binding sites by ΔSHAPE
Map files from the ex cellulo and in cellulo experiments were analyzed using ΔSHAPE following default parameters (Smola et al. 2015a). Given the known sensitivity of ΔSHAPE to hyperreactive nucleotides (Smola et al. 2016; Schmidt et al. 2020), we developed a protocol to exclude such hyperreactive nucleotides by identifying and removing the top and bottom 0.1% of SHAPE reactivities from each experiment (corresponding to the top and bottom 2 nt for a given .map file). We note that these nucleotides were maintained for structure modeling and identification of lowSS regions. The 95th percentile of the reactivities for each input map file did not differ by more than 3%, so no additional rescaling was performed for ΔSHAPE analysis as has been done previously (Smola et al. 2016; Schmidt et al. 2020). As previously performed for Xist (Smola et al. 2016), each replicate was handled independently; that is, replicate 1 of in cellulo probing was compared to replicate 1 of ex cellulo probing, and replicate 2 of in cellulo probing was compared to replicate 2 of ex cellulo probing. The most significant regions of in-cell enhancement or protection (depicted in Fig. 4) were identified as follows: nucleotides reproduced between both replicates of ΔSHAPE analysis were identified. From these nucleotides, neighboring ΔSHAPE-identified nucleotides from each replicate (tolerating gaps of 1 nt) were merged together to generate a final coordinate of significant protection or enhancement (e.g., nucleotides 45, 46, and 47 in replicate 1 and 44, 45, and 46 in replicate 2 were merged to 44–47 for Fig. 4).
Comparison of SHAPE reactivities for in cellulo versus ex cellulo SChLAP1
For comparison of larger reactivity changes between ex cellulo and in cellulo SChLAP1, SHAPE reactivities for in cellulo or ex cellulo SChLAP1 were averaged over 51 nt windows, and these windowed values were subtracted (in cellulo−ex cellulo) as done previously (Smola et al. 2016). As with ΔSHAPE analysis, the top and bottom 0.1% of SHAPE reactivities were removed to facilitate comparison. Regions of significant reactivity were identified as 30 nt or greater where the absolute value of the reactivity change was higher than the median of the absolute value of all reactivity changes, similar to previous work (Smola et al. 2016). Only regions that were supported in both replicates were considered significant.
Identification of well-folded RNA structures
Calculation of regions with low SHAPE reactivity and low Shannon entropy was carried out as previously described (Smola et al. 2016; Wan et al. 2022). Median SHAPE reactivities and Shannon entropies were calculated over 51 nt sliding windows. Thereafter, the global medians of the SHAPE reactivities and Shannon entropies were subtracted from those local values. Regions at least 40 nt in length (with gaps of up to 6 nt), where the local median SHAPE/Shannon values were lower than the global median SHAPE/Shannon, were considered potential lowSS sites. Only lowSS sites reproducible between replicates (i.e., overlapping nucleotides, or replicates where nucleotides on opposite sides of a predicted stem were called) were considered in our final analysis. The coordinates of lowSS sites were expanded to include an entire partition-function predicted structure.
Correlation analyses and statistics
Pearson correlation coefficients were calculated in GraphPad Prism (Version 9) or Microsoft Excel (Version 16). Before comparison, nucleotides within primer binding sites or undefined reactivities were removed. If a nucleotide had an undefined reactivity in one SHAPE profile, it was removed from both profiles in the comparison before calculation of correlation coefficients. For comparison between in vitro and ex cellulo SChLAP1 (Supplemental Fig. S7), the outlier removal approach as used in ΔSHAPE was also used. All t-test statistics were performed in GraphPad Prism.
In vitro transcription of Arm A and Arm B
Arm A and Arm B were in vitro transcribed overnight at 37°C in the following conditions: 2.5 mM rNTP mix, 25 mM MgCl2, 40 mM Tris-HCl pH 8.0, 2.5 mM spermidine, 0.01% Triton X-100, 10 mM DTT, 0.5 U/mL yeast inorganic pyrophosphatase (New England Biolabs), ∼125 µg/mL T7 RNA polymerase, and either 5% or 10% DMSO for Arm A or Arm B, respectively. After IVT, the reactions were treated twice with DNase I (New England Biolabs) and quenched with 10% volume of 0.5 M EDTA pH 8.0. The reactions were cleaned up with RNA Clean and Concentrator 100 columns (Zymo, referred to as “kit-purified” in text). Purity was assessed using a 6% Tris-Borate-Urea gel (Invitrogen).
For native purification of Arm B, the protocol for in vitro transcription of full-length SChLAP1 was adopted with the following modifications: (1) 10% DMSO was used rather than 5% DMSO, (2) Arm B was purified on an ENrich SEC 650 24 mL column (Bio-Rad), and (3) a smaller IVT scale was used because a lower amount of RNA was needed for native gel electrophoresis. As above, the RNA was maintained at room temperature during this process. This sample is also referred to as “FPLC-purified” in text.
Native gel electrophoresis
For divalent metal dependent experiments, Arm A or Arm B RNA was annealed in filtration buffer at ∼50 nM. Annealing reactions were carried out at 20 µL aliquots. For snap-cooling, RNA was incubated at 95°C for 5 min and then submerged in ice for 15 min. For slow-cooling, RNA was incubated at 95°C for 5 min, cooled stepwise by 1°C/min until 25°C was reached, and then incubated at 25°C for 10 min followed by 4°C for 10 min. Divalent metals were spiked in from 20× concentrated stocks such that the desired final concentration of divalent metal was obtained. The samples were then incubated at 37°C for 30 min. Thereafter, 6 µL of the RNA was mixed with 6 µL 2× sample buffer (filtration buffer spiked with desired final divalent metal concentration, 10% glycerol, and 0.1% NP-40). Ten microliters of this mix was added into wells of a 12-well 6% DNA retardation gel (Invitrogen) that was prerunning for at least 30 min in 0.5× TBE at 150 V. The gels ran for 1 h and 45 min (Arm B) or 1 h and 15 min (Arm A, or gels where Arm A and Arm B ran together) before staining with Diamond Nucleic Acid Stain (Promega) for 20 min. Gels were imaged on an iBright 1500 imaging system (Thermo Fisher Scientific).
For KCl-dependent experiments, RNA was resuspended in HEPES-EDTA buffer (50 mM K-HEPES, pH 7.5, 100 µM EDTA), and KCl was spiked in from 20× concentrated stocks such that the final desired concentration was obtained. RNA was annealed (snap- or slow-cooled) as above and incubated at 37°C for 30 min for consistency with divalent metal experiments. The RNA was mixed with the same 2× sample buffer as above, with the exception that the KCl concentration was adjusted for each sample.
Nuclear extraction
Nuclear extraction was adapted from previous protocols (Thermo Fisher Scientific 2007). LNCaP cells were grown in T-175 flasks. On the day of extraction, cells were trypsinized, washed twice in cold PBS, and resuspended in hypotonic buffer (20 mM Tris-HCl pH 7.4, 10 mM NaCl, 3 mM MgCl2) spiked with 1× Halt EDTA-free Protease Inhibitor Cocktail (Thermo Fisher) and 1 mM freshly prepared PMSF. The sample was incubated on ice for 15 min. Thereafter, 25 µL 10% NP-40 was added per 500 µL sample, and the solution was vortexed for 10 sec. The sample was then centrifuged at 3000g for 10 min at 4°C. The resultant pellet was resuspended in Cell Extraction Buffer (Thermo Fisher; 10 mM Tris, pH 7.4, 100 mM NaCl, 1 mM EDTA, 1 mM EGTA, 1 mM NaF, 20 mM Na4P2O7, 2 mM Na3VO4, 1% Triton X-100, 10% glycerol, 0.1% SDS, 0.5% deoxycholate) spiked with 1× Halt EDTA-free Protease Inhibitor Cocktail and 1 mM PMSF. The solution was incubated on ice for 30 min with vortexing every 10 min. The sample was then centrifuged at 14,000g for 30 min at 4°C. The resultant supernatant was isolated. The glycerol concentration was adjusted to 20% final by addition of 125 µL glycerol per 1 mL nuclear extract. The nuclear extracts were then aliquoted and stored at −80°C. Protein abundance was quantified using a Qubit Fluorometer, the Qubit Protein Assay Kit (Thermo Fisher).
Biotinylated RNA pulldown
Protein pulldown using biotinylated RNA baits was performed with modified protocols using the Pierce Magnetic RNA-Protein Pull-Down Kit (Thermo Fisher). Biotinylated RNA oligonucleotides were purchased from IDT (Supplemental Table S5). For each oligonucleotide, 30 µL samples were prepared consisting of 1 µM RNA in 1× RNA folding buffer (20 mM Tris-HCl pH 7.5, 50 mM KCl, 1 mM MgCl2). The samples were snap-cooled by incubation at 95°C for 5 min followed by ice for 15 min. After annealing, 7.5 µL 5× RNA Capture Buffer (20 mM Tris-HCl pH 7.5, 5M NaCl, 5 mM EDTA) was added to each sample. While RNA was annealing, 30 µL Pierce Nucleic Acid-Compatible Streptavidin Magnetic Beads was added to 1.5 mL microcentrifuge tubes. Beads were immobilized on a magnetic rack washed twice with 30 µL 20 mM Tris-HCl pH 7.5. Thereafter, the beads were immobilized, and 37.5 µL annealed RNA sample was added to the beads. Control (beads-only) samples consisted of 30 µL 1× RNA folding buffer spiked with 7.5 µL 5× RNA capture buffer, that is, no RNA was added. The beads were incubated at 25°C on a Thermomixer rotating at 800 rpm for 30 min to allow for RNA binding to the beads. The beads were then washed twice with 20 mM Tris-HCl pH 7.5 to remove unbound oligonucleotides.
Beads were isolated and resuspended in 100 µL 1× incubation buffer (20 mM Tris-HCl pH 7.5, 50 mM KCl, 1 mM MgCl2, 0.1% Tween-20). Protein samples consisted of 1× incubation buffer final (diluted from a 10× stock), 15% glycerol, 1 U/µL Superase-In RNase inhibitor (Thermo Fisher), and 250 µg LNCaP nuclear extract. One hundred microliters of protein mix was added to each tube of beads, and the samples were incubated for 60 min at 4°C with rotation.
Washing and elution conditions were adapted from previous reports (Choi et al. 2022). After incubation, the beads were washed four times in wash buffer (20 mM Tris-HCl pH 7.5, 50 mM KCl, 1 mM MgCl2, 0.5 mM DTT, 0.1% Tween-20). Elution was performed by addition of 50 µL 50 mM Tris-HCl pH 7.5, 200 mM NaCl, 2% SDS (w/v), and 1 mM biotin. The samples were incubated on a Thermomixer at 60°C for 30 min at 1100 rpm. The eluates were collected and stored at −20°C.
LC-MS/MS analysis of pulldown samples
Qualitative proteomics was performed on one replicate of each RNA-containing pulldown sample (i.e., beads-only was not submitted for proteomics). Samples were spiked with 1 pmol bovine casein as an internal quality control standard and then brought to 5% SDS, reduced for 15 min at 80°C with 10 mM dithiothreitol, and alkylated with 20 mM iodoacetamide for 30 min at room temperature. Samples were then supplemented with a final concentration of 1.2% phosphoric acid and 375 µL of S-Trap (ProtiFi) binding buffer (90% MeOH/100 mM TEAB). Proteins were trapped on the S-Trap micro cartridge, digested using 20 ng/µL sequencing grade trypsin (Promega) for 1 h at 47°C, and eluted using 50 mM TEAB, followed by 0.2% FA, and lastly using 50% ACN/0.2% FA. All samples were then lyophilized to dryness. Samples were resuspended in 40 µL of 1% TFA/2% acetonitrile with 12.5 fmol/µL of yeast ADH.
LC/MS/MS was performed using an EvoSep One UPLC coupled to a Thermo Orbitrap Astral high-resolution accurate mass tandem mass spectrometer (Thermo). Briefly, each sample loaded EvoTip was eluted onto a 1.5 µm EvoSep 150 µm ID × 15 cm performance (EvoSep) column using the SPD30 gradient at 55C. Data collection on the Orbitrap Astral mass spectrometer was performed in a data-independent acquisition (DIA) mode of acquisition with a r = 240,000 (@ m/z 200) full MS scan from m/z 380–980 in the OT with a target AGC value of 4 × 10⁵ ions. Fixed DIA windows of 4 m/z from m/z 380–980 DIA MS/MS scans were acquired in the Astral with a target AGC value of 5 × 10⁴ and max fill time of 6 msec. HCD collision energy setting of 27% was used for all MS2 scans. Data were imported into Spectronaut 19 (Biognosys). Relative peptide abundance was measured based on MS2 fragment ions of selected ion chromatograms of the retention time aligned runs. The MS/MS data were searched against a SwissProt Human database (downloaded in 2024), a common contaminant/spiked protein database (bovine albumin, bovine casein, yeast ADH, etc.), and an equal number of reversed-sequence “decoys” for false discovery rate determination. A Direct DIA+ library free approach within Spectronaut was used to perform the database searches. Database search parameters included fixed modification on Cys (carbamidomethyl) with variable modification on Met (oxidation). Full trypsin enzyme rules were used along with 10 ppm mass tolerances on precursor ions and 20 ppm on product ion. Spectral annotation was set at a maximum 1% peptide false discovery rate based on q-value calculations. Note that peptide homology was addressed using razor rules in which a peptide matched to multiple different proteins was exclusively assigned to the protein that has more identified peptides. Protein homology was addressed by grouping proteins that had the same set of peptides to account for their identification. A master protein within a group was assigned based on % coverage.
Gene ontology
Gene ontology analysis was performed using the STRING database with default parameters (Szklarczyk et al. 2023). Proteins were sorted by maximum to minimum total protein count across the four SChLAP1 pulldowns. The top 100 proteins in the proteomics data were analyzed, with control proteins (Sus scrofa trypsin, Saccharomyces cerevisiae alcohol dehydrogenase 1, and Bos taurus Alpha-S1-casein and Alpha-S2-casein) removed from consideration, leaving 96 proteins in the analysis.
Nomination of potentially selective substructure:protein interactions
The top proteins identified were analyzed as follows. For a given protein, the maximum signal intensity across the four SChLAP1 pulldowns was used to divide the signal intensities of the remaining pulldowns, thereby placing the signal intensity for each protein on a scale of 0–1 (maximum) across the four pulldowns. We only considered proteins where all calculated values in the nonmaximum pulldown were <0.3 (i.e., potentially structure-specific proteins had at most 30% of the signal intensity for the maximum pulldown as they did for the remaining pulldowns). These proteins are shown in Supplemental Figure S13C. As described in the Results section, we ignored proteins that fit these categories with maximum intensity being for the CU-strand. Antibodies for western blot were selected from this list.
SDS-PAGE
SDS-PAGE was performed by mixing 6 µL of pulldown sample with 6 µL 2× SDS-PAGE sample buffer (62.5 mM Tris-HCl pH 6.8, 2% SDS, 25% glycerol, and 5% BME) followed by incubation at 95°C for 10 min. Ten microliters of these samples were loaded into wells of a 4%–12% NuPAGE Bis-Tris Mini Protein gel (Invitrogen). The gel was run at 120–130 V for 75 in 1× MOPS buffer. One percentage of input samples were prepared by mixing 6 µL of 0.5 µg/µL nuclear extract diluted in water with 6 µL 2× sample buffer before loading 10 µL onto the gel (2.5 µg protein total). Ladder lanes contained 2 µL of PageRuler Prestained NIR Protein Ladder (Thermo Fisher Scientific). The gels were then either silver stained using the Pierce Silver Stain for Mass Spectrometry Kit or used for western blotting.
Western blot
SDS-PAGE was performed as above with 2% or 5% input. Input samples were diluted in 50 mM Tris-HCl pH 7.5, 200 mM NaCl, 2% SDS, as we found that having a similar buffer composition content between input and pulldown samples gave better visualization of all samples by western blot. After SDS-PAGE, the protein gel was removed from its casing and equilibrated in cold 1× NuPAGE transfer buffer (Thermo Fisher) with 10% methanol for ∼15 min. A low-fluorescence 0.2 µm PVDF membrane (Thermo Fisher Scientific) was briefly incubated in 100% methanol followed by water for 2 min. Thereafter, the membrane was also incubated in cold 1× NuPAGE transfer buffer with 10% methanol for ∼15 min. Transfer was performed for 60 min at 20 V with a Mini Blot Module (Invitrogen). Thereafter, the membrane was washed twice for 5 min with water and then blocked for 2 h at room temperature with 5% bovine serum albumin (BSA) in PBS. The membranes were then incubated overnight at 4°C with primary antibodies diluted as follows: rabbit anti-BRG1 (1:10,000, Abcam ab110641), mouse anti-HNRNPL (Abcam ab6106, 1:2000), rabbit anti-FUBP1 (Thermo PA5-82235, 1:1000), rabbit anti-PCBP2 (Thermo/Proteintech 15070-1-AP, 1:1000), and HNRNPK (Santa Cruz sc-32307, 1:1000).
After incubation with primary antibodies, the membranes were washed three times for 10 min each in PBS-Tween 20 (PBST) and once for 5 min in PBS. The following secondary antibodies were used: goat anti-rabbit IgG Alexa Fluor 488 (Invitrogen A32731), goat anti-mouse IgG Alexa Fluor 555 (Invitrogen A32727). Secondary antibodies were diluted to 1:10,000 in 5% BSA in PBST (1:2500 for BRG1 blots). The membrane was incubated in secondary antibodies for 1 h before washing three times for 10 min each in PBST and two times for 5 min in PBS. The membrane was imaged on an iBright 1500 Imager (Thermo Fisher Scientific) using the Alexa Fluor 488, 555, or 680 channels.
DATA DEPOSITION
Unprocessed sequencing files and initial outputs of ShapeMapper are available at Gene Expression Omnibus (GSE243328). SHAPE reactivities after normalization and 5NIA rescaling are provided in Supplemental Appendix S1. The mass spectrometry proteomics data have been deposited to the ProteomeXchange Consortium via the PRIDE partner repository (Perez-Riverol et al. 2002) with the data set identifier PXD055741.
SUPPLEMENTAL MATERIAL
Supplemental material is available for this article.
ACKNOWLEDGMENTS
We acknowledge all members of the Hargrove lab, past and present, for invaluable feedback and support. We also thank Bill Day, Michael Peterson, and İrem Altan for assistance with computation. In addition, we also acknowledge Marek Zorawski for assistance with computation and cell culture. We also thank Whitehead Institute for Biomedical Research Genome Technology Core for DMS sample preparation and sequencing, as well as Silvi Rouskin and Fengrui Zhang for help with DMS data processing. We thank the Duke University School of Medicine for the use of the Sequencing and Genomic Technologies Shared Resource, which provided MiSeq service, and for the use of the Proteomics and Metabolomics Core Facility, which provided mass spectrometry service. Lastly, we thank the Duke Compute Cluster for use of their cluster. We acknowledge financial support from the Prostate Cancer Foundation Young Investigator Award and the Office of the Assistant Secretary of Defense for Health Affairs through the Prostate Cancer Research Program (W81XWH2010188). We also acknowledge support from the National Cancer Institute (R21 CA277305-01). E.J.M. was supported in part by Duke University Center for Biomolecular and Tissue Engineering Ruth L. Kirschstein Fellowship (T32GM008555). J.P.F. was supported in part by a Duke University Department of Biochemistry fellowship and Duke University School of Medicine scholarship funding. Opinions, interpretations, conclusions, and recommendations are those of the authors and are not necessarily endorsed by the Department of Defense. In the conduct of research using recombinant DNA, the investigator adhered to NIH Guidelines for research involving recombinant DNA molecules.
Footnotes
-
↵4 Joint authors
-
Article is online at http://www.rnajournal.org/cgi/doi/10.1261/rna.080488.125.
-
Freely available online through the RNA Open Access option.
- Received March 31, 2025.
- Accepted May 5, 2025.
This article, published in RNA, is available under a Creative Commons License (Attribution-NonCommercial 4.0 International), as described at http://creativecommons.org/licenses/by-nc/4.0/.




