


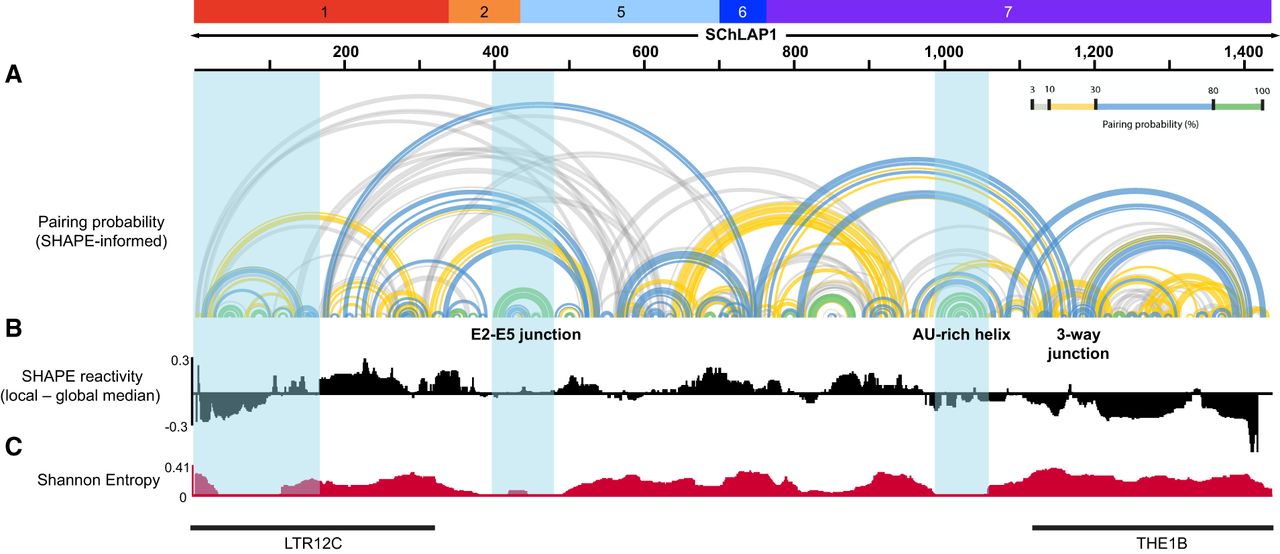
FIGURE 3.
SChLAP1 secondary structure generated through ex cellulo SHAPE-MaP from LNCaP cells (representative of two independent replicates). (A) Arc diagram showing the SHAPE-informed base-pair predictions across ex cellulo SChLAP1. Arc diagram of second replicate shown in Supplemental Figure S5C. (B) Median SHAPE reactivity of 51 nt windows across the length of SChLAP1 subtracted from the global median (SHAPE = 0.31). (C) Shannon entropy plot across SChLAP1. Blue boxes denote low SHAPE/Shannon regions that were reproducible across both biological replicates. Figure generated in Integrative Genomics Viewer (Robinson et al. 2011).




