


lncRNA BC200 is processed into a stable Alu monomer
- Evan P. Booy1,
- Daniel Gussakovsky1,
- Mira Brown1,
- Rowan Shwaluk1,
- Mark W. Nachtigal2,3,4 and
- Sean A. McKenna1
- 1Department of Chemistry, University of Manitoba, Winnipeg, Manitoba, Canada R3T 2N2
- 2Department of Biochemistry and Medical Genetics, Gynecology and Reproductive Sciences, University of Manitoba, Winnipeg, Manitoba, Canada R3E 0J9
- 3Department of Obstetrics, Gynecology and Reproductive Sciences, University of Manitoba, Winnipeg, Manitoba, Canada R3E 0J9
- 4Paul Albrechtsen Research Institute, CancerCare Manitoba, Winnipeg, Manitoba, Canada R2H 2A6
- Corresponding author: sean.mckenna{at}umanitoba.ca
-
Handling editor: Ling-Ling Chen
Abstract
The noncoding RNA BC200 is elevated in human cancers and is implicated in translation regulation as well as cell survival and proliferation. Upon BC200 overexpression, we observed correlated expression of a second, smaller RNA species. This RNA is expressed endogenously and exhibits cell-type-dependent variability relative to BC200. Aptamer-tagged expression constructs confirmed that the RNA is a truncated form of BC200, and sequencing revealed a modal length of 120 nt; thus, we refer to the RNA fragment as BC120. We present a methodology for accurate and specific detection of BC120 and establish that BC120 is expressed in several normal human tissues and is also elevated in ovarian cancer. BC120 exhibits remarkable stability relative to BC200 and is resistant to knockdown strategies that target the 3′ unique sequence of BC200. Combined knockdown of BC200 and BC120 exhibits greater phenotypic impacts than knockdown of BC200 alone, and overexpression of BC120 negatively impacts translation of a GFP reporter, providing insight into a potential translational regulatory role for this RNA. The presence of a novel, truncated, and stable form of BC200 adds complexity to the investigation of this noncoding RNA that must be considered in future studies of BC200 and other related Alu RNAs.
Keywords
- BC200
- brain cytoplasmic RNA 1 (BCYRN1)
- Alu
- long noncoding RNA (long ncRNA; lncRNA)
- short interspersed element (SINE)
- high-grade serous carcinoma (HGSC)
INTRODUCTION
BC200 (BCYRN1) is an anthropoid primate-specific 200 nt noncoding RNA (ncRNA) that exhibits high levels of expression in the brain and aberrant elevated expression in a broad spectrum of human cancers (Watson and Sutcliffe 1987; Tiedge et al. 1991; Martignetti and Brosius 1993; Booy et al. 2017; Samson et al. 2018; Shin et al. 2018; Ghafouri-Fard et al. 2021). In neurons, BC200 is localized to dendrites and is believed to play a regulatory role in the site-specific translation of mRNAs (Tiedge et al. 1991; Wang et al. 2002; Khanam et al. 2007; Jang et al. 2020). In cancer cell lines, the function of BC200 is not yet clearly defined with evidence supporting both translational inhibitory and activating roles (Kondrashov et al. 2005; Lin et al. 2008; Sosińska et al. 2015; Jang et al. 2017,2020; Booy et al. 2021). Regardless of the specific mechanism of action, BC200 has been demonstrated to promote cancer cell viability and migration/metastasis (Samson et al. 2018; Shin et al. 2018; Yu and Chen 2019; Ghafouri-Fard et al. 2021).
BC200 is an Alu containing RNA demonstrating >90% similarity to the consensus Alu J element left monomer that encompasses the first ∼120 nucleotides (nt) of the RNA and was likely derived from a free left Alu arm (FLAM) (Watson and Sutcliffe 1987; Jurka and Milosavljevic 1991; Martignetti and Brosius 1993). Alu elements are short interspersed elements (SINES) with sequence homology with the 7SL RNA of the signal recognition particle (Ullu and Tschudi 1984). Alu monomers are believed to have originated from the fusion of sequence derived from the 5′ and 3′ ends of the 7SL RNA. A second head-to-tail fusion event of two distinct Alu monomers is assumed to have generated the ∼300 nt dimeric Alu elements that are prevalent in the human genome (Ullu and Tschudi 1984; Quentin 1992). These elements comprise three major families termed Alu J, Y, and S, and both monomeric and dimeric Alu elements are highly abundant, consisting of greater than one million copies that account for over 10% of the human genome (Jurka and Milosavljevic 1991; Deininger 2011). Alu families are thought to have amplified throughout the human genome from a subset of master genes that have generated discernible subfamilies based on diagnostic mutation patterns (Shen et al. 1991). While Alu elements are generally transcriptionally repressed due to both DNA methylation (Liu et al. 1994) and the absence of upstream promoters (Ludwig et al. 2005; Khanam et al. 2007), they contain internal RNA polymerase III promoter elements and are transcribed under particular cell stress conditions including in the presence of translational repressors, upon viral infection and heat shock, and in cancer (Jang and Latchman 1989; Panning and Smiley 1993, 1995; Liu et al. 1994, 1995; Roy et al. 2000; Comeaux et al. 2009; Chen and Yang 2017). These transcripts are of heterogeneous length depending upon where in the downstream flanking sequence the first RNA polymerase III termination signal is found (Elder et al. 1981). The induction of Alu RNA expression upon treatment with translation inhibitors of diverse modes of action suggests a potential functional role for these RNA. This hypothesis is supported by studies in which Alu RNP exhibited broad range translational repression as measured by in vitro translation assays (Kondrashov et al. 2005; Häsler and Strub 2006; Ivanova et al. 2015). A mechanism for this inhibition has been proposed in which Alu RNAs mediate the binding of SRP9/14 to the 40S ribosomal subunit preventing 48S complex assembly (Berger et al. 2014).
While the function of the signal recognition particle in facilitating mRNA translation at the endoplasmic reticulum is well established, the role of Alu RNA in normal and diseased states is poorly understood (Walter and Blobel 1982; Gussakovsky and McKenna 2021). Alu elements are inherently difficult to study due to their prevalence, shared sequence, and similarity in length to the abundant 7SL RNA. While Alu elements can be transcribed by RNA polymerase III as discrete ∼300–400 nt RNAs, their ubiquity in the genome results in pervasiveness in the transcriptome as passengers in the introns, untranslated regions (UTRs) and, more rarely, within the coding regions of protein-coding mRNA transcripts (Roy et al. 2000; Dagan et al. 2004; Deininger 2011). Alu repeats are also incorporated within larger ncRNA transcripts (Gussakovsky and McKenna 2021). For these reasons, studying Alu transcripts on the individual level is plagued with difficulty in terms of establishing the specificity of the detection method and interfering with the transcripts without eliciting an abundance of off-target effects (Conti et al. 2015; Gussakovsky and McKenna 2021). Accumulation of Alu RNA and hypomethylation of Alu loci has been identified as a hallmark of several cancers of disparate origin (Tang et al. 2005; Cho et al. 2007; Daskalos et al. 2009; Xiang et al. 2010; Di Ruocco et al. 2018; Wang and Liang 2022). While minimal data are available regarding correlations with outcomes, transcribed Alu RNA can alter gene expression to drive cell cycle progression, promote epithelial-mesenchymal transition, and increase genomic instability (Daskalos et al. 2009; Di Ruocco et al. 2018; Cantarella et al. 2019).
Unlike BC200, most Alu elements are dimeric and consist of juxtaposed left and right arms separated by an adenosine-rich spacer generating transcripts of ∼300 nt. There are reports that Alu RNAs can be processed into small left-hand monomeric units termed small cytoplasmic Alu RNA (scAlu) (Chang and Maraia 1993; Maraia et al. 1993; Chang et al. 1996; Shaikh et al. 1997). These RNAs are heterogeneous in sequence and found to arise from multiple dimeric Alu loci (Maraia et al. 1993). Incubation of labeled in vitro transcribed dimeric Alu RNAs with HeLa cell nuclear extracts generated an additional band in northern blots corresponding to a uniform length of ∼120 nt, suggesting that these scAlu RNAs may arise from posttranscriptional processing events (Maraia et al. 1993). While the precise mechanism governing the generation of scAlu RNA is yet unknown, recent studies have suggested that Alu RNAs may act as self-cleaving ribozymes (Hernandez et al. 2020; Cheng et al. 2021). The scAlu RNAs studied to date are reported as distinct from BC200 (Maraia et al. 1993); however, the primers and probes used in these studies targeted a region in which BC200 demonstrates minimal sequence similarity to other Alu left monomers. As such, the contribution of BC200 to the pool of scAlu RNA remains unstudied.
Posttranscriptional processing of mRNAs as well as ncRNAs through splicing, editing, and other endo/exonuclease activity is a mechanism that greatly increases the diversity of the transcriptome (Mercer et al. 2010; Wilusz 2016; Pagès et al. 2018). For example, the nuclear lncRNA MALAT1 is processed by RNase P to yield a small cytoplasmic RNA referred to as mascRNA, which has a unique subcellular location and function compared to its full-length precursor RNA (Wilusz et al. 2008). Processed fragments of tRNAs are abundant, stable, and critical for cellular functions unrelated to protein translation (Lee et al. 2009). Deep sequencing has revealed a plethora of small noncoding RNAs (sncRNA) that are derived from larger precursors (Tuck and Tollervey 2011; Li et al. 2012; Chen and Heard 2013). While much work remains to be done, observed specific functional roles in addition to tissue and developmental stage-specific regulation, distinct expression patterns compared to precursor RNAs, and uniformity of 3′ and 5′ ends support the view that these RNAs are indeed functional and do not simply represent the degradation products of larger RNAs (Tuck and Tollervey 2011).
We investigated the unexpected observation of a truncated and stable form of BC200 consisting of the 120 nt Alu domain of the RNA (BC120). Our research demonstrates that this truncation is expressed endogenously in a variety of immortalized cell lines and is present in greater abundance than BC200 in several normal human tissues. Furthermore, both BC200 and BC120 are significantly elevated in primary ovarian cancer patient samples revealing that an aspect of BCYRN1 gene expression has been previously overlooked in correlative studies with disease prognosis. Sequencing of size-fractionated and linker-ligated RNA reveals a complete match to the BC200 sequence. PCR amplification using BC200 discriminating and generic Alu primers suggests that BC200 is the primary precursor of free Alu monomers in the cell lines and tissues analyzed. Overexpression of aptamer-tagged BC200 results in the appearance of aptamer-tagged BC120, confirming that the RNA is likely derived from the processing of the full-length transcript. We developed specific probe and qPCR-based assays for the detection and quantification of both full-length and truncated BC200 and determined that the truncated RNA is resistant to previously used BC200 targeting RNA interference strategies. As BC120 persists upon BC200 knockdown, and BC200 knockdown presents phenotypic impacts on cell viability and translation, we hypothesize that the truncated and full-length transcripts may be involved in distinct cellular functions. Combined knockdown of BC200 and BC120 exhibits a more robust phenotype than BC200 knockdown alone, suggestive of a critical role for the BC120 RNA. This is further supported by the observation that BC120 and BC200 exhibit distinct expression patterns in both normal human tissues and cancer cells and that BC120 negatively impacted translation to a greater degree than BC200 alone. This study, for the first time identifies BC120 as a functional, novel processed form of BC200, whose expression must be considered when studying the expression and function of the BCYRN1 gene.
RESULTS
BC200 overexpression coincides with the appearance of a ∼119 nt RNA
While generating stable BC200 expressing cell lines to evaluate BC200 cellular function, we observed a tendency for BC200 levels to diminish over extended passage of the antibiotic-resistant single-cell clones. To investigate this phenomenon, we used a 5′ targeting northern blot probe (complementary to BC200 nt 63–84) to determine if the RNA was being processed or degraded over time. This region was selected as our previously used qPCR primers and northern blot probes targeted the 3′ unique sequence of BC200 (nt 162–185) and could not detect any truncations lacking this region.
Using this 5′ probe, northern blots of cells transiently transfected with a BC200 expression plasmid demonstrated robust elevation of BC200 as well as the concomitant presence of two additional cross-reacting species over time (Fig. 1A, left panel). Endogenous BC200 in T-47D cells is not detectable at the exposure time used for the blot (Ctrl). Based on the primary sequence and proposed secondary structure of BC200, we speculated that the fastest migrating RNA corresponded to the free 5′ Alu domain (1–119 nt), and the faint intermediate RNA was a truncation either following the A-rich region (1–161 nt) or preceding the C-rich region (1–185 nt) (Fig. 1B). The higher molecular weight RNA that is also present in control cells is likely a cross-reaction with the 7SL RNA (300 nt) and/or other transcribed Alu repeats due to sequence similarity in the targeting region (Supplemental Fig. S1).
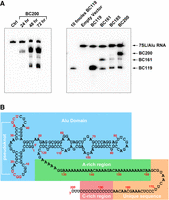
An ∼119 nt RNA is coexpressed with BC200. (A, left panel) T-47D cells were transfected with a plasmid containing a BC200 expression cassette or empty vector (Ctrl). RNA was extracted at the indicated time points. Northern blot was performed with 5 µg of total RNA with a probe complementary to BC200 nt 63–84. (Right panel) T-47D cells were transfected with plasmids containing expression cassettes for BC200 and the indicated truncations. All truncations begin with the first nucleotide of BC200 and are terminated by the insertion of four consecutive thymidines in the coding sequence after the indicated base. In total, 10 fmoles of in vitro transcribed BC119 serves as a size marker. Northern blot was performed with a probe complementary to BC200 nt 63–84. (B) Proposed secondary structure of the BC200 RNA.
To narrow down the approximate size of the migrating RNAs, a northern blot was performed with T-47D cells transiently transfected with expression constructs for BC200 and truncations consisting of the first 119, 161, and 185 nt of BC200 (referred to as BC119, BC161, and BC185). To serve as a size marker, in vitro transcribed RNA corresponding to the Alu domain (BC119) was run (10 fmoles BC119, Fig. 1A, right panel). As expected, transgene-expressed BC119 produced a single RNA that migrated consistent with the length of the in vitro transcribed BC119 (Fig. 1A, right panel). Overexpression of BC161 gave an RNA of similar molecular weight to the faint intermediate RNA observed upon BC200 overexpression and elevated the expression of BC119 relative to the empty vector control (Fig. 1A, right panel). The BC185 truncation appeared to be unstable as it was only faintly visible, but transfection of BC185 increased the levels of BC161 and BC119 to a similar extent as transfection of full-length BC200. Based on these data, we suspected that BC200 is posttranscriptionally processed into a stable ∼119 nt Alu monomer, possibly in two stages with a transitional species of ∼161 nt (Fig. 1B).
A ∼119 nt processed form of BC200 is observed in a broad spectrum of human cell lines and normal human tissue
As we initially identified the processing of BC200 to a ∼119 nt RNA in T-47D breast cancer cells, we sought to expand the study to a broader range of immortalized human cell lines to determine if the observation was consistent. Cells were transfected with a plasmid to coexpress both EGFP and BC200, and RNA was extracted 48 h posttransfection. Northern blots revealed highly variable expression levels of BC200 (Fig. 2A). BC200 expression did not correlate consistently with transfection efficiency (visual observation of GFP staining by fluorescent microscopy). For example, HeLa cells exhibited comparable transfection efficiency to HEK 293T but demonstrated markedly lower BC200 expression levels suggesting cell-type-dependent activity of the internal RNA polymerase III promoter. The abundance of BC119 relative to BC200 also varied ranging from <20% of the corresponding BC200 band intensity to >60% as measured by densitometry, which may represent cell-type-dependent processing rates (Supplemental Fig. S2A). To advance the biological relevance of this finding, we performed northern blots using RNA from untransfected cells to observe endogenous levels of BC200 and the truncated form (Supplemental Fig. S2B). Cross-reaction of these probes with other homologous RNAs (e.g., 7SL/Alu) was observed. To enhance specificity, we designed locked nucleic acid (LNA) probes targeting regions in which the BC200 sequence varied from the consensus sequences of Alu J, Alu Y, and Alu S repeats as well as the 7SL RNA (Fig. 2B; Supplemental Fig. S1). A probe targeting nt 33–52 of BC200 yielded substantially improved specificity allowing for northern blot analysis of endogenous BC200 and the ∼161 and 119 nt species (Fig. 2C). The probe targeting nt 33–52 does not demonstrate a bias between hybridization to either the 119 nt truncation or the full-length RNA (Supplemental Fig. S2C). The various probes tested hybridized to both BC200 and BC119 with similar efficiency as exemplified by the consistent relative intensities of the two bands (Supplemental Fig. S2D), demonstrating that while the probe targeting 33–52 exhibits the least cross-hybridization, they are all broadly suitable for relative quantification of all forms of BC200. In the panel of cell lines tested, ratios of BC119 to full-length BC200 were consistent with the overexpression study, with MCF-7 and A549 cells demonstrating the highest relative levels of the ∼119 nt truncation (Fig. 2C).
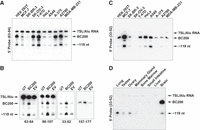
The BC200 truncation is expressed in a broad spectrum of immortalized cell lines and normal human tissue. (A) Indicated cell lines were transfected with a plasmid containing a BC200 expression cassette. After 48 h, 5 µg of RNA from the indicated cells was used for northern blot with a probe targeting BC200 nt 63–84. (B) A series of BC200 targeting LNA oligonucleotide probes were assessed for specificity using MCF-7 cells that were untransfected (UT), transfected with a BC200 expression plasmid (BC200) or empty vector (EV). Targeted region of BC200 is indicated below each blot. (C) Endogenous BC200 was assessed by northern blot using 5 µg total RNA collected 48 h after plating. (D) Two micrograms of total RNA from the indicated normal human tissues was northern blotted with a probe targeting BC200 nt 33–52. In the case of Brain, 500 ng total RNA was loaded to balance the signal intensity.
BC200 is reported to be a brain-specific transcript with low-level expression also observed in germ cells (Watson and Sutcliffe 1987; Tiedge et al. 1993; Skryabin et al. 1998). We sought to determine if the expression of BC119 correlates with BC200 in normal human tissues. RNA from a panel of normal tissues was used for northern blotting. The BC200 specific 5′ probe targeting nt 33–52 detected the processed form of the RNA in normal lung, testis, ovary, mammary gland, small intestine, and brain (Fig. 2D; Supplemental Fig. S3). In this assay, fourfold less RNA was loaded from brain compared to the other tissues to prevent over-saturation of the signal. In the brain, the 119 nt fragment was a minor species as compared to full-length BC200; however, in the lung, testis, ovary, and mammary gland, the processed form was the dominant RNA observed.
To confirm that the northern blot signal in normal human tissues lacking BC200 was specific to the ∼119 nt truncation, we also assessed BC200 expression using a qPCR primer/probe set that would detect both BC200 and the processed Alu domain fragment. To validate these primers, MCF-7 cell RNA was size-separated by denaturing PAGE, and RNA from purified fractions was used as a template for qPCR using Taqman primer/probe sets that spanned the length of the BC200 RNA or were confined to the Alu domain (Supplemental Fig. S4A–C). To further establish the specificity of the BC200 Alu domain qPCR primers, standard curves were generated using in vitro transcribed and purified BC119, BC200, Alu J consensus sequence, and 7SL RNA (Supplemental Fig. S4D,E). These primer sets were then tested on total RNA from the normal human tissues confirming the northern blot findings, where significant expression of the processed form was observed in tissues with comparably low levels of BC200 (Supplemental Fig. S4F).
The processed form of BC200 has an average length of 120 nt
To confirm the lengths and sequences of the observed ∼119 nt truncation, RNA extracted from MCF-7 cells was size-fractionated (Supplemental Fig. S5A), and a DNA linker was ligated to the RNA 3′ ends postfractionation. The ligated linker sequence was used to establish the 3′ end of the sequenced RNAs and to prime reverse transcription for cDNA synthesis. We used the previously published “modban” oligonucleotide with the addition of a single adenosine at the 5′ end to increase the melting temperature of the reverse primer and enhance subsequent PCR specificity (Lau et al. 2001; Song et al. 2014). A forward primer was designed at the 5′ end of the BC200 RNA (nt 12–29) that would not discriminate against published Alu consensus sequences but did contain mismatches with the 7SL RNA (Supplemental Fig. S5B). This primer allowed for an estimation of the relative abundance of the BC200 truncation to other ∼120 nt Alu sequences. Size-fractionated and linker-ligated RNA was amplified by PCR, gel purified, and blunt end cloned into the pJet1.2 vector (Supplemental Fig. S5C,D). As BC200 expression is abundant in the brain, we also repeated the sequencing with RNA from normal brain tissue as well. Sequencing was also performed on amplified cDNA from other ∼300 nt dimeric Alus, BC200, and the ∼161 nt RNA.
Of the initial clones amplified with the generic Alu primer (nt 12–29), approximately half of the clones from both MCF-7 and brain matched the BC200 Alu domain with the remaining clones corresponding to other diverse transcribed Alu repeats. To exclude these other Alu sequences, a BC200 specific forward primer (nt 33–52) was subsequently used in a separate independent experiment to amplify and sequence additional cDNA clones. The majority of sequences from normal brain tissue terminated at nt 118 but exhibited 3′ end modifications, most frequently the addition of two additional uridines (Fig. 3A,B). Clones from MCF-7 RNA yielded a range of transcripts, primarily terminating between nt 117 and 125 with the most frequent transcript terminating at nt 119. Unlike the sequences derived from brain, most clones from MCF-7 cells did not exhibit the addition of nucleotides to the 3′ end. As the mean length of clones derived from MCF-7 cells was 120 nt long and as the most common sequence derived from brain consisted of termination at 118 with the addition of two uridines, we hereafter refer to the truncated form of BC200 as BC120 (Fig. 3C). Clones sequenced from ∼300 nt fraction consisted of heterogeneous transcribed Alu sequences of ∼320 nt in length. All clones from the BC200 fraction aligned to full-length BC200; however, heterogeneity of homopolymeric repeats within the A-rich region was observed as previously published (Shin et al. 2019). We also evaluated BC161 clones, and these aligned to BC200 with variable 3′ ends between nucleotides (nt) 157 and 162.
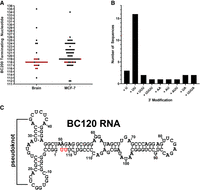
Sequence analysis of the BC200 truncation. (A) Summary of sequencing of ∼120 nt clones from both total brain RNA and MCF-7 cell RNA. Each dot represents an individual sequence with terminating nucleotide indicated on the y-axis. Red dots indicate sequences that exhibit a 3′ end modification. (B) Bar graph representing the observed 3′ end modifications on the x-axis and the frequency indicated on the y-axis for both brain and MCF-7 RNA. (C) Schematic of the most frequently observed BC200 truncation in normal brain RNA. Terminal uridines not coded for in the BCYRN1 gene are highlighted in red.
Insertion of the Mango-II aptamer into BC200 results in expression of aptamer-tagged BC120
While sequencing of BC120 revealed a perfect match to the BC200 Alu domain, identical sequence to the Alu domain of BC200 is found in Alu insertions in four distinct regions of the genome. To confirm the RNA observed is derived from BC200, we used an aptamer-tagged BC200 expression construct. BC200 was expressed with the Mango-II aptamer inserted at position 83 (Fig. 4A; Panchapakesan et al. 2015). If the transgene is the source of the 120 nt RNA, we expect a product of 162 nt corresponding to BC120 with the additional 42 nt of aptamer sequence as well as a transitional species of 203 nt corresponding to 42 nt added to BC161. RNA extracted from T47-D cells overexpressing the BC200-Mango construct as well as a control RNA (F30-Mango-II, 92 nt) was separated by denaturing urea-PAGE and stained with TO1-biotin, which fluoresces when bound to the Mango-II aptamer (Fig. 4B; Trachman et al. 2017). When the Mango-II aptamer was present, a larger full-length RNA (expected size 242 nt) was observed along with a second band corresponding to an aptamer insertion in the BC200 Alu domain (expected size 162 nt) confirming incorporation and correct folding of the aptamer. Northern blots were subsequently performed and confirmed that a larger processed form of BC200 was observed when the aptamer is inserted within the Alu domain (Fig. 4C), further reinforcing the data observed by in-gel TO1-biotin staining.
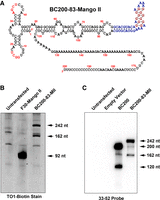
Insertion of the Mango-II aptamer into BC200 results in the expression of aptamer-tagged BC120. (A) Primary sequence and predicted secondary structure of BC200 with the Mango-II aptamer inserted following nt 83. (B) Cells were transfected with plasmids to express the indicated RNAs. Total RNA was extracted 48 h posttransfection and separated by denaturing TBE Urea-PAGE. Gel was stained with TO1-biotin and imaged using the cy2 excitation and emission filters on a Fluorchem Q imaging system. Arrows indicate the expected lengths of the expressed RNAs. Additional faint bands also present in the untransfected lane are due to nonspecific binding of TO1-biotin. (C) Northern blot of cells transfected with empty vector, BC200 or BC200 containing the Mango-II aptamer with a probe targeting BC200 nt 33–52.
Characterization of the BC120 RNA
To determine whether the BC120 RNA was merely a transient degradation product of BC200 or a potentially functional variant of the transcript, we investigated the half-life of both BC200 and BC120 in T-47D cells. RNA transcription was halted with the RNA polymerase III inhibitor actinomycin D followed by monitoring BC200 and BC120 levels by northern blot for 12 h. While BC200 levels were reduced by more than 90%, BC120 expression remained relatively unchanged over the course of the experiment (Fig. 5A,B). The data support the notion that BC120 is a functional transcript and not a transient degradation product.
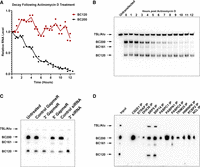
BC120 is stable and resistant to BC200 targeted RNAi. (A) T-47D cells were transfected with a BC200 expression plasmid. Forty-eight hours posttransfection, cells were treated with Actinomycin D to arrest transcription. Cells were harvested at the indicated time points posttreatment with Actinomycin D and BC200, and BC120 expression was monitored by northern blot with a probe targeting BC200 nt 63–84. Each RNA was quantified by densitometry relative to the 0 h time point. Data represent individual data points from three replicate samples with connecting line through the mean. (B) Representative northern blot used to generate the data shown in (A). (C) MCF-7 cells were transfected with LNA GapmeRs targeting the 5′ and 3′ ends of the BC200 RNA as well as a 3′ targeting siRNA and the indicated controls. Forty-eight hours posttransfection, cells were harvested, and total RNA extracted to perform northern blot with a probe targeting BC200 33–52. (D) Northern blot of RNA coimmunoprecipitated with antibodies to the indicated BC200-binding proteins using a probe complimentary to BC200 nt 33–52.
Knockdown of BC200 reduces cell viability and induces apoptosis in cancer cell lines (Booy et al. 2017). As BC120 exhibits greater stability than BC200 and does not contain the region targeted by RNA interference, we next assessed whether BC120 expression also persisted upon knockdown of BC200. RNAi approaches used in previously published work targeted the 3′ end of BC200 and therefore would not directly interfere with BC120 (Booy et al. 2017). Knockdown of BC200 using LNA GapmeRs or siRNAs targeting the unique 3′ sequence (nt 157–177) did not appreciably reduce BC120 levels as far out as 72 h post-RNAi transfection (Fig. 5C). To impact BC120 directly, we tested a 5′ LNA GapmeR targeting the Alu domain (nt 67–81), which resulted in a modest reduction of both BC200 and BC120 (Fig. 5C, 5′ GapmeR).
BC200 interacts with several RNA-binding proteins via the 3′ A-rich and C-rich sequences, including CSDE1, PABPN1, and PCBP2. To further characterize BC120, we investigated whether the truncated RNA shared any of the previously identified protein-binding partners of BC200 (Booy et al. 2016, 2018). Immunoprecipitation samples of BC200-binding proteins were re-analyzed by northern blot using a probe that detected both BC200 and BC120. Of the 12 BC200-binding proteins tested, the only proteins that also bound BC120 were the SRP9/14 heterodimer (Fig. 5D). As we have previously observed with BC200, knockdown of SRP14 also results in loss of BC120 expression (Supplemental Fig. S6; Gussakovsky et al. 2023).
We observed that the ratio of BC120 to BC200 was variable and dependent on time postpassaging of cultured cells. To investigate this in detail, we monitored BC200 and BC120 expression by northern blot 24, 48, and 72 h after subculturing cells. The expression of BC200 was reduced upon prolonged cell culture, and BC120 declined over time in a similar fashion (Fig. 6A). As time in culture did not account for the variation observed, we next investigated if the BC120:BC200 ratio was cell density-dependent. When MCF-7 cells were plated at variable cell densities for 72 h, increased cell density profoundly reduced BC200 levels but had minimal impact on BC120 (Fig. 6A), thus greatly increasing the relative abundance of BC120 to BC200 (Fig. 6B). The two highest plating densities resulted in 100% confluence by 72 h. Therefore, at low cell densities, BC200 is dominant, whereas at higher cell densities, the expression of BC120 and BC200 is similar due to decreased expression of BC200 alongside stable expression of BC120.
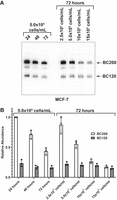
BC200 expression is reduced at high cell density. (A) MCF-7 cells were plated at the indicated cell densities and collected at the indicated times before total RNA extraction. Five micrograms of total RNA was separated by denaturing TBE-urea PAGE, and northern blot performed with a probe targeting BC200 nt 33–52. Blot is representative of three replicate samples. (B) Band intensities in (A) were quantified by densitometry and plotted relative to the 24 h sample. Data represent the mean of three replicates +/− SD.
Development of a BC120-specific RT-qPCR assay
While comparing BC200 primer sets spanning the full-length RNA and restricted to the Alu domain allowed for some insight in determining the relative expression of both forms of the RNA, the variable amplification efficiency of both primer sets and an observed template bias toward BC200 obfuscates the interpretation of samples expressing both forms of the RNA. As northern blotting is low throughput and requires large quantities of RNA, we developed a rapid and accurate qPCR-based method to assess BC120 expression. To this end, we used a linker ligation-based qPCR assay combined with a template-blocking LNA probe. LNA oligonucleotides have recently been shown to effectively inhibit PCR reactions (Prout et al. 2023). We had previously observed that 5′ and 3′ DIG-labeled LNA probes significantly inhibited primer extension, resisted polymerase exonuclease activity, and could not serve as primers likely due to steric hindrance of the bulky digoxigenin label. We therefore used an LNA probe that binds to the unique region in the 3′ end of BC200 to block the amplification of the full-length RNA (Fig. 7A). To test the efficacy of this method, linker ligation was performed on total RNA extracted from MCF-7 cells. Amplification was then performed using a forward primer within the Alu domain of BC200 combined with a quenched fluorescent probe and a reverse primer complementary to the linker sequence (Fig. 7A), in the presence and absence of the blocking LNA probe. As expected, the LNA probe inhibited amplification of the BC200 population in RNA from MCF-7 cells by ∼70%, consistent with the relative proportion of BC120–BC200 in these cells (Fig. 7B). Agarose gel electrophoresis of the amplification products revealed amplicons corresponding to full-length BC200 and BC120 (expected size 186 and 138 nt) in the absence of the blocking LNA and only an amplicon for BC120 in the presence of the LNA (Fig. 7C). The LNA probe had no impact on amplification of in vitro transcribed, linker-ligated BC120 but blocked amplification of in vitro transcribed linker-ligated BC200 (Fig. 7C). The method was further refined by increasing RNA ligation reaction temperatures to 37°C which overcame an observed ligation bias toward full-length BC200 presumably due to RNA secondary structures present in the 3′ end of BC120 (Supplemental Figs. S7 and S8). Optimized ligation conditions were then used to assess BC120 expression in the previously used panel of normal human tissues (Fig. 7D). Quantification was performed by preparing a standard curve using in vitro transcribed BC120 ligated in the same manner. Using this approach, the calculated BC120 copy number agreed well with relative band intensities as observed by northern blot (Figs. 7D and 2D).
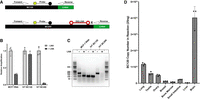
Development of a BC120-specific RT-qPCR assay. (A) Schematic outlining the primer, probe, and blocking LNA-binding sites on the BC120 and BC200 RNA linker-ligated templates. (B) Twenty-five nanograms of ligated MCF-7 RNA was used as a template for RT-qPCR using the primer/probe sets shown in (A) in the presence and absence of the blocking DIG-labeled LNA. In parallel, purified in vitro transcribed (IVT) BC120 and BC200 were also used as RT-qPCR templates. Data are relative to the untreated (no LNA) reactions and represent the mean of four replicates +/− SD. (C) Amplification products from (B) were separated by agarose gel electrophoresis and stained with SYBR Safe nucleic acid dye. (D) Absolute quantification of BC120 expression in ligated RNA from the indicated human tissues using T4 RNA ligase at a temperature of 37°C. Quantification was performed using a standard curve generated with serial dilutions of linker-ligated in vitro transcribed BC120 RNA and represents the mean of three replicates +/− SD.
Impact of BC120 knockdown and overexpression
Previous work has demonstrated that BC200 knockdown negatively impacts cancer cell proliferation and viability (Booy et al. 2017; Samson et al. 2018; Tan et al. 2020; Ghafouri-Fard et al. 2021). To gain further insight into the relevance of BC120 in this regard, we sought to determine whether BC120 knockdown has a similar phenotype. To this end, we designed and tested three LNA GapmeRs targeting the region in which specific detection was achieved with northern blot probes (Fig. 2B, nt 33–52). As this probe did not detect any other RNAs by northern blot (with the exception of trace signal for 7SL, Fig. 2C), we anticipated minimal off-target effects. A GapmeR targeting nt 38–53 was able to significantly reduce both BC200 and BC120 while not exhibiting off-target effects on the 7SL RNA as measured by both northern blot and qPCR (Fig. 8A,B). This 16 nt targeting region contains six mismatches with both the 7SL RNA and the major Alu family consensus sequences. Following LNA GapmeR transfection, cell growth was monitored by cell counting every 24 h over the course of 4 days. Both the 3′ targeting GapmeR (159–174) and the Alu domain targeting GapmeR (38–53) arrested cell growth, whereas a nontargeting control had no discernible impact compared to untreated cells (Fig. 8C). In parallel, total cell death was monitored by assessing membrane permeability with the fluorescent DNA stain 4′,6-diamidino-2-phenylindole (DAPI). With BC200 knockdown alone (159–174 GapmeR), cell death was not observed until the 72 h time point, whereas knockdown of both BC120 and BC200 with the Alu targeting GapmeR resulted in significant cell death within 24 h (Fig. 8D). Time-course analyses demonstrated that the GapmeRs targeting 36–51 and 37–52 were less effective at reducing the expression of both BC200 and BC120 (Supplemental Fig. S9A–D). These GapmeRs also demonstrated a muted phenotypic impact on both cell growth inhibition and induction of cell death (Supplemental Fig. 9E,F).
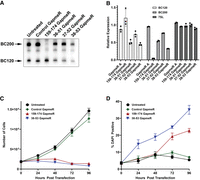
Knockdown of BC120 and BC200 with Alu domain targeting LNA GapmeRs. (A) MCF-7 cells were transfected with the indicated LNA GapmeRs. After 48 h, total RNA was extracted for northern blot with a probe targeting nt 33–52. (B) Twenty-five nanograms of RNA from the samples in (A) was used as a template for RT-qPCR with primer/probe sets to quantify expression of BC120, BC200, and 7SL. Data are relative to the untreated cells and represent the mean of three replicates +/− SD. (C) MCF-7 cells were transfected as in (A) and counted at the indicated time points. Data represent the calculated total number of cells in each well and is the mean of four wells per condition +/− SD. (D) As in (A), to the same samples a cell impermeable viability dye (DAPI) was added to each sample, and the proportion of DAPI positive cells was measured at each time point for each condition. Data represent the mean of four wells per condition +/− SD.
To assess whether BC120 has an impact on translation, MCF-7 cells were transfected with GFP reporter constructs that coexpressed BC200, BC120, BC161, and BC185 (Supplemental Fig. 10). Data from each independent experiment were relative to the GFP reporter alone, and statistical comparisons were made against a control GFP reporter plasmid containing another RNA polymerase III transcript, TRS-GCT4-1 (tRNA-Ser anticodon GCT). BC161 and BC185 were included as they are primarily processed to generate BC120 (Fig. 1A). These RNAs could therefore serve as a means of overexpressing processed BC120 without elevating BC200. This was performed as overexpressed BC120 exhibits a discernible shift in subcellular localization as compared to the form derived from the full-length RNA. In subcellular fractionation experiments, we observed elevated detection of the RNA in nuclear and chromatin-bound fractions, which we anticipated may impact the experimental results (Supplemental Fig. S11). GFP expression was monitored by quantifying fluorescence of total cell extracts normalized for total protein content. Data are expressed relative to GFP mRNA levels to correct for any deviations in transfection efficiency or transcription rates. An oligo(dT) reverse primer was used for GFP mRNA quantification to prevent the amplification of trace plasmid contaminants that persisted after DNase treatment of the purified RNA. While BC200 expression did not impact GFP translation rates, BC120, BC161, and BC185 all exhibited a 20%–30% reduction (Fig. 9A). Expression of the various RNAs was monitored by northern blot (Fig. 9B).
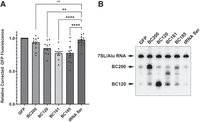
BC120 overexpression negatively regulates the translation of a GFP reporter. (A) MCF-7 cells were transfected with a GFP reporter plasmid that contained an expression cassette for the various indicated RNAs. Twenty-four hours posttransfection, cells were harvested, and total cell extracts were collected and normalized for total protein content. GFP was quantified by fluorescence measurements of 20 µL cell lysate in a 96-well plate. Data represent the mean of 12 replicates +/− standard error. Statistical significance was assessed by performing a one-way ANOVA followed by Dunnett's multiple comparison test (GraphPad Prism software). (B) Total RNA extracted from a set of samples used in (A) was separated by denaturing TBE gel electrophoresis, and northern blot was performed with a probe targeting BC200 nt 33–52.
BC120 is elevated in high-grade serous carcinoma
As a reliable method for quantifying BC120 was now available, we were interested to determine if, like BC200, BC120 is also elevated in the context of cancer patient samples. Analysis of The Cancer Genome Atlas (TCGA) data using the GEPIA webserver (Tang et al. 2017) revealed that BC200 is highly overexpressed in epithelial ovarian cancer (Supplemental Fig. S12A). We therefore analyzed both BC200 and BC120 expression in a panel of ascites derived tubo-ovarian high-grade serous carcinoma (HGSC) patient samples (EOC#) provided by the Manitoba Ovarian Biobank Program. In parallel, we also assessed BC200 and BC120 expression in immortalized HGSC cell lines (PEO1/4/6 and CaOV3). As fallopian tube epithelium and ovarian surface epithelium are both considered a potential origin of HGSC (Zhang et al. 2019), in parallel we assessed expression in two immortalized normal fallopian tube secretory epithelial cell lines (FT194 and FT246) and RNA from normal human ovary (Fig. 10A). To confirm the specificity of the PCR, a panel of samples were also assessed by northern blot (Fig. 10B). Although sample quantity limitations necessitated extended exposure time, the northern blot data were generally in good agreement with the qPCR-based approach increasing confidence in the method. Both BC200 and BC120 were highly elevated relative to RNA from normal ovary as well as the immortalized normal fallopian tube cell lines; however, elevated BC200 was observed in the FT246 immortalized fallopian tube cells, which may be a consequence of CDK4-R24C expression in these particular cells (Lepage et al. 2021). BC200 and BC120 expression were also assessed in RNA samples from four cancer types acquired from BioChain (Newark, CA). While BC200 was elevated in the lung cancer sample, BC120 expression was similar to or lower than levels observed in normal human tissues (Supplemental Fig. S12B). While more extensive analyses will be necessary to determine if BC120 expression is prevalent in other cancer types, initial data obtained in HGSC warrants an expanded investigation into the specific function of BC120 and any correlation it may have with patient outcomes.
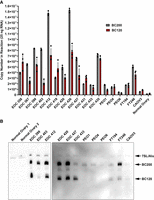
Analysis of BC120 expression in tubo-ovarian HGSC. (A) Twenty-five nanograms of RNA from the indicated samples was used as a template for RT-qPCR using a full-length Taqman primer set for BC200 and the optimized qPCR assay for BC120. Data represent the mean of three replicates for BC200 and four replicates for BC120 +/− SD. EOC ### samples are ovarian cancer samples derived from the ascites fluid of individual patients. PEO1, PEO4, and PEO6 are HGSC cell lines derived from a single patient. FT194 and FT246 are immortalized fallopian tube secretory epithelial cells, and CAOV3 is an HGSC cell line. (B) Northern blot of samples used in (A) for which sufficient RNA quantity was available using a probe complementary to nt 33–52 of the BC200 RNA. In the left panel, 2 µg of RNA was loaded for each sample, and in the right panel, 750 ng of RNA was loaded for each sample due to sample quantity limitations.
DISCUSSION
The BCYRN1 gene is well established as generating a brain-specific transcript of 200 nt that is comparatively absent from other normal human tissues (Martignetti and Brosius 1993). Herein we describe a novel and stable BC200 truncation that is present in both the brain and several other normal human tissues that do not express significant levels of the full-length RNA. This revelation necessitates a reanalysis of the potential roles for BC200 in other tissues and must be taken into consideration for future studies of this ncRNA. In addition to normal expression in the primate brain, BC200 is elevated in a broad spectrum of cancer types and can serve as a prognostic indicator (Ghafouri-Fard et al. 2021). We have also observed BC120 in cancer-derived cell lines, highlighting the need to consider both forms of the RNA in establishing correlative outcomes with BCYRN1 gene expression in cancer. In this study, we confirm that both BC200 and BC120 are substantially elevated in HGSC. Future work using larger data sets will be necessary to determine if BC120 expression is correlated with disease outcome. As the BC120 sequence maps to multiple genomic loci and consists solely of Alu repetitive element sequence, this transcript is likely to be filtered out in most RNA-seq data sets (Treangen and Salzberg 2011; Jin and Hammell 2018). Furthermore, in addition to ambiguous mapping, error rates of most next-generation sequencing platforms would expand the number of genetic loci to which the transcript may be mistakenly mapped (Cheng et al. 2023). Therefore, until now, the expression of BC120 has remained unreported.
Sequencing of size-fractionated transcripts confirmed a perfect match of the 120 nt RNA to the BC200 sequence; however, the length of the RNA exhibited some degree of variability. While the majority of clones in brain corresponded to termination at nt 118 with the addition of two uridines, a range of sequences were identified in MCF-7 breast cancer cells. It is possible that incompletely processed transcripts were preferentially sequenced in MCF-7 cells as the RNA ligase used can exhibit structural and sequence-based biases (Jayaprakash et al. 2011; Zhuang et al. 2012). Supporting this, we have previously observed that BC200 truncations that lack a single-stranded 3′ end are less efficient ligation substrates (Booy et al. 2018). Actively dividing MCF-7 cells may therefore possess fewer mature transcripts, and intermediates may have been preferentially ligated. Furthermore, we observed that amplification of BC120 by PCR using a reverse primer that binds the ligated linker required elevated amplification temperatures. This suggests that the secondary structure at the 3′ end of the RNA may inhibit both RNA ligation and PCR amplification of the ligated RNA. Ligation biases were ameliorated to some degree by elevating ligation temperature. Regardless, the most frequent sequence observed in MCF-7 cells was termination at nt 119 and only a small number of sequences exhibited the 3′ modification pattern observed in brain. It is possible that MCF-7 cells do not express the terminal uridylyl transferases required for maturation of the truncated RNA (Zigáčková and Vaňáčová 2018). 3′ end uridylation may impact RNA stability and localization. It is possible that uridylation in brain targets the truncated form for degradation, which would explain the observed low expression of BC120 relative to BC200.
Amplification of ligated RNA with a forward primer designed to indiscriminately amplify both BC200 and Alu sequences demonstrated that in both brain and MCF-7 cells BC120 is the most frequent transcript observed. Other sequenced transcripts were heterogeneous Alu sequences scattered throughout the genome that were not annotated transcripts. Regardless, the majority of the ∼120 nt RNA detected by northern blot is derived from BC200 and is not other scAlu transcripts as relative band intensity to BC200 was not substantially changed using detection probes of various stringency. While we cannot rule out the possibility that some portion of the detected BC120 is expressed from other loci that harbor identical sequence, we have demonstrated quite conclusively that BC120 can indeed be derived from BC200 making it the most likely source of the truncation. As the less discriminating primer within the 5′ end of BC200 coamplified a variety of unannotated monomeric and dimeric Alu RNAs, it is evident that the expression profile of these transcripts is complex warranting further investigation. Future functional studies of BC120 and BC200 will need to be considered within the context of a diverse array of other transcribed Alu repeats that may provide redundancy within the cell.
In addition to BC120, we observed a less prominent RNA of ∼161 nt that correlated with BC200 overexpression. Sequencing of this RNA demonstrated variable lengths, consistent with the notion that the RNA is an intermediate that is further trimmed to form the ∼120 nt truncation. Overexpression of a BC200 truncation (BC185) lacking the 12 consecutive 3′ cytosines resulted in an elevation of the 161 nt RNA as well as BC120 despite minimal expression of BC185 observed. This indicates that the terminal C-rich region of the RNA may confer some stability to the full-length transcript. We have previously reported two RNA-binding proteins (PCBP2 and HNRNPK) that interact with the C-rich domain of BC200, both of which have been implicated in RNA processing and stability (Kong et al. 2003; Palusa et al. 2012; Booy et al. 2018; Wang et al. 2020). The poly(C) tract and associated proteins likely play a critical role in stabilizing BC200 and regulating the mechanisms involved in processing and forming BC120. It is unsurprising therefore that we found a similar phenotype for the overexpression of either BC120, BC161, or BC185 all of which generate the same 120 nt transcript.
Based on sequence similarity, the higher molecular weight RNA observed in the northern blots was inferred to consist of the 7SL RNA as well as other transcribed Alu element dimers. qPCR with 7SL-specific primers confirmed the presence of 7SL. Amplification of this fraction with the universal Alu forward primer and 3′ linker reverse primer yielded minimal product, suggesting that, relative to BC200, other dimeric Alu elements are scarce in MCF-7 cells. The clones obtained from this fraction corresponded to eight distinct and unique Alu RNAs. These transcripts also appeared to have their 3′ ends processed as the 3′ ends did not consistently match a genomic location containing an RNA polymerase III termination signal (Nielsen et al. 2013). It is possible that the same mechanism generating relatively uniform ends of these transcribed Alu sequences is also involved in processing BC200 to remove the terminal non-Alu domain nucleotides.
BC200 and BC120 were detected in all cell lines analyzed; however, the abundance and relative ratios between the two were variable. A549 cells consistently demonstrated the highest expression of BC120 as compared to BC200. Cell-type-specific processing rates may be an important tool for elucidating the mechanisms governing BC200 processing and probing the function of this novel RNA. The variability in expression was also observed in normal tissues and HGSC patient samples. Expansion of the current work to assess a larger patient cohort and investigate correlations between BC200, BC120 and disease outcome will further our understanding of the impact of BCYRN1 gene expression in cancerous cells.
Our initial findings were largely based on northern blot detection of BC120, and the probe sequence was refined such that it demonstrated improved specificity relative to 7SL and other Alu sequences. We also designed a qPCR primer/probe set within the 5′ end of the RNA that could distinguish BC200 and BC120 from other Alu sequences and the 7SL RNA. The BC200 Alu qPCR primer/probe set demonstrated preferential amplification of BC200 as compared to BC120. This may explain inconsistencies between the northern blot lane profile and qPCR data from the separated fractions, likely due to the innate ability of full-length BC200 to efficiently prime its own reverse transcription (Shen et al. 1997). As BC200 and BC120 are amplified with differing efficiencies, deconvoluting the qPCR data from a mixed population of RNAs is necessary for accurate quantification of each form of the RNA. The use of a BC200 blocking LNA oligonucleotide allowed for accurate assessment of BC120 expression that agreed well with northern blot analysis. BCYRN1 gene expression can therefore be accurately assessed by combining detection of BC200 by standard qPCR methodology using the unique sequence at the 3′ end as a template for the reverse primer and the herein described ligation-based assay for BC120. It is important to note that the method does not discriminate against the ∼161 nt RNA and therefore represents the sum of BC120 and any intermediates that lack the LNA targeting sequence.
BC120 exhibits a much longer half-life than BC200, which could in part be explained by the conversion of BC200 to BC120 following transcription arrest; however, BC120 also persists following transfection of BC200 3′ targeted RNAi, suggesting that it is indeed more stable than BC200. Stability of the RNA is likely conferred by folding into a stable structure and binding by the SRP9/14 heterodimer. As the cells begin to undergo apoptosis 72 h post-BC200 knockdown (Booy et al. 2017), we could not assess whether prolonged exposure to BC200 targeting RNAi would eventually reduce BC120 as well. Additionally, as transcription is not impeded by the RNA interference, the BC200 transcripts that are being digested by RNAse H may still contribute to the pool of BC120 in the cell. The relatively stable expression of BC120 may be explained by a feedback mechanism in the cell that maintains a steady state expression level. 5′ targeting GapmeRs exhibited less efficient knockdown of BC120 and BC200 expression. This was not unexpected because, unlike BC200, BC120 is almost entirely structured and double-stranded rendering the sequence less accessible to targeting oligonucleotides (Booy et al. 2016). Nevertheless, an Alu domain GapmeR targeting nt 38–53 was reasonably effective and exhibited minimal off-target effects. As targeting of both BC120 and BC200 induced cell death much more rapidly than targeting of BC200 alone it is suggestive that the processed form of the RNA is playing a key cellular function. Reduced expression of both BC200 and BC120 is observed upon knockdown of the SRP9/14 heterodimer, likely due to a combination of repressed transcription and reduced RNA stability (Gussakovsky et al. 2023).
We and others have implicated BC200 as a translational regulator (Kondrashov et al. 2005; Eom et al. 2011; Berger et al. 2014; Ivanova et al. 2015; Jang et al. 2017, 2020; Booy et al. 2021). Interestingly, in reporter assay experiments, BC120 generating constructs inhibited GFP mRNA translation more effectively than full-length BC200. This raises the possibility that BC200 and BC120 may possess opposing functions, and it is only when the relative abundance of BC120 is elevated that a translation inhibitory phenotype is observed. It is also possible that both RNAs regulate a subset of transcripts. In addition, we did not observe a similar elevation in translation as was previously observed in stable BC200 overexpression clones (Booy et al. 2021). This is possibly due to substantial differences in expression levels between stable clones and transiently transfected cells, cellular toxicity of transient transfection, or possibly a selection artifact present when selecting single cell stable clones. As such, regulated overexpression systems may be the preferred approach for future analyses of BC200 and BC120 function. Furthermore, we cannot rule out an impact on GFP protein decay, and therefore more refined translation assays are warranted to fully elucidate BC120 function. Results from Ivanova et al. (2015) have demonstrated that left-hand Alu monomers can inhibit translation through delivery of SRP9/14 to the 40S ribosomal subunit . As SRP9/14 are the only BC200-binding partners that also interact with BC120, our work agrees well with the proposed mechanism of translational inhibition. It is possible that this function is specific to BC120, and the additional sequence and protein-binding partners of BC200 prevent delivery of SRP9/14 to ribosomal subunits. Whether this is a common feature of all monomeric and dimeric Alu RNAs remains to be determined. These results highlight the need to consider processed forms of other expressed Alu RNAs (i.e., scAlus) when investigating expression and function. Further work is necessary to investigate if BC200, BC120, and other Alu RNAs negatively regulate translation initiation globally, or if regulation is confined to a subset of transcripts that may be unique to specific expressed Alu RNAs.
In summary, we have identified a novel truncated form of BC200 that exhibits stable, regulated, and tissue-specific expression. These characteristics suggest that it is not merely a transient degradation product but likely performs an undefined function within the cell. Therefore, the presence of this RNA must be considered when evaluating BC200 expression and function and establishing correlative outcomes in disease states. Further work is needed to establish both the mechanism by which BC120 is generated from BC200 and ascertain the functional implications of this novel transcript. This observation highlights the importance of using multiple detection methods when studying RNA molecules to avoid overlooking biologically relevant transcript variants or processing events. We are hopeful that the developed detection methodology to distinguish BC120 may serve as a basis for designs of other challenging sequences.
MATERIALS AND METHODS
Cell culture and reagents
The HEK293T cell line was a gift from Dr. Thomas Klonisch; the MCF-7, SK-BR-3, T-47D, A549, and MDA-MB-231 cell lines were a gift from Dr. Spencer Gibson; the SK-OV-3 cell line was a gift from Dr. Peter Pelka; the A375 cell line was a gift from Dr. Jens Kurreck. The A2780 cell line was a gift from Benjamin Tsang (University of Ottawa). Cell culture conditions were as previously published (Booy et al. 2016). The CaOV3 (RRID:CVCL_0201) cell line was cultured from frozen stocks obtained from ATCC (American Type Culture Collection) and frozen stocks made after the first passage. Similarly, PEO1 (RRID:CVCL_2686), PEO4 (RRID:CVCL_2690), and PEO6 (RRID:CVCL_2691) cell lines were cultured from frozen stocks obtained from the European Collection of Authenticated Cell Cultures (UK Health Security). All experiments were conducted with cells thawed from frozen stocks. FT194 (human TERT, SV40 large T antigen) and FT246 (human TERT, TP53-shRNA, human CDK4.R24C overexpression) fallopian tube secretory epithelial cell lines were generously provided by Dr. R. Drapkin (University of Pennsylvania, USA). FT cells were cultured as described by Lepage et al. (2021). Primary tubo-ovarian, HGSC cells were isolated and cultured as previously described (Shepherd et al. 2006). Cell counting and fluorescent viability assays were performed with a Countess II automated cell counter (Thermo Fisher Scientific).
DNA primers and locked nucleic acid (LNA) GapmeRs were purchased from Integrated DNA Technologies. T4 RNA ligase, thermostable 5′ App DNA/RNA ligase, and Mth RNA ligase were purchased from New England Biolabs. All standard laboratory chemicals and reagents were purchased from Thermo Fisher Scientific.
LNA GapmeR and siRNA transfection
LNA GapmeRs and siRNAs were transfected using Lipofectamine RNAiMax (Thermo Fisher Scientific) according to the manufacturer's protocol. Reverse transfections were performed by combining 50 pmoles GapmeR or 25 pmoles siRNA with 7.5 µL Lipofectamine RNAiMax in 250 µL Opti-MEM media (Thermo Fisher Scientific) per well of a 6-well plate. Two milliliters of cell suspension was added such that cells were ∼80% confluent 48 h posttransfection. Unless otherwise indicated, the following seeding cell densities were used: MCF-7 at 325,000 cells per mL, HEK-293T at 400,000 cells per mL, SK-BR-3 at 500,000 cells per mL, SK-OV-3 at 150,000 cells per mL, A549 at 200,000 cells per mL, MDA-MB-231 at 250,000 cells per mL, T-47D at 325,000 cells per mL, HeLa at 200,000 cells per mL, A375 at 125,000 cells per mL, and A2780 at 325,000 cells per mL. Transfections into other cell culture plates were scaled accordingly by volume. The BC200 siRNA targeting sequence is CGUAACUUCCCUCAAAGCAACAACC (Integrated DNA Technologies). The BC200 3′ targeting GapmeR sequence (159–174) is as follows: +A*+G*+G*G*A*A*G*T*T*A*C*G*C*+T*+T*+A. The BC200 5′ targeting GapmeR sequences are as follows: (67–81) +A*+A*+C*T*C*C*T*G*G*G*C*T*+C*+A*+A, (36–51) +C*+T*+T*+A*G*C*C*T*C*C*C*T*+G*+A*+G*+A, (37–52) +T*+C*+T*+T*A*G*C*C*T*C*C*C*+T*+G*+A*+G, (38–53) +C*+T*+C*+T*T*A*G*C*C*T*C*C*+C*+T*+G*+A. The negative control GapmeR sequence is as follows: +A*+A*+C*A*C*G*T*C*T*A*T*A*+C*+G*+C. “+N” indicates affinity plus (LNA) bases, and “N*” indicates phosphorothioated DNA bases. The NC1 nontargeting control siRNA (4390844) was used in all studies (Life Technologies).
Expression plasmid design and transfection
The cDNA sequence of enhanced green fluorescent protein (EGFP) was cloned into the HindIII and XhoI sites of the pCDNA3.1 plasmid. Expression cassettes for BC200 and related truncations (BC120, BC161, and BC185) were cloned upstream of the CMV promoter driving EGFP expression using the BglII and MluI sites of the pCDNA3.1-EGFP plasmid by standard molecular biology techniques. Thirty-two base pairs of sequence upstream of the BC200 transcription start site were included in all expression constructs. A consecutive run of four thymidines in the coding sequence was used to terminate RNA polymerase III transcription to define the 3′ end of each RNA. As an additional control, a plasmid containing the TRS-GCT4-1 gene (tRNA-Ser anticodon GCT) was cloned upstream of the CMV promoter, with 61 bp upstream flanking sequence and 108 bp downstream flanking sequence. Plasmid transfections were performed using PEI-MAX transfection reagent (Polysciences Inc.) according to the manufacturer's protocol. Briefly, 4 µg of plasmid was combined with 6 µL PEI (1 mg/mL) in 400 µL opti-mem and incubated 15 min before reverse transfection into 6-well plates. GFP quantification was performed with cell extracts normalized for total protein content (Bradford Assay) in a 96-well plate with an Applied Biosystems StepOne Plus instrument. An expression construct consisting of the BC200 RNA with insertion of the Mango-II aptamer was synthesized by Integrated DNA Technologies. The BC200-Mango RNA was expressed from a BC200 minimal promoter sequence, and a control RNA consisting of the Mango-II aptamer alone inserted into the F30 scaffold sequence was expressed from the U6 snRNA promoter (Filonov et al. 2015; Kim et al. 2017). Cells were transfected as described above.
In vitro transcription, RNA purification, and RNA quantification by RT-qPCR
In vitro transcription and purification of BC200, BC119, BC120, 7SL, and the Alu J consensus sequence was performed as previously described (Booy et al. 2012). The Alu J consensus sequence used was according to the sequence published by Hernandez et al. (2020). Following transcription, in vitro transcribed RNAs were purified by phenol-chloroform extraction followed by size exclusion chromatography and subsequently filter sterilized by passage through a 0.22 µm syringe filter. Plasmids containing RNA sequence with a 5′ T7 promoter and 3′ linearization site were synthesized by Genscript Inc. Following purification, RNAs were separated by denaturing TBE-Urea polyacrylamide gel electrophoresis and stained with Toluidine Blue O. Purified RNA was frozen at −80°C in single-use aliquots. To generate qPCR standard curves, carrier RNA was included in serial dilutions at a concentration of 5 ng/µL. RNA isolated from normal human tissue was purchased from Takara Bio.
RNA isolation from cultured cells was performed using the GeneJET RNA Purification kit as per the manufacturer's protocol (Thermo Fisher Scientific). RNA was quantified using a Nanodrop 2000c spectrophotometer (Thermo Fisher Scientific). Subcellular fractionation was performed using the Pierce Subcellular Fractionation kit for cultured cells according to the manufacturer's protocol (Thermo Fisher Scientific), with the substitution of DNase I for micrococcal nuclease in the extraction of the chromatin-bound fraction. Following fractionation, insoluble material (pellet fraction) was resuspended in denaturing binding buffer and any remaining RNA extracted. Fractionated RNA was purified using the GeneJet RNA Cleanup and Concentration Micro kit (Thermo Fisher Scientific). In parallel, an equal number of cells was used to extract a “total RNA” fraction in a similar manner.
RT-qPCR analysis was performed using an Applied Biosystems StepOnePlus instrument with the iTaq Universal Probes One-Step qPCR kit (Bio-Rad Laboratories). Reverse transcription and cycling parameters were carried out as per the manufacturer's specifications. All Taqman probes incorporated a 5′ FAM label, internal ZEN quencher (nine bases from 5′ fluorophore), and 3′ Iowa Black fluorescent quencher. Primer concentrations were maintained at 500 nM and probe concentrations at 250 nM for all assays. Taqman primer/probe sets are as follows: BC200 FL Forward Primer, GCTAAGAGGCGGGAGGATA; BC200 FL Probe, TGAGCCCAGGAGTTCGAGACCT; BC200 FL Reverse Primer, GCTTTGAGGGAAGTTACGCT; BC200 Alu Forward Primer, GCCTGTAATCCCAGCTCTCA; BC200 Alu Probe, CAAGCTATCCTCCCGCCTCTTAGC; BC200 Alu Reverse Primer, CCAGGCAGGTCTCGAACTC. 7SL Forward, CTGGAGGATCGCTTGAGTC, 7SL Probe, CCGGGAGGTCACCATATTGATGCC, 7SL Reverse Primer, TTCACCCCTCCTTAGGCA; GFP Forward Primer, GTCCGCCCTGAGCAAAG, GFP Probe, AGGACCATGTGATCGCGCTTCTC, GFP Reverse Primer, TTTTTTTTTTTTTTTTTTTTTTTT oligo(dT24). An oligo(dT) reverse primer was used for GFP quantification to prevent amplification of trace plasmid contaminants in the purified RNA. Primers and probes for qPCR were ordered from Integrated DNA Technologies. SYBR Green-based qPCR was performed using the iTaq Universal SYBR Green One-Step kit.
Denaturing PAGE, gel staining, and northern blotting
RNA was combined with an equal volume of denaturing RNA load dye (95% deionized formamide, 0.025% sodium dodecyl sulfate [SDS], 0.025% bromophenol blue, 0.025% xylene cyanol FF, 0.5 mM ethylenediaminetetraacetic acid [EDTA]), and heated to 95°C for 3 min. RNA was separated on 8% denaturing Tris-borate-EDTA-Urea (TBE-Urea) polyacrylamide gels. For total RNA staining, gels were incubated for 15 min in SYBR Gold nucleic acid stain diluted 10,000× in water (Thermo Fisher Scientific). For Mango aptamer staining, gels were incubated for 30 min in 20 nM TO1-biotin diluted in 50 mM Tris pH 7.5 containing 100 mM KCl.
For northern blots, gels were transferred to positively charged nylon membranes (BrightStar-Plus, Thermo Fisher Scientific). After transfer, RNA was cross-linked to the membrane at 240 mJ/cm2 with a Spectrolinker XL-1000 UV cross-linker (Thermo Fisher Scientific). Membranes were prehybridized for 30 min at 60°C with shaking in Ultrahyb Oligo Hybridization Buffer (Thermo Fisher Scientific) containing 2× blocking reagent (Roche Life Science). Following prehybridization, membranes were incubated with shaking overnight at 54°C with double-digoxigenin (5′ and 3′ DIG) LNA probes at a concentration of 3 nM. Membranes were sequentially washed twice each with 2×, 0.5×, and 0.1× saline sodium citrate buffer (SSC) containing 0.1% SDS for 20 min at 60°C. Blots were blocked for 30 min in 100 mM Maleic acid, 150 mM NaCl pH 7.5, with 2× blocking reagent and then blocked with EveryBlot blocking buffer for an additional 30 min (Bio-Rad). Blots were incubated overnight at 4°C with mouse anti-DIG (Jackson ImmunoResearch) diluted 1:2000 in EveryBlot blocking buffer. Following incubation, membranes were washed 3× with Tris-buffered saline containing 0.1% Tween 20 (TBS-T), and secondary antibodies (Goat anti-mouse IGG, Thermo Fisher Scientific, diluted 1:10,000 in EveryBlot Blocking Buffer) were added to membranes for 3 h at room temperature followed by four 10 min washes in TBS-T. Membranes were visualized by chemiluminescence (Luminata Forte, Thermo Fisher Scientific). To visualize total RNA, a duplicate gel was stained with the fluorescent nucleic acid stain SYBR Gold (Thermo Fisher Scientific). Probe sequences are as follows: BC200 63–84 probe, TCGAACTCCTGGGCTCAAGCTA (Design ID 570230-2, Exiqon); BC200 157–177 probe, TTGAGGGAAGTTACGCTTATT (Design ID 607961-2, Exiqon); BC200 86–107 probe, TC+ GC+TAT+ATTG+CCC+AGGC+AGGT, BC200 33–52 probe, TCT+TAGCCTCCC+T+G+A+G +AGCT. +N indicates affinity plus (LNA) bases. Custom LNA oligonucleotide probes were ordered from Qiagen.
RNA size fractionation, linker ligation, and BC120 discriminating RT-qPCR
RNA was separated by denaturing TBE-UREA PAGE, and gels were placed on a glass plate and aligned with a template to cut out 24 uniform slices using a clean, sterile razor blade. Gel slices were transferred to a 0.5 mL microcentrifuge tube that had been pierced by a red hot 25-gauge needle. 0.5 mL tubes were placed inside 1.5 mL microcentrifuge tubes and centrifuged at maximum speed in a benchtop microcentrifuge for 5 min to shred the gel slices into fine fragments. 0.5 mL tubes were discarded and 400 µL binding buffer from the RNA Cleanup and Concentration Micro kit was added to the pelleted gel material in the 1.5 mL tubes. Tubes were incubated with shaking overnight at 4°C in an Eppendorf ThermoMixer R (Thermo Fisher Scientific). Gel material was removed by centrifuging the suspension through a 0.45 µm centrifugal filter (Spin-X, Thermo Fisher Scientific). RNA was purified using the RNA Cleanup and Concentration Micro Kit according to the manufacturer's protocol (Thermo Fisher Scientific).
To sequence the size-fractionated RNA, an 18 nt 5′ phosphorylated linker sequence was ligated to the 3′ ends of the RNA. The linker sequence is ACT GTA GGC ACC ATC AAT. In total, 100 µL ligation reactions were prepared as follows: 1× NEB T4 RNA ligase buffer, 1 mM ATP, 1 µM phosphorylated linker, 100 units T4 RNA ligase, 10% DMSO, 10% PEG 8000, 40 units RiboLock RNase Inhibitor, 38.5 µL size-fractionated RNA. Ligation reactions were performed for 3 h at 12°C, following which RNA was purified using the RNA Cleanup and Concentration Micro Kit, according to the manufacturer's protocol. RNA was subsequently reverse transcribed and amplified using a reverse primer complementary to the linker sequence (ATTGATGGTGCCTACAGT) and a forward primer complimentary to nt 12–29 of the BC200 and Alu J, Y, and S consensus sequences (GTGGCTCACGCCTGTAAT) (Hernandez et al. 2020). To increase the proportion of BC200 sequencing products, amplification was also performed with a forward primer complimentary to nt 33–52 of the BC200 sequence (AGCTCTCAGGGAGGCTAAGA). Amplification products were separated by agarose gel electrophoresis, bands were excised, and cDNA purified using the GeneJet Gel Extraction kit (Thermo Fisher Scientific). cDNA was blunt-end cloned into the pJET1.2 vector, and resulting plasmids were sequenced using standard dye-terminator reactions (GeneWiz, Azenta, Inc.). While initial RNA ligation and amplification were performed on size-fractionated RNA, optimization of ligation and PCR conditions allowed for subsequent sequencing of BC120 from linker-ligated total RNA.
BC120 discriminating RT-qPCR was performed using linker-ligated total RNA and the following Taqman primer/probe set: BC120 Forward Primer, AGCTCTCAGGGAGGCTAAGA; BC120 Probe, ATATTGCCCAGGCAGGTCTCGAAC; Linker Reverse Complement Primer, ATTGATGGTGCCTACAGT. Linker ligation with T4 RNA ligase was performed as described above using 2.5 µg total RNA in a 100 µL reaction at the indicated temperatures for 2 h. Linker ligation reactions with thermostable 5′ App DNA/RNA ligase were prepared as follows: 1× NEBuffer 1, 10% PEG 8000, 2.5 µg RNA, 2 µM phosphorylated linker, 100 µM ATP, 1 µM Thermostable 5′ App DNA/RNA ligase, 1.25 µM Mth ligase, 40 units RiboLock RNase Inhibitor in a final volume of 50 µL. Thermostable ligation reactions were incubated at the indicated temperature for 2 h, following which 1 unit Proteinase K was added, and reactions were incubated for 10 min at 55°C. Linker-ligated RNA was purified using the RNA Cleanup and Concentration Micro kit (Thermo Fisher Scientific). A 5′ and 3′ DIG-labeled LNA probe complimentary to nt 157–177 of BC200 was used to inhibit amplification of the full-length RNA (Exiqon design ID 535069-2, now available from Qiagen). The DIG-labeled LNA probe was included in RT-qPCR reactions at a concentration of 250 nM. RT-qPCR was performed using the iTaq Universal Probes One-Step kit (Bio-Rad Laboratories), according to the manufacturer's protocol, with an annealing/amplification temperature of 63°C. BC120 amplification was significantly inhibited at amplification temperatures below 63°C, and reverse primer binding was significantly inhibited at temperatures >63°C.
To assess linker ligation to full-length BC200, a forward primer complementary to nt 158–180 (ATAAGCGTAACTTCCCTCAAAGC) was used in conjunction with the linker reverse complement primer for SYBR Green-based RT-qPCR using the iTaq Universal SYBR Green One-Step kit (Bio-Rad).
SUPPLEMENTAL MATERIAL
Supplemental material is available for this article.
ACKNOWLEDGMENTS
We acknowledge the support of the Manitoba Ovarian Biobank Program and the Manitoba Tumor Bank, Winnipeg, Manitoba, which is funded by the CancerCare Manitoba Foundation and is a member of the Canadian Tissue Repository Network. We gratefully acknowledge the receipt of cell lines from Drs. Thomas Klonisch, Spencer Gibson, Peter Pelka, Jens Kurreck, Benjamin Tsang, and R. Drapkin. This work was supported by a Canadian Institutes of Health Research Project grant (427781). D.G. was supported by a Natural Sciences and Engineering Research Council of Canada CGS-D award.
Footnotes
-
Article is online at http://www.rnajournal.org/cgi/doi/10.1261/rna.080152.124.
- Received June 21, 2024.
- Accepted August 8, 2024.
This article is distributed exclusively by the RNA Society for the first 12 months after the full-issue publication date (see http://rnajournal.cshlp.org/site/misc/terms.xhtml). After 12 months, it is available under a Creative Commons License (Attribution-NonCommercial 4.0 International), as described at http://creativecommons.org/licenses/by-nc/4.0/.




