


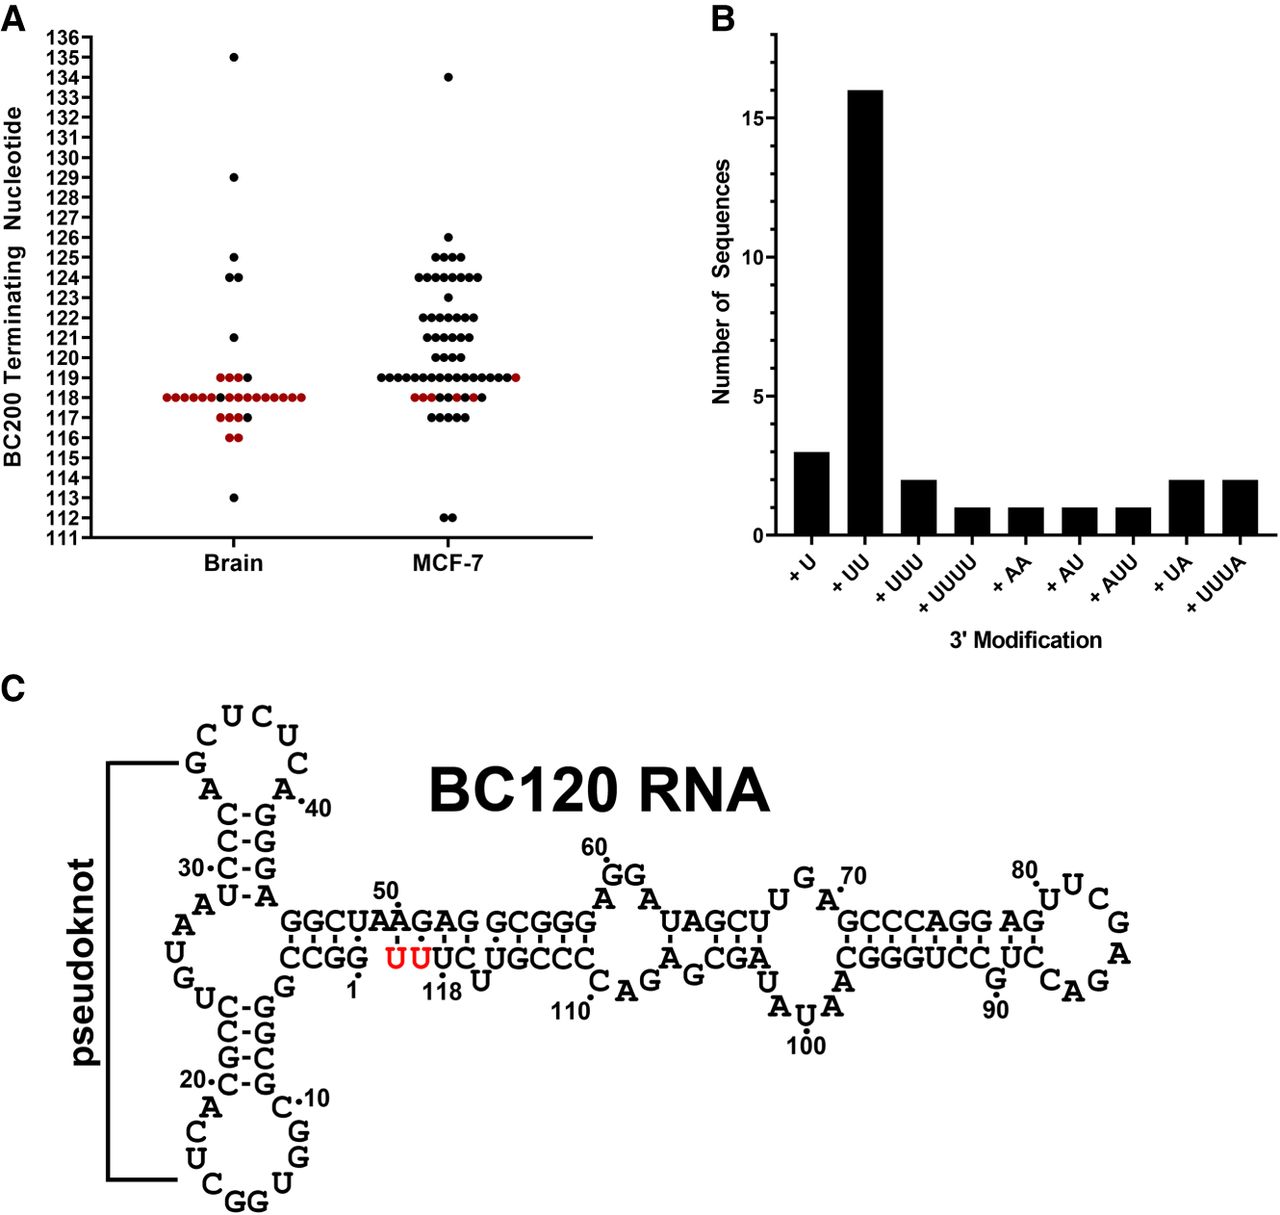
FIGURE 3.
Sequence analysis of the BC200 truncation. (A) Summary of sequencing of ∼120 nt clones from both total brain RNA and MCF-7 cell RNA. Each dot represents an individual sequence with terminating nucleotide indicated on the y-axis. Red dots indicate sequences that exhibit a 3′ end modification. (B) Bar graph representing the observed 3′ end modifications on the x-axis and the frequency indicated on the y-axis for both brain and MCF-7 RNA. (C) Schematic of the most frequently observed BC200 truncation in normal brain RNA. Terminal uridines not coded for in the BCYRN1 gene are highlighted in red.




