


The antivirulent Staphylococcal sRNA SprC regulates CzrB efflux pump to adapt its response to zinc toxicity
- Simon Raynaud1,
- Marc Hallier1,2,
- Stéphane Dréano3,
- Brice Felden1,4,
- Yoann Augagneur1 and
- Hélène Le Pabic1
- 1Inserm, BRM (Bacterial RNAs and Medicine)—UMR_S 1230, Université de Rennes, 35000 Rennes, France
- 2Université de Rennes, QCPS (Quality Control in Protein Synthesis), IGDR UMR CNRS 6290, F-35042 Rennes, France
- 3Université de Rennes, CNRS UMR 6290 IGDR, BIOSIT, Molecular Bases of Tumorigenesis: VHL Disease Team, 35043 Rennes, France
- Corresponding authors: yoann.augagneur{at}univ-rennes.fr, helene.lepabic{at}univ-rennes.fr
-
Handling editor: Jörg Vogel
Abstract
Bacterial regulatory RNAs (sRNAs) are important players to control gene expression. In Staphylococcus aureus, SprC is an antivirulent trans-acting sRNA known to base-pair with the major autolysin atl mRNA, preventing its translation. Using MS2-affinity purification coupled with RNA sequencing, we looked for its sRNA-RNA interactome and identified 14 novel mRNA targets. In vitro biochemical investigations revealed that SprC binds two of them, czrB and deoD, and uses a single accessible region to regulate its targets, including Atl translation. Unlike Atl regulation, the characterization of the SprC-czrB interaction pinpointed a destabilization of the czrAB cotranscript, leading to a decrease of the mRNA level that impaired CzrB zinc efflux pump expression. On a physiological standpoint, we showed that SprC expression is detrimental to combat against zinc toxicity. In addition, phagocyctosis assays revealed a significant, but moderate, increase of czrB mRNA levels in a sprC-deleted mutant, indicating a functional link between SprC and czrB upon internalization in macrophages, and suggesting a role in resistance to both oxidative and zinc bursts. Altogether, our data uncover a novel pathway in which SprC is implicated, highlighting the multiple strategies used by S. aureus to balance virulence using an RNA regulator.
Keywords
INTRODUCTION
Staphylococcus aureus is a major pathogen responsible for a wide spectrum of infections in both humans and animals. These are often minor skin infections, although severe ones such as pneumonia, endocarditis, and sepsis are not scarce. Around 30% of the human population is colonized, especially in nasal cavities, and therefore constitute a bacterial reservoir for future infections (Hanssen et al. 2017). After bacterial invasion into the host, the innate immune system, which represents the first line of defense against the intruder, is activated. This activation leads to the recruitment of professional phagocytes (i.e., neutrophils and macrophages) and to the release of an arsenal of antimicrobial effectors (Weiss and Schaible 2015). Although S. aureus is often considered an extracellular pathogen, the emergence of invasive strains revealed the major role of internalization in diverse host cells during infection. S. aureus is able to invade host cells such as endothelial cells (Raineri et al. 2020), epithelial cells (Surmann et al. 2018), fibroblasts (Röhrig et al. 2020), and osteoblasts (Mohamed et al. 2014), but also immune cells such as lymphocytes (Chakraborty et al. 2011), neutrophils (Bongers et al. 2019; Howden et al. 2023), and macrophages (Flannagan and Heinrichs 2020). The bacterium can survive several days into macrophagic vacuoles before being released in the cytoplasm, leading to macrophage lysis without apoptosis or necrosis (Kubica et al. 2008). S. aureus uses macrophages as an intracellular niche with no effect on its viability, thanks to a tight modulation of its gene expression to adapt to this harsh environment (Horn et al. 2018), which includes heavy metal poisoning through a burst of free zinc and intraphagosomal zinc accumulation (Botella et al. 2011).
Bacterial regulation of gene expression relies on the presence of a coordinated network of players acting at the transcriptional and posttranscriptional levels. Among them, regulatory RNAs emerged as key factors of posttranscriptional regulation of bacterial processes, from central metabolism (Rochat et al. 2018; Bronesky et al. 2019), stress response (Augagneur et al. 2020), antibiotic resistance (Dersch et al. 2017; Felden and Cattoir 2018) to virulence (Le Pabic et al. 2015; Ménard et al. 2021). They are considered small RNAs (sRNAs), and their canonical mechanism of action often relies on an interaction with the RBS of an mRNA target to prevent ribosomal translation, without the requirement of a chaperone in S. aureus (Felden and Augagneur 2021). Over the last decade, the improvement of sequencing technologies allowed the exponential identification of novel sRNAs, whose main features are displayed in the Staphyloccocal regulatory RNAs database (SRD) under unique harmonized identifiers (Sassi et al. 2015). However, for most of them, their biological functions remain unknown, and only a few are considered bona fide (Liu et al. 2018). Among those with known function, Srn_3610_SprC (called SprC hereafter in this article) is a trans-acting sRNA that decreases phagocytosis by monocytes THP1 and THP1-differenciated macrophages by inhibiting the atl mRNA translation (Le Pabic et al. 2015). In addition, SprC decreases bacterial virulence in a murine model. However, whether SprC modulates the expression of other targets remains to be deciphered.
Here, we used the MS2-affinity purification coupled with RNA sequencing (MAPS [Lalaouna et al. 2018]) to search for additional SprC RNA targets. We identified 14 putative mRNA targets, including deoD and czrB, and demonstrated that SprC interacts with both in vitro. We specifically showed that SprC downregulates the czrAB operon through a direct interaction within the coding region of czrB to modify its RNA stability, contributing to an altered CzrB protein level. Overall, the regulation of CzrB expression by SprC results in a modulation of resistance to zinc stress and participates in the control of czrAB gene expression in macrophages, highlighting the key role of SprC to adjust virulence.
RESULTS
Deciphering the SprC RNA targetome by MAPS
To define suitable conditions for identifying the SprC targetome, its expression profile was monitored during growth every 30 min for 5 h, then each hour for the next 3 h, and with a final measurement after 24 h (Fig. 1A,B). SprC is quickly expressed upon inoculation in fresh medium with a sixfold increase after 30 min. Then, its RNA level gradually decreases for the next 1.5 h before increasing again to reach a new peak in the early stationary phase (4 h of growth). Afterward, SprC expression decreases to an almost undetectable level in the late stationary phase (Fig. 1A,B). Then, an MS2 tagged version of the sRNA was expressed from pRMC2 (Corrigan and Foster 2009) under the control of an anhydrotetracyclin (Atc)-inductible promoter in the Newman strain. Northern blot analysis showed that MS2_SprC fusion was expressed from pRMC2-MS2_SprC in S. aureus after Atc induction and specifically enriched after loading onto amylose resin (Supplemental Fig. S1A), allowing recovery of primary targets by affinity purification. Although a 17-fold increase of the endogenous SprC was observed in the Newman-pRMC2-MS2_SprC, a 270-fold increase of the MS2_SprC fusion was measured under Atc induction (Supplemental Fig. S1B). RNA complexes were purified after 2.5 h since it corresponded to (i) the exponential phase of growth and (ii) the beginning of the second peak of expression of SprC (Fig. 1). Fourteen transcripts were significantly enriched upon MS2_SprC induction (Table 1) compared with an MS2 control. RNA enrichments varied from 2.5 to 35.5 with the most enriched one being the deoD mRNA, encoding a purine nucleoside phosphorylase. Among the other transcripts, several with known or predicted encoded functions were identified. These included ribosomal proteins (rpmA and rpmB), transcription factors (mgrA and fapR), members of the quorum-sensing agr system (agrB and agrC), and a DNA-binding protein (hup). Additionally, three transcripts encoding transport systems were retrieved: one devoted to zinc efflux (czrB, which is a part of the czrAB operon [Kuroda et al. 1999] and located into the S. aureus membrane), one implicated in drug resistance (bcr/cflA), and one involved in amino acid transport (bmQ2). Finally, three transcripts encoding unknown functions were selectively enriched upon SprC induction.
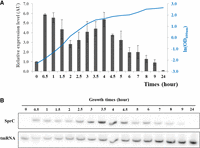
SprC expression during bacterial growth. (A) Relative quantification of SprC expression was determined by northern blot using tmRNA as an internal loading control. The data presented are the mean of three independent biological replicates. (B) One representative northern blot analysis of SprC expression during bacterial growth. Cells were cultured in BHI at 37°C, and total RNA was extracted every 30 min until 5 h of growth, then every hour.
RNAs enriched and sequenced by MAPS using SprC as a bait
To anticipate whether these candidates may interact with SprC, we performed in silico predictions (Table 1, last column) using the intaRNA program (Mann et al. 2017). Then, by focusing on targets with an enrichment yield > 5, and a predicted energy < −5 kcal/mol, we narrowed to the first three targets. Since one of them was encoding a hypothetical protein, we pursued our investigations only on the following two candidates: deoD and czrB.
SprC forms specific and stable complexes with its targets in vitro and mutational analysis identified the interaction domain
To investigate the mechanism of interaction between SprC and these two targets, we conducted EMSA. Since deoD and czrB encode for CDS of 711 nt and 981 nt, respectively, we first generated a 173 nt fragment of deoD and a 169 nt fragment of czrB encompassing the predicted interaction site (Supplemental Fig. S2). SprC formed a complex only with a czrB mRNA fragment (Fig. 2A) but not with a deoD fragment in vitro (Supplemental Fig. S3A). However, using a full-length deoD mRNA (774 nt including its putative UTRs) allowed retardation (Supplemental Fig. S3B). The estimated apparent Kds between SprC with czrB and deoD mRNAs were ∼0.23 (+/−0.08) and ∼1.4 (+/−0.16) µM, respectively. The binding between SprC onto these two mRNAs was specific since an excess of an unrelated RNA, poly(U) RNAs, did not displace SprC or deoD from preformed mRNA-SprC complexes. Conversely, an excess of cold SprC or deoD displaced each of them (Fig. 2A; Supplemental Fig. S3B).
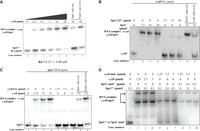
Electrophoretic mobility shift assays to analyze pairing between SprC and czrB. (A) Specific complexes between radiolabeled SprC and czrB. (B) Gel retardation assay with SprC deletion mutant and radiolabeled czrB. (C) Gel retardation assay with czrB deletion mutant and radiolabeled SprC. (D) Gel retardation assays with radiolabeled SprC or SprC mutant and czrB or czrB compensatory mutant. The data were reproduced by three independent biological replicates.
Based on in silico predictions, SprC may interact with the two targets using the same domain (Supplemental Fig. S2). This domain corresponds to an accessible region within the second stem–loop of the sRNA, already known to interact with the atl mRNA (Le Pabic et al. 2015). To decipher how SprC binds czrB mRNA, we first generated two additional constructs: SprCΔ27 (ΔG66-A92) and czrBΔ34 (ΔC864-A898), deleted for their predicted interacting domains (Supplemental Fig. S2). EMSA conducted with a 312 nt fragment of czrB and either SprC or SprCΔ27 showed that the deletion in SprC was critical for interaction in vitro (Fig. 2B, lanes 5–7). Similarly, when czrB was deleted for nucleotides 864–898 (predicted to base-pair with SprC), no retardation was observed (Fig. 2C, lanes 5–7). Next, we mutated five nucleotides within the czrB binding domain, leading to a drop of the predicted energy ΔG from −13.5 kcal/mol to −5.39 kcal/mol. Indeed, a substantial amount of radiolabeled SprC did not form a SprC-czrB complex (Fig. 2D, lanes 5–7) compared to the native complex obtained using the same molecular ratios (Fig. 2D, lanes 2–4). Then, generation of compensatory mutations on SprC fully restored the retardation (Fig. 2D, lanes 8–10), indicating that the accessible region within the second stem–loop of SprC anneals to the 3′ coding region of czrB mRNA (Supplemental Fig. S2B). Additionally, we tested the ability of SprCΔ27 to interact with the deoD mRNA transcript. SprCΔ27 interacts very weakly with the deoD mRNA compared to the native form of SprC (Supplemental Fig. S3C), confirming that SprC uses the second stem–loop domain to bind deoD. Altogether, these data indicate that SprC interacts with czrB and deoD mRNAs, reveal a better affinity for czrB mRNA in vitro, and pinpoint the critical regions for base-pairing for SprC-czrB. These data suggest that this may also happen in vivo.
SprC interacts with czrAB mRNA 3′-end to destabilize it and shorten its half-life
In vitro biochemical investigations revealed that SprC binds czrB and deoD mRNAs within their coding sequences. This suggests that the mechanism of action may differ with the canonical repression of Atl, occurring at a translational level through ribosomal steric hindrance. To provide further insights onto czrB mRNA regulation by SprC, we investigated the czrAB cotranscript level during bacterial growth in Newman and Newman-ΔsprC (Fig. 3A). Overall, in the absence of SprC (Newman-ΔsprC, right panel), the amount of czrAB mRNA gradually increases during exponential phase to reach a peak at 5 h. Conversely, expression in the parental strain was rather more constitutive (Fig. 3A, left panel). This was confirmed with the quantification and normalization of signals showing that the czrAB mRNA level is higher in the absence of SprC, with up to an approximately threefold ratio after 6 h of growth (Fig. 3B). Thus, this suggested that SprC reduces the czrAB mRNA level through modulation of its stability. To address this, the czrAB mRNA half-life was estimated experimentally using rifampicin in both Newman and Newman-ΔsprC (Fig. 3C; Supplemental Fig. S4). The deletion of SprC led to an ∼2.5 fold increase of the czrAB mRNA stability, with an estimated average mRNA half-life of 5.55 min (+/−1.68) compared to 2.23 min (+/−1.39) found in the parental strain (Fig. 3C; Supplemental Fig. S4). Overall, these data indicate that SprC pairs czrB mRNA 3′-end to reduce czrAB transcript levels through an alteration of its stability.
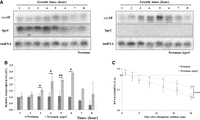
Northern blot analysis of czrAB transcript level and half-life determination. (A) Northern blot analysis of czrAB transcript level during bacterial growth as a function of SprC expression. (B) Relative quantification of czrAB transcript levels determined by northern blot and using tmRNA as an internal loading control. (C) Relative quantification of czrAB transcript levels during bacterial growth in the presence of rifampicin determined by northern blot and using tmRNA as an internal loading control. The data were reproduced by three independent biological replicates and analyzed with Student t-test (B, 2–6 h and then 8 h) or Mann–Whitney test (B, 1 h and 7 h) and paired samples t-test (C) for statistical analysis ([*] P < 0.05, [**] P < 0.01, [***] P < 0.005).
SprC interaction with czrAB mRNA leads to a decrease of the czrB efflux pump expression
SprC modulates czrAB expression by playing on its mRNA stability. To ensure that this has a functional impact on CzrB, we targeted CzrB expression by western blot. To that aim, we introduced a FLAG tag at the 3′ end of the czrB chromosomal gene. Allelic exchange was done in both Newman and Newman-ΔsprC strains, which were then transformed with pCN38 or pCN38-sprC (resulting in a moderate overexpression of SprC [Le Pabic et al. 2015]). Protein extracts were prepared from cultures grown for 2 h before adding 5 mM of ZnSO4, a metal known to promote CzrB expression (Kuroda et al. 1999), and then incubated for another 4 h or 6 h. The CzrB-FLAG protein was detected in a membrane/wall fraction at around 37k Da, indicating that the C-terminal tag allowed protein expression (Supplemental Fig. S6). Since FLAG antibodies also recognized the protein A (Spa) at around 50 kDa, it was used as an internal loading control. In addition, a negative control was performed on unflagged strains revealing only SpA (Supplemental Fig. S6). The CzrB level was increased by around 1.5 and 2.4 at 4 h and 6 h of stress in the Newman-ΔsprC flagged strain, consistent with the repressive role of SprC (Fig. 4). Conversely, the ectopic expression of SprC in the mutant strain restored the parental protein level after 4 h of ZnSO4 induction, while partially after 6 h (Fig. 4). Also, the expression of SprC deleted for the predicted interacting domain did not restore the parental phenotype (Fig. 4). Altogether, these data indicate that the decrease of czrAB mRNA levels, driven by a decrease of mRNA stability, leads to an altered expression of the CzrB efflux pump.
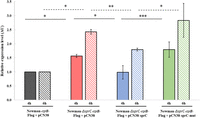
Western blot analysis of czrB expression levels as a function of SprC expression. Relative quantification of CzrB levels determined by western blot and using SpA as an internal loading control. Bacteria were grown for 2 h before addition of 5 mM of ZnSO4, and protein extractions were performed after (A) 4 h and (B) 6 h of additional growth. Values are the mean of four (after 4 h) or three (after 6 h) independent experiments. Mann–Whitney test or Student t-test were used for statistical analysis ([*] P < 0.05, [**] P < 0.01, [***] P < 0.005).
SprC-mediated regulation of czrB expression influences S. aureus fitness against zinc toxicity in vitro
In S. aureus, CzrAB allows divalent cation efflux, especially zinc (Kuroda et al. 1999), which is used by macrophages as a heavy metal poisoning through a burst of free zinc and an intraphagosomal zinc accumulation (Botella et al. 2011). To decrypt the function of SprC associated with czrAB downregulation, we monitored the growth of Newman with increasing concentrations of ZnSO4 (Fig. 5A). Overall, a dose-dependent growth inhibition was observed, with a major effect starting from 4 mM of zinc, leading to an approximately 6 h delay in the lag phase. In parallel, we verified the overexpression of czrAB mRNA in the presence of zinc (Kuroda et al. 1999) in the parental strain, with a 50–60 fold increase (Supplemental Fig. S5). Similarly, SprC was also overexpressed in the presence of zinc, but with only an approximately fivefold increase, a likely insufficient level to reduce CzrB expression compared to the control condition. To confirm that SprC represses czrB expression to play on zinc efflux, we compared four strains: (i) the parental transformed with pCN38 (Newman-pCN38), (ii) the Newman-ΔsprC strain transformed with pCN38, (iii) the Newman-ΔsprC strain transformed pCN38-sprC (Newman-ΔsprC-pCN38-sprC) and (iv), the Newman-ΔsprC strain transformed with pCN38-sprC-mut. Strains were cultured until 2 h of growth zinc before adding 5 mM of zinc (Fig. 5B).
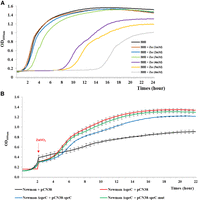
Stress zinc experiments. (A) Bacterial growth with increasing concentration of ZnSO4. (B) Bacterial growth after addition of 5 mM of ZnSO4 at T = 2 h of growth. The data were reproduced by three independent biological replicates.
Application of zinc stress during the exponential phase (after 2 h of growth) led to an immediate near stasis of the four strains (Fig. 5B). The Newman-ΔsprC strain was the first to recover and pursued its growth to reach a final biomass around two times higher than the parental strain (Fig. 5B). Plasmidic expression of SprC partially brought back the Newman phenotype, whereas the complementation with SprC-mut did not (Fig. 5B).
SprC-mediated regulation of czrB during phagocytosis
Since we previously demonstrated that SprC plays a role during phagocytosis by decreasing the number of internalized bacteria (Le Pabic et al. 2015), we monitored the expression of SprC and czrB during phagocytosis. First, we verified the expression of SprC in internalized bacteria at different time intervals after phagocytosis of S. aureus by macrophages at an MOI of 10:1 (bacteria:macrophages). An SprC peak of expression was observed at the beginning of phagocytosis, followed by a decrease, and then a slow and moderate re-increase (Fig. 6A). Regarding czrB, a time-dependent upregulation of czrB expression was measured in internalized bacteria (Fig. 6B). In addition, deletion of SprC conducted to a significant but moderate (17%) increase of czrB mRNA levels, whereas a slight decrease was observed in a complemented strain, indicating a functional link between SprC and czrB expression upon internalization in macrophages (Fig. 6C).
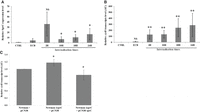
RT-qPCR analysis of czrB relative expression as a function of SprC expression after phagocytosis. Relative transcript level of (A) SprC and (B) czrB during different internalization times, determined with gyrB as reference gene. Phagocytosis assays were performed in Newman strain for 2 h, 10 h, 18 h, and 24 h before lysis of macrophages and RNA extraction. A control (CTRL) was performed with Newman strain growth in macrophage medium for 2 h. Relative expression level in extracellular bacteria (ECB) was also determined after 2 h of bacteria-macrophages contact. (C) Relative transcript levels of czrB as a function of SprC expression at 2 h of internalization, determined with gyrB as reference gene. The data were reproduced by four independent biological replicates with Mann–Whitney test for statistical analysis ([*] P < 0.05, [**] P < 0.01).
DISCUSSSION
Over the last 30 years, an increasing number of sRNAs were found (Menard et al. 2022). Several hundred are currently listed in the SRD (Sassi et al. 2015), although the regulatory functions of the vast majority of them remain unknown (Liu et al. 2018). Among those already characterized for their regulatory properties, SprC is defined as a repressor of (i) S. aureus uptake by human macrophages, (ii) resistance to an oxidative environment, and (iii) virulence in a murine model of infection (Le Pabic et al. 2015). Some of its biological effects were attributed to the ability to base-pair with the atl mRNA encoding the major autolysin.
Since trans-acting sRNAs are defined as RNA regulators capable of controlling more than one target (Felden and Augagneur 2021), we investigated the SprC targetome using MAPS. Among the 14 targets identified, we pursued our in vitro investigations on two of them: deoD and czrB. They were selected after collating experimental and computational analyses (enriched yield and predicted hybridation energy), which can be relevant approaches to decipher the targetome (Georg et al. 2020). Physical interaction between SprC and the targets were challenged experimentally and scrutinized by gel retardation assays. To that aim, we first tested short mRNA transcripts, centering on the predicted interaction sites for czrB and deoD mRNAs. No interaction was detected using a deoD transcript fragment (Supplemental Fig. S3A) unlike the czrB transcript which specifically interacts with SprC with an estimated Kd of 0.23 µM +/−0.08 (Fig. 2A), in agreement with its high predicted binding energy (ΔΔG of −13.5 kcal/mol, Supplemental Fig. S2). We hypothesized that the deoD mRNA fragments used for the gel retardation assay would present a nonoptimal conformation, preventing SprC binding. Indeed, the use of a full-length transcript allowed a better retardation for deoD with an estimated Kd of 1.4 µM (+/−0.16) (Supplemental Fig. S3B).
Surprisingly, the atl mRNA, a known target of SprC (Le Pabic et al. 2015), was not enriched by MAPS. Several hypotheses can be raised and discussed to explain such absence: (i) the binding affinity between the two RNAs is weak, and (ii) the experiments were conducted in a condition where atl mRNA is expressed at a low level. EMSA showed that SprC has a better affinity for deoD (∼25-fold) and czrB (>100-fold) than for atl (Kd of 35 µM; [Le Pabic et al. 2015]). These results are in agreement with in silico predictions indicating a weak binding energy (ΔΔG of −5.17 kcal/mol) when subjected to the IntaRNA program (Mann et al. 2017). Similarly, the use of RNApredator (Eggenhofer et al. 2011) to search for SprC targets identified czrB but not atl as a putative target (Supplemental Table S1), highlighting the power of cooperation between experimental and computational analyses (Georg et al. 2020). Noteworthy, this second algorithm determined a base-pairing similar to that predicted by IntaRNA. Regarding the atl mRNA, we previously showed that its expression was at the lowest level after 2.5 h of growth (Le Pabic et al. 2015). Therefore, these experimental and computational data support the fact that atl mRNA was not retrieved under our MAPS conditions.
To the best of our knowledge, our study is the first that aims at deciphering the molecular primary targets of SprC. Although two other studies focused on the SprC targetome (Zhao et al. 2017; Zhou et al. 2022), we did not enrich any of the targets identified. Several experimental differences can explain the absence of common hits, such as the fact that their approaches did not distinguish direct from indirect targets and were performed in conditions that cannot be fully compared with MAPS. In addition, their studies were done in the N315 strain background, which presents a different pattern of SprC expression. The first study used a proteomic approach to define targets regulated by SprC (Zhao et al. 2017). The authors identified 44 proteins whose expression is modified between the N315 strain and its isogenic sprC deletion mutant. The main pathways defined were involved in metabolic and cellular processes as well as in cellular regulation. Beyond these, some of them fit with known SprC-dependent biological effects. For instance, the downregulation of BshA, encoding a N-acetyl-α-D-glucosaminyl L-malate synthase and involved in the Bacillithiol biosynthesis pathway, can be related to the contribution of SprC to oxidative stress response (Le Pabic et al. 2015). Indeed, BshA is crucial for bacterial growth in the presence of 10 mM of H2O2, and an impairment of Bacillithiol is detrimental for bacterial survival after exposure to professional macrophages and neutrophils (Posada et al. 2014). In addition, the LukED toxins were found downregulated, consistent with the antivirulent phenotype of SprC. The second study focused on a transcriptomic analysis of genes regulated by SprC in N315 (Zhou et al. 2022). In this study, 60 mRNAs were differentially expressed between the wild-type and sprC-deleted strains. The main pathways were linked to metabolism, enzymatic activity and virulence. Beyond those transcripts, SprC upregulates several purine metabolism genes, especially genes from the pur operon. These data were in agreement with the first MAPS hit, deoD, which is also implicated in purine metabolism and particularly in the salvage pathway. In our study, the absence of the pur mRNAs from MAPS may therefore suggest that they do not belong to the direct SprC interactome. Consistent with the proteomic study done by Zhao et al. (2017), the transcriptomic study still found SprC as a repressor of the lukED expression, although the precise mechanism of action (direct or indirect) is not uncovered yet. Also, recent CLASH experiments did not evidence any new SprC targets whose SprC-mRNA duplex is cleaved by RNase III (McKellar et al. 2022; Mediati et al. 2022).
To further challenge the interaction between SprC and its validated mRNA targets (czrB and deoD), mutational analyses were performed. Regarding the SprC-czrB complex, two deletion mutants were produced based on the predicted interaction: one of 27 nt on SprC (ΔG66-A92) and the other of 34 nt on czrB (ΔC864-A898). The SprC mutant lacking 27 nt from the second stem–loop (Supplemental Fig. S2) was unable to interact with both czrB and deoD (Fig. 2; Supplemental Fig. S3), in addition to the atl mRNA (Le Pabic et al. 2015). This suggests that this 27 nt stretch within SprC is accessible and weakly structured, as evidenced by several unpaired nucleotides (Supplemental Fig. S2). Then, compensatory mutation experiments showed that the mutation of 5 nt within the predicted interacting domain of SprC were sufficient to perturb the formation of an SprC/czrB complex (Fig. 2). Also, it showed that a single SprC domain regulates the expression of at least three independent mRNA targets. Therefore, this sRNA domain appears to be critical for SprC regulatory activity, because duplex formation predictions done with IntaRNA (Mann et al. 2017) indicated that eight out of the 14 targets identified by MAPS had maximum potential base-pairing straddling this 27-nt region (Supplemental Table S2). Although SprC uses a single domain to regulate atl and czrB, our investigations showed that the mechanism of action differs. While SprC represses Atl production at the translational level, it downregulates the expression of the czrAB transcript at the posttranscriptional level (Fig. 3), with an optimum regulation after around 4–6 h of growth (Fig. 3B). Binding of SprC onto czrB has a direct effect on target mRNA half-life with an approximately 2.5-fold decrease (Fig. 3C). A hypothesis would be that the pairing of SprC at the czrB mRNA 3′-end could lead to the recruitment of RNases and consequently decrease its translation by reducing the mRNA level.
The functional outcome of the czrAB regulation was further investigated. CzrAB is reported to play a role in zinc transport across the bacterial membrane to maintain an appropriate intracellular concentration and avoid toxicity (Kuroda et al. 1999). When engulfed by macrophages, pathogens such as M. tuberculosis face a burst of zinc from the host human macrophages that reach the bacterial phagosome, to clear intracellular microbes (Botella et al. 2011). Such a zinc burst probably occurs when S. aureus is phagocyted by human macrophages, and mechanisms of adaptation are needed to respond and adjust bacterial physiology to this brutal environmental modification. In that particular condition, SprC may decrease the zinc efflux, through a posttranscriptional repression of CzrB expression, leading to a toxic stress for the bacterium and contributing to its lowered virulence potential.
In our study, an excess of zinc negatively impacted S. aureus growth (Fig. 5A) and was accompanied by a strong increase of czrAB expression (Supplemental Fig. S5). Similarly, phagocytosis assays supported a functional link between SprC and czrB during the S. aureus intracellular lifestyle. Indeed, in this context, czrB was significantly induced (Fig. 6B) and deletion of SprC emphasized this upregulation (Fig. 6C). These data suggest an important, although nonelucidated, role of its efflux pump in these conditions. The CzrB efflux pump may allow internalized bacteria to better survive against the zinc burst triggered by immune cells to kill pathogens. The negative regulation of SprC onto CzrB is therefore consistent since it was shown that SprC negatively impacts bacterial survival after phagocytosis (Le Pabic et al. 2015). To better understand the role of this pump, phagocytosis assays with a czrB deletion mutant should be considered in order to eventually show the impact of czrB on bacterial survival.
Apart from zinc, within the phagosome macrophages coordinately use an arsenal of other weapons to kill bacteria, such as phagosome acidification (Westman and Grinstein 2021), modulation of metal cofactor and essential nutrients availability (Cassat and Skaar 2012; Sheldon and Skaar 2019), antimicrobial peptides (Risso 2000), as well as production of reactive oxygen (Fang 2011; Dupré-Crochet et al. 2013) and nitrogen species (Bogdan et al. 2000; Richardson et al. 2011). Among these, phagosomal killing is usually initiated through the generation of reactive oxygen species, resulting in the release of zinc from zinc metalloprotein complexes into cytoplasm (Andrews 2000; Botella et al. 2011), showing the interconnection between these two pathways. Knowing the already published functions of SprC and the novel targets and mechanisms uncovered in this study, it appears that the SprC so-called antivirulent function should not only be associated with in vivo assays on vertebrates but rather with a subtle regulation of several related functions such as its synergic effect on both oxidative (Le Pabic et al. 2015) and zinc stress responses. To what extent SprC expression variations significantly impact S. aureus adaptation to stress is still an open question. Although we know that SprC is under the tight control of the SarA transcription factor (Mauro et al. 2016), whether some other regulators participate in this coordinated network is still uncovered.
MATERIALS AND METHODS
Strains, plasmids, and growth conditions
Strains, plasmids, and primers are listed in Supplemental Tables S3–S5. Escherichia coli DH5α (Dower et al. 1988) was grown in Luria-Bertani (LB, Sigma) medium supplemented with ampicillin at 50 µg/mL, when necessary. All plasmids prepared from E. coli were transformed into S. aureus RN4220 (Kreiswirth et al. 1983), and then into S. aureus Newman (Duthie and Lorenz 1952). S. aureus strains were grown at 28°C or 37°C, 160 rpm, in brain heart infusion broth (BHI, Oxoid). When necessary, chloramphenicol or erythromycin were supplemented at 5 or 10 µg/mL.
MS2-affinity purification coupled with RNA sequencing
The sprC gene sequence was PCR amplified and cloned into a pRMC2 vector under the control of an Atc-inductible promoter (Corrigan and Foster 2009), leading to pRMC2-ms2-sprC. This construct allows the expression of SprC in fusion with MS2 RNA at its 5′ end. The MS2 aptamer was affinity-purified using an MBP-MS2 fusion protein preloaded on an amylose resin, allowing isolation of sRNA-target complexes (Lalaouna et al. 2018).
Overnight culture of Newman wild-type strains expressing MS2-SprC or MS2 tag alone (control) were diluted in BHI medium to an OD600nm of 0.05 and grown for 2.5 h at 37°C. Then, the expression of MS2-SprC or MS2 tag alone was induced with 1 µM of Atc and the cultures incubated for an additional 10 min at 37°C. Bacteria were centrifuged for 10 min at 13,000 rpm, 4°C, washed once with lysis buffer (0.5% SDS, 20 mM sodium acetate, 1 mM EDTA pH 5.5), resuspended in lysis buffer and mechanically disrupted three times using acid-washed glass beads (Sigma) in a FastPrep-24 5G instrument (MP Biomedicals) for 40 sec at power 6. Crude extracts were obtained after centrifugation for 1 min at 13,000 rpm to eliminate the beads, followed by ultracentrifugation for 10 min at 40,000g to pellet and remove bacterial cell debris.
All steps of MS2-affinity purification were performed at 4°C, as previously described (Lalaouna et al. 2018). First, amylose resin columns (150 µL/sample, New England Biolabs) were washed once with RNase DNase free water and three times with Buffer A (20 mM Hepes pH 7.5, 200 mM NaCl, 1 mM mgCl2, 1 mM β-mercaptoethanol, glycerol 5%), before the addition of 3000 pmol of MBP-MS2 protein (20pmol/µL final). Crude extracts were incubated 15 min into the column and placed in a Revolver Lab Rotator (Labnet). After 2 min of centrifugation at 13,000 rpm, supernatants (=Flowthrough) were collected to check the binding of the sRNA to the column. Then, the column was washed six times with 1 mL of Buffer A. Finally, RNAs were eluted (=Elution fraction) by extraction after adding 250 µL RNase DNase free water and 450 µL phenol pH4 directly on the column, followed by overnight precipitation with 0.1 volume of 3 M sodium acetate, three volumes of cold absolute ethanol and glycogen.
cDNA library construction and Illumina RNA sequencing
Total RNA obtained in the elution fraction was treated with Amplification Grade DNase I (Thermo Fisher) to remove genomic contaminations. The absence of DNA was checked by qPCR and RNA integrity assessed on a Bioanalyzer (Agilent). Stranded cDNA libraries were prepared using the NEBNext Ultra Directional RNA Library Prep Kit for Illumina (New England Biolabs), as previously described (Sassi et al. 2022). The concentration, quality, and purity of the libraries were determined using a BioAnalyzer, a Qubit Fluorometer (Invitrogen), and a NanoDrop spectrophotometer (Thermo Scientific). Libraries were sequenced on an Illumina MiSeq instrument (paired-end, 150 cycles), as per the manufacturer's instructions.
Reads mapping and analysis
The S. aureus Newman genome sequence and annotation file (in GFF format) were obtained from NCBI (ftp://ftp.ncbi.nlm.nih.gov/genomes/Bacteria/Staphylococcus_aureus_Newman_uid58839/). All sRNAs described in SRD (Sassi et al. 2015) for Newman strain were added to this GFF. Quality control of RNA-seq reads and read mapping was performed as previously described (Sassi et al. 2015). SAM files were filtered on bitwise FLAG values (Li et al. 2009) to select properly paired reads. Paired-end fragments were counted using HTSeq (Anders et al. 2015) for stranded library with the union mode. Differential expression was calculated using DESeq (Anders and Huber 2010) with the per-condition mode, a cutoff of two and a P-value adjusted for multiple testing <0.05.
RNA extractions and northern blots
Strains were precultured in BHI and incubated at 37°C, 160 rpm, overnight. Cultures were diluted to an OD600nm of 0.1, then incubated at 37°C under agitation and collected at various time points. Cell pellets were resuspended in 500 µL lysis buffer (0.5% SDS, 20 mM sodium acetate, 1 mM EDTA pH 5.5) and broken with acid-washed glass beads (Sigma) and phenol pH 4 in a FastPrep-24 5G instrument (MP Biomedicals) for 30 sec at a power of 6.5. Lysates were centrifuged at 13,000 rpm for 5 min at 4°C and total RNA extracted with phenol/chloroform/isoamyl alcohol (25:24:1), then with chloroform/isoamyl alcohol (25:24), and precipitated overnight at −20°C with 0.1 volume of 3 M sodium acetate and 0.7 volume of isopropanol. For northern blots performed in acrylamide gels, the sRNA was detected using the DNA probes listed in Supplemental Table S5. Total RNA (10 µg) was separated on denaturing 8% polyacrylamide/8M urea gel and transferred onto Hybond-N + membrane (Amersham) in 0.5× TBE buffer. The membranes were hybridized with specific γ32P-labeled probes in ExpressHyb solution (Clontech), washed, exposed, and scanned with a Typhoon FLA 9500 (GE Healthcare). For northern blots done in agarose gel, the target mRNAs were detected using DNA amplified sequences listed in Supplemental Table S5. Total RNA (15 µg) was separated on denaturing agarose gel 1% (1× MOPS, 2.2 M formaldehyde, 50% formamide) and transferred onto Nytran Hybond-XL membranes (Amersham) in 10× SSC. The membranes were hybridized with specific γ32P-labeled amplified DNA in ExpressHyb solution (Clontech), washed, exposed and scanned with a Typhoon FLA 9500 (GE Healthcare).
Reverse transcription and qPCR assays
Contaminating DNA was removed by DNase treatment (DNase amplification grade, Invitrogen), according to the manufacturer's recommendations. Two micrograms of RNA was used during the first strand cDNA synthesis using the High-Capacity cDNA Archive Kit (Applied Biosystems), following the manufacturer's instructions. Real-time quantitative PCR was performed using a Real Master Mix SYBR Kit (5′ PRIME, Life Technologies) on a StepOnePlus Real-Time PCR system (GE Healthcare). Supplemental Table S5 summarizes the primer pairs used to detect each transcript. The primer pairs were selected using Primer 3 software (http://frodo.wi.mit.edu/cgi-bin/primer3/primer3_www.cgi). Gene specificity of each primer pair was checked by comparing their sequences onto GenBank using BLASTN (http://www.ncbi.nlm.nih.gov/BLAST/). Using the comparative ΔΔCt method, the relative amount of target sequence in the samples was normalized to tmRNA or gyrB used as a reference gene.
In vitro transcription and RNA labeling
All the RNA constructs were transcribed from 1 µg of PCR-amplified DNA templates generated using S. aureus Newman genomic DNA. All forward primers contained a T7 promoter sequence upstream of the transcriptional start site (Supplemental Table S5). Amplicons were used as templates for transcription performed with a MEGAscript T7 kit (Ambion). RNAs were treated with Turbo DNase I before purification onto 5% or 8% denaturing PAGE (polyacrylamide gel electrophoresis), depending on the size of the RNA fragments to purify. The RNAs were eluted in a buffer containing Tris-HCl pH7.5 (20 mM), NaCl (250 mM), EDTA (1 mM) and 1% SDS, and then precipitated with cold ethanol and 0.3 M of sodium acetate. After a 5′ dephosphorylation of the RNAs with alkaline phosphatase, 5′-labeling of all the RNAs was performed using T4 polynucleotide kinase (New England Biolabs) and γ32P adenosine triphosphate (ATP).
Gel retardation assays and RNA mutations
For electrophoretic mobility shift assays (EMSA), target mRNAs and SprC were denatured in 80 mM Hepes (pH 7.5), 330 mM KCl and 4 mM MgCl2 for 2 min at 80°C, chilled on ice, and refolded for 20 min at room temperature (RT). For the binding assays between the RNAs, incubation lasted 30 min at 30°C. Fifty or 100 fmol of labeled SPRC was incubated with increasing amounts of each of the unlabeled mRNA in a final volume of 10 µL. To demonstrate specificity, an excess of cold SprC or polyuridine was added. The samples were supplemented with 10% glycerol and loaded on a 5% or 8% native polyacrylamide gel containing 5% glycerol. The electrophoresis was performed in 0.5× TBE at 4°C (100V) and the results analyzed on a Typhoon FLA 9500 (GE Healthcare). The apparent dissociation constant (Kd) was determined by comparing the unbound versus the shifted RNA complex bands (ImageQuant software), and the Kd was derived from the calculated concentrations at half-maximal binding.
To identify the “czrAB mRNA-SprC” and the “deoD mRNA-SprC” interacting domains, EMSA were performed with either the native RNAs or the RNA variants deleted for their predicted interaction domains. Therefore, we constructed SprCΔ27 and czrBΔ34, deleted for their putative interacting domains (ΔG66-A92 for SprC and ΔC864-A898 for czrB). For czrB, 50 fmol of labeled SprC (147 nt) was incubated with 3.75 to 15 pmol of czrB mRNA (312 nt) or czrBΔ29 (283 nt) RNAs. Also, 100 fmol of labeled czrB mRNA (312 nt) was incubated with either SprC (147 nt) or SprCΔ27 (120 nt) RNAs. For deoD, we incubated 50 fmol of labeled SprC (147 nt) or 50 fmol of SprCΔ27 (120 nt) with 8.75 to 70 pmol of deoD mRNA (774 nt).
Finally, for compensatory mutation experiments, we used either the native RNAs or RNA mutated variants. Therefore, we constructed SprC-mut (T78A, A79T, A80G, A84T, and A85T) and czrB-mut (T875A, T876A, T880C, T881A, and A882T), mutated for 5 nt within their putative interacting domains.
RNA half-life determinations
S. aureus was cultured overnight, diluted to an OD600nm of 0.1 and grown for 3 h in BHI medium supplemented with 3 mM ZnSO4. Rifampicin was added to a concentration of 200 µg/mL and bacterial growth extended from 1 to 90 min. Samples were collected before and after (1, 3, 5, 8, 12, 16, 20, 30, 60, and 90 min) rifampicin addition, then centrifuged, and the pellets stored at −80°C. RNAs were extracted and analyzed by northern blots, as described above.
FLAG integration at the czrB locus
To study the role of SprC on CzrB expression, we integrated a FLAG sequence at the 3′ end of czrB, upstream of the stop codon. The pIMAY vector was used to perform allelic exchange to replace the czrB gene by a czrB-Flag gene (Monk et al. 2012). Primers used to generate the construct are described in Supplemental Table S5. Recombinant plasmid was transformed into S. aureus Newman and Newman ΔsprC and incubated at 28°C. Double homologous recombination was performed as previously described (Monk et al. 2012), and positive clones were confirmed by DNA sequencing and qPCR to verify the absence of mutation and the correct transcription level of the czrB-FLAG gene, respectively.
Protein isolation, fractionation, and western blot
To prepare protein extracts, bacteria were grown for 2 h until the middle exponential phase before the addition of 5 mM ZnSO4 and reincubated for 4 h or 6 h. Cells corresponding to 10 units of OD600nm were harvested by centrifugation for 10 min at 4°C, 8000g. Cell pellets were resuspended with 1 mL of lysis buffer L and transferred into a FastPrep bead beater tube containing 500 µL of 0.1 mm glass beads. Disruption was done three times with a FastPrep instrument for 30 sec at a power of 6.5. Disrupted cells were centrifuged at 5000g for 2 min to pellet undamaged cells. The resulting supernatant was centrifuged at 50,000g for 40 min. The pellet including the cell wall and membrane protein fraction was resuspended into 25 µL of lysis buffer L containing 0.1 mg/mL lysostaphin. Following incubation at 37°C for 15 min, 25 µL of 2× Laemmli loading buffer was added. Samples were boiled for 5 min and centrifuged for 5 min at 13,000g. The resulting supernatants contained wall and membrane proteins. An identical volume of wall/membrane fractions was separated on SDS-PAGE gel and transferred onto a hybond-P PolyVinyliDene Fluoride (PVDF) membrane (Amersham). CzrB-FLAG protein expression was visualized with horseradish peroxidase-conjugated anti FLAG antibodies (Sigma Aldrich). The membrane was revealed using an ECL Prime Western Blotting Detection kit (Amersham) and scanned with an ImageQuant LAS 4000 (GE).
Zinc stress assays
Isolated colonies were suspended in BHI and incubated overnight at 37°C. The culture was diluted to an OD600nm of 0.1 in BHI, supplemented or not with 3 mM (for flasks assays), or stress with 5 mM of ZnSO4 after 2 h of growth (for microtiter plates assays), then incubated at 37°C under agitation. Flask samples were collected by centrifugation and the pellets stored at −80°C until RNA extraction. Microtiter plate cultures were monitored in a Synergy 2 Multi-Mode Reader (BioTek) at 37°C under continuous shaking and the absorbance measured at 600 nm every 10 min for 22 h.
Human macrophages production and phagocytosis assay
Human THP1 monocytes were obtained from ATCC and maintained at 37°C with 5% CO2 in RPMI 1640 (Invitrogen), containing 10% Foetal Calf Serum (Hyclone, FetalClone II, GE Healthcare). 107 THP1 cells were treated with Phorbol 12-myristate 13-acetate (120 ng/mL) (PMA, Sigma) for 3 days to stimulate their differentiation into macrophages. The THP1 monocytes were efficiently differentiated into adherent macrophages, as evidenced by light microscopy. The phagocytes were infected at an MOI of 10:1 (bacteria:macrophages) with S. aureus Newman in RPMI-1640, containing 5% human AB serum (hSAB, EFS Rennes) for 2 h at 37°C and 5% CO2. After three washes in phosphate-buffered solution (PBS) 1×, to eliminate extracellular bacteria, the cells were treated with 100 µg/mL gentamycin (Sigma) for 2 h at 37°C and 5% CO2. Cells were rewashed, lysed in PBS 1× containing 1% SDS for 10 min at RT, then centrifuged for 10 min at 4500 rpm, RT. The supernatant was eliminated, and the cell lysate was resuspended in RNA lysis buffer; then RNA extraction was performed as previously described (Raynaud et al. 2018).
Statistical analysis of the data
The Welch test, the Student t-test, and the Mann–Whitney test were performed as a function of experiments and data on at least three independent experiments to evaluate significance. The data were expressed as mean ± standard deviations (SD), and the test performed is mentioned in each figure legend.
DATA DEPOSITION
RNA-seq reads were submitted to SRA under BioProject accession number PRJNA926922.
SUPPLEMENTAL MATERIAL
Supplemental material is available for this article.
ACKNOWLEDGMENTS
This work is dedicated to the memory of our colleague Brice Felden who died unexpectedly on March 5, 2021 and was funded by the “Fondation pour la Recherche Médicale” (to S.R., FDM40912), the Agence nationale de la recherche (ANR) (ANR-15-CE12-0003-01), the Institut National de la Santé et de la Recherche Médicale (INSERM), and University of Rennes. We acknowledge the “plateforme Génomique Santé” Biogenouest Génomique Biosit core facility for their technical assistance.
Footnotes
-
Article is online at http://www.rnajournal.org/cgi/doi/10.1261/rna.080122.124.
- Received June 7, 2024.
- Accepted July 24, 2024.
This article is distributed exclusively by the RNA Society for the first 12 months after the full-issue publication date (see http://rnajournal.cshlp.org/site/misc/terms.xhtml). After 12 months, it is available under a Creative Commons License (Attribution-NonCommercial 4.0 International), as described at http://creativecommons.org/licenses/by-nc/4.0/.




