


NMDtxDB: data-driven identification and annotation of human NMD target transcripts
- 1Section of Bioinformatics and Systems Cardiology, Department of Internal Medicine III and Klaus Tschira Institute for Integrative Computational Cardiology, Heidelberg University Hospital, 69120 Heidelberg, Germany
- 2DZHK (German Centre for Cardiovascular Research), Partner site Heidelberg/Mannheim, 69120 Heidelberg, Germany
- 3Institute for Genetics, University of Cologne, 50674 Cologne, Germany
- 4Center for Molecular Medicine Cologne (CMMC), University of Cologne, 50674 Cologne, Germany
- Corresponding author: christoph.dieterich{at}uni-heidelberg.de
-
Handling editor: Maria Carmo-Fonseca
Abstract
The nonsense-mediated RNA decay (NMD) pathway is a crucial mechanism of mRNA quality control. Current annotations of NMD substrate RNAs are rarely data-driven, but use generally established rules. We present a data set with four cell lines and combinations for SMG5, SMG6, and SMG7 knockdowns or SMG7 knockout. Based on this data set, we implemented a workflow that combines Nanopore and Illumina sequencing to assemble a transcriptome, which is enriched for NMD target transcripts. Moreover, we use coding sequence information (CDS) from Ensembl, Gencode consensus Ribo-seq ORFs, and OpenProt to enhance the CDS annotation of novel transcript isoforms. In summary, 302,889 transcripts were obtained from the transcriptome assembly process, out of which 24% are absent from Ensembl database annotations, 48,213 contain a premature stop codon, and 6433 are significantly upregulated in three or more comparisons of NMD active versus deficient cell lines. We present an in-depth view of these results through the NMDtxDB database, which is available at https://shiny.dieterichlab.org/app/NMDtxDB, and supports the study of NMD-sensitive transcripts. We open sourced our implementation of the respective web-application and analysis workflow at https://github.com/dieterich-lab/NMDtxDB and https://github.com/dieterich-lab/nmd-wf.
Keywords
- nonsense-mediated RNA decay
- mRNA decay
- computational workflow
- alternative splicing
- premature stop codon
INTRODUCTION
Eukaryotic gene expression is a regulated process that culminates in the production of a messenger RNA (mRNA) that serves as a template for protein synthesis. Pre-mRNA undergoes cotranscriptional processing like capping, splicing, and polyadenylation before becoming mature mRNA (Moore and Proudfoot 2009). In the cytoplasm, mature mRNAs are translated into proteins by ribosomes. In this context, quality control mechanisms ensure mRNA production fidelity, and the nonsense-mediated mRNA decay (NMD) is central to this process. This pathway identifies and degrades mRNA with premature termination codons (PTCs), hence preventing translation of truncated protein products. Dysregulation of the pathway has been extensively implicated in deleterious cellular outcomes and, consequently, human disease (Kato et al. 2020; Fomin et al. 2021). PTC can arise from various causes, including DNA mutations or alternative splicing events (Han et al. 2007; Mort et al. 2008). Despite the relevance of this pathway to RNA biology, representation of NMD transcripts in genome annotation projects, such as the Ensembl database, is incomplete.
The primary mechanism for NMD activation is described by the exon-junction complex (EJC)-dependent model. The EJC is a protein complex deposited around 22 nt upstream of exon-exon junctions after splicing. During translation, all EJCs are normally displaced from the transcript by the ribosome, since stop codons are usually located in the last exon. However, when ribosomes terminate translation at a PTC, which is defined as being located more than 50 nt upstream of the last exon-exon junction, any downstream EJC remains bound to the transcript. Consequently, the presence of residual EJC components downstream from terminating ribosomes is a strong determinant for activating NMD. This activation involves the SMG1-dependent phosphorylation of UPF1, which is the starting point for the decay process. Hyperphosphorylated UPF1 engages with both the SMG6 and SMG5/SMG7 complex. SMG5/SMG7 enable the endonuclease activity of SMG6 (Boehm et al. 2021), which cleaves the mRNA near the PTC site, allowing for rapid degradation of the decay intermediates by exonucleolytic factors. Therefore, NMD activation results in rapid mRNA decay and depletion of potentially toxic RNA entities. Other models for pathway activation are an active area of study (Nagy and Maquat 1998; Fatscher et al. 2014). Genome annotation projects such as Ensembl are the primary source for the annotation of NMD targets. As stated above, the primary rule states that an EJC situated more than 30–35 nt downstream from a translation termination codon triggers NMD (Lindeboom et al. 2016, 2019; Teran et al. 2021). This basic 50 nt rule, representing the distance of the last exon-exon junction to the PTC, is currently applied in databases such as Ensembl to annotate transcripts and genomic variants that trigger or escape the pathway. However, these sources are insufficient and do not keep pace with the recent surge in the discovery of novel transcript isoforms identified by RNA long-read technologies. While databases housing information on nonsense mutations are widely available, databases for splicing events that lead to NMD activation are rare. Furthermore, even though the number of data sets used to study NMD-depleted conditions is increasing, obtaining specific isoforms that are targeted by NMD is a challenging task.
Here, we present our detailed transcriptome analysis using short- and long-read sequencing of four human cell lines across control and conditions, which deplete three NMD key factors: SMG5, SMG6, or SMG7. In addition, we introduce a computational workflow to predict NMD-sensitive transcripts from these libraries and annotate their PTC status. Finally, we integrate these results into a database, NMDtxDB, which is equipped with an intuitive web interface that allows researchers to interpret the NMD status of a given transcript in the context of the expression and transcript structure features.
RESULTS
Data sets and data resources
NMDtxDB includes data from RNA libraries of four cell lines. A total of 54 libraries were sequenced using Illumina short-read technology, in biological triplicates, including controls and samples with knockdown (KD) or knockout (KO) of targeted NMD factors. Additionally, the HEK_SMG7KO_SMG6KD_Z245 group was sequenced with four biological replicates for both treatment and control conditions using Nanopore direct RNA long-read sequencing (DRS). Table 1 provides detailed information about the data set.
Description of the RNA-seq data sets used in NMDtxDB
De novo transcriptome assembly
We developed a reference-guided transcriptome assembly workflow using StringTie (Shumate et al. 2022) to detect transcript isoforms present in NMD-depleted conditions. The reconstruction of RNA isoforms based on RNA-seq reads and reference transcript assembly poses several challenges that affect the quality of the resulting transcriptome. The first challenge is the relatively short length of read fragments obtained with Illumina sequencing, which often leads to an ambiguous transcript match. A second challenge is establishing parameters that eliminate potentially cryptic transcripts, transcripts that are usually associated with low abundance. In the following, we describe how we approach these challenges.
Nanopore direct RNA-seq data improves the guided assembly approach in two key aspects. It provides longer sequencing reads that allow for the reconstruction of multiple exon-exon chains. Second, it improves the confidence in calling lowly abundant transcripts because it produces a second and complementary view of the transcriptome.
Additionally, we have optimized transcriptome assembly parameters using the CHESS database (Pertea et al. 2018). CHESS was compiled from thousands of RNA-seq samples from the GTEx consortium (GTEx Consortium 2015). We provide respective details in the Materials and Methods section.
As a result of the transcriptome assembly workflow across four cell lines and multiple conditions, we compiled a transcriptome with 302,889 transcripts in 58,006 genes. Of note, 83,411 (27.5%) transcripts of the final transcriptome have support from Nanopore DRS. For HEK_SMG7KO_SMG6KD_Z245, sequenced by both Illumina and Nanopore DRS, 76,621 transcripts out of 256,573 (29.9%) have long-read support (LRS).
In NMDtxDB, we categorized transcripts into four classes based on GffCompare class codes using Ensembl genome GRCh38.p13 v102 as reference (Yates et al. 2020). Transcripts that have an intron chain match (class code =, same_intron_chain) are considered as reference transcripts. All other transcript codes are considered novel. Splicing variants share at least one exon-exon junction with reference transcripts, indicating variations in isoform structure (class codes c, j, or k). These four types of reference matches are detailed in the Materials and Methods section. Transcripts with an intron retention event in comparison to a reference transcript were annotated as IR (class code n). Transcripts matching to any other class code were classified as other, and are potentially cryptic isoforms. This classification system provides insight into the transcriptome's complexity of cell lines depleted for NMD factors. The distribution of transcripts grouped by reference match per LRS is shown in Figure 1.
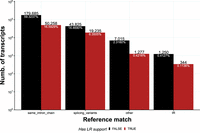
Distribution of transcript by reference match and LRS. Most transcripts (75.9%) match the reference annotation, followed by transcripts that are splicing variants of known transcripts, other transcripts that do not share features with known transcripts and transcripts that present intron retention.
Identification of coding sequences and PTC status
Stop codon positions are prerequisites for determining a transcript PTC status. Our methodology involves the integration of three sources of coding sequence information (CDS), which are listed in Table 2. The corresponding workflow is presented in the Materials and Methods section. Overall, 102,796 (33.9%) transcripts belong to the same_intron_chain class and match an annotated CDS. We annotated other transcript classes by start codon projection on transcripts from at least one of the sources in Table 2. Overall, this strategy resulted in CDS annotations for 139,438 (46.0%) transcripts.
CDS databases used in NMDtxDB
We then applied the 50 nt rule to predict PTC status after matching transcripts to putative CDS. Based on this approach, we detected PTC in 48,213 transcripts. The breakdown of the PTC per coding sequence is detailed in Figure 2. In addition, we observed a total of 9419 PTC transcripts with LRS.
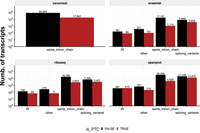
Overview of the transcript-to-CDS matches in NMDtxDB. If transcripts in the transcriptome match to mRNA in the Ensembl annotation, we name these matches as canonical. For novel transcripts or not annotated as mRNA, we use the start codon information from the sources to find a CDS. These may provide multiple CDS per transcript; however, if the CDS is identical, we keep a single hit. The is_PTC flag is TRUE if the distance from the stop codon and the last EJC exceeds 50 nt. Of note, the transcripts in the same_intron_chain class have proportionally less PTC calls for all sources. In contrast, the splicing_variants class has a similar number of transcripts with and without PTC for the riboseq and openprot sources.
Differential gene and transcript expression analysis
Beyond PTC status, another feature that distinguishes NMD targets is differential expression under NMD factor depletion. NMDtxDB provides this information both at the gene and transcript levels. For each contrast and gene or transcript, the expression of that entry is compared to the global expression bar plot and colored accordingly. Based on the transcript filtering criteria described in the Materials and Methods section, in total, 16,812 genes were tested for differential gene expression (DGE). Figure 3 shows a meta-analysis of the DGE comprising the nine comparisons based on MetaVolcanoR (Prada and Nakaya 2019). Colored dots represent the top 1% genes, ranked by the TopConfect method (Harrison et al. 2019), highlighting that the majority (80.0%) of regulated genes are upregulated, with log2 change (L2FC) > 1. Out of the 2177 genes that were called significantly DGE (adjusted P-value < 0.05 and |L2FC| > 1), 1266 have a sign consistency in L2FC higher than |5|, meaning the effect size direction was consistent in six or more comparisons. Up-regulation of NMD target transcripts in NMD-depleted conditions largely contributes to the observed asymmetric gene regulation shown in Figure 3.
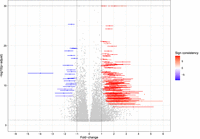
Meta-analysis of the DGE. The analysis of gene expression was conducted using the MetaVolcano package, wherein Fisher's method and random effect model were used to summarize each gene's adjusted P-value and L2FC, respectively, for the nine contrasts. The top 1% genes, ranked by the TopConfect method, are colored, and the color map represents the direction of change and degree of consistency obtained for the effect size of each gene. This approach summarizes all relevant comparisons (NMD vs. control) in the data set. Genes with −log10 adjusted P-value > 30 were set to that threshold to improve visualization.
Table 3 details the number of genes and transcripts called significant for every single comparison. A total of 82,799 transcripts were tested for differential transcript expression (DTE) based on transcript prefiltering aiming to decrease FDR (Soneson et al. 2016).
Number of DGE and DTE calls in NMDtxDB
Next, we integrated the DTE effect sizes with the predicted PTC status to further explore the significance of the 50 nt rule based on our annotation pipeline. We considered all information from the aforementioned CDS sources and called a transcript PTC-containing if at least one source indicated that a PTC occurred. Figure 4 illustrates the differential expression patterns of transcripts as stratified by PTC status. Consistent with our expectations, cell lines subjected to NMD factor depletion exhibit a marked up-regulation of transcripts that are annotated with a PTC. This is evidenced by a right shift in the median effect size of PTC-harboring transcripts relative to their PTC-lacking counterparts. Notably, the plot also conveys the impact of NMD depletion across the various conditions examined. In particular, the HEK cell lines with SMG5 KD (clone Z023) display the smallest effect, as indicated by the proximity of the median expressions for the two groups of transcripts. Supplemental Table S1 contains tables for the top, as well as the complete set of significant genes and transcripts.
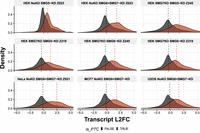
Distribution of DTE effect size by PTC status. Each facet shows for each comparison the distribution of L2FC (x-axis) and the density (y-axis) for two groups of transcripts (PTC-harboring or not). Only transcripts with a CDS match and adjusted P-value < 0.05 for the DTE are shown. Transcripts are colored by any evidence of PTC, based on any PTC annotation for multiple CDS. Dashed vertical lines represent the median L2FC grouped by PTC status.
NMDtxDB web-interface
All of the aforementioned results are accessible via the NMDtxDB web-interface, which is simple to use, designed for a broad audience, and enables fast information retrieval. The interface is organized into two sections: a sidebar that harbors the selection logic and a main panel that offers either a gene- or transcript-centric view. Moreover, links to Ensembl and UniProt databases, as well as the UCSC Genome Browser, are available. Figure 5 shows transcript-specific information on SRSF2 as an example.
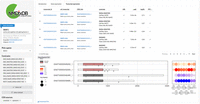
NMDtxDB transcript expression view. On NMDtxDB, each view is unified by gene. The sidebar comprises the Gene Information card, followed by the user input for gene, contrast and CDS source. The main panel contains two elements. On the top, a dynamic table listing each transcript-to-CDS match, one entry for each selected contrast, if the transcript was selected for the DTE test. On the bottom, a plot showing the structure for each transcript-to-CDS pair, and a dot plot showing L2FC and the adjusted P-value for each selected contrast. The URL at the transcript ID and the CDS ID link to a track hub at the UCSC Genome Browser for that transcript or CDS coordinates. The URL at the transcript name links to the Ensembl transcript page, and the type of match to the reference is detailed below. Each element of the user interface is detailed by the tutorial, and column headers show description on hover. In this example, we show SRSF2, a well-described NMD target. It shows visually that the two transcripts SRSF2-204 and SRSF2-208 are up-regulated six comparisons. The transcript structure without introns shows the relative CDS position, which indicates which exons and exon-exon junctions are downstream from the stop codon.
We also provide gene annotation information in NMDtxDB as genome browser tracks. Links within the application point to the UCSC Genome Browser website and automatically load the NMDtxDB TrackHub. This hub consists of the CDS annotation and PTC status for transcripts-to-CDS matches. CDS sources were grouped together for an easier comparison. In addition, coverage tracks are available for a subset of the samples in the data set. Figure 6 exemplifies the TrackHub view for the SRSF2 gene.
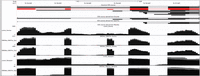
TrackHub view for the SRSF2 gene. The hub comprises the transcriptome assembly and coverage of selected RNA libraries that were aggregated. Transcript-to-CDS matches from the same source were grouped to facilitate interpretation. As part of the UCSF Genome Browser, this hub can be used in addition to any other hub, facilitating data integration.
Figure 7 showcases the onboarding process for NMDtxDB, initiated through a dedicated button on the sidebar's lower section. The process is designed to teach users how to use each application component and how to interpret data analysis. It guides users to effectively explain the NMDtxDB's features. The interface highlights interactive features like download options and selection input to enhance user navigation. Moreover, detailed explanations appear when hovering over table column headers. Finally, users can download tables and plots based on the current selected view.
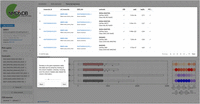
NMDtxDB tutorial. The tutorial serves as onboarding for new users. Each element of the user interface is highlighted and explained.
DISCUSSION
In this manuscript, we presented a data set, a workflow, and a database providing an easy-to-access perspective on NMD-sensitive transcripts with an emphasis on alternative splicing. We used Illumina and Nanopore DRS to assemble a transcriptome of NMD factor depleted cell lines. In this work, we combined the two sequencing strategies to better characterize the NMD-sensitive transcriptome. For example, in NMDtxDB, we flagged which transcript structures had support from long reads, providing information for transcript prioritization in further analysis. A PCR-based approach has been reported providing Nanopore sequencing from cells depleted of NMD factors, showing no effect of 3'UTR length and a NMD-eliciting effect of upstream ORFs (Karousis et al. 2021). By selecting all Ensembl transcripts that do not have PTC in the NMDtxDB data set, and comparing their UTR length across three categories, significant up-regulation, down-regulation and unchanged expression in NMD, we observed a shorter median 3′ UTR (Wilcoxon rank sum test P-value < 0.05) when comparing up-regulated to unchanged transcripts (Supplemental Table S2). We then used publicly available data sets to annotate CDS regions in our transcriptome. This workflow is based on two databases of coding sequences in addition to the state-of-the-art Ensembl database: (1) OpenProt uses the PRIDE archive to find evidence for alternative proteins by reanalyzing published mass spectrometry data sets (Brunet et al. 2021). (2) GENCODE Ribo-seq ORFs is a community-driven initiative that created a consensus set of translated open reading frames from seven Ribo-seq experiments (Mudge et al. 2022). These data resources led to the discovery of 9823 novel transcripts containing PTC. Once the stop codons are experimentally validated, these transcripts can provide valuable insights into the NMD regulatory pathway by revealing potential novel NMD-sensitive transcripts that originate from alternative splicing events or transcripts currently annotated as noncoding.
We also conducted a comparison between our NMD factor depletion approach and more recent approaches studying the NMD pathway. For the NMDtxDB data set, we used siRNA-derived KD for SMG5, SMG6, and SMG7 combined with SMG7 CRISPR–Cas9 KO. More recent approaches use pharmacological inhibition of SMG1 or targeted depletion of UPF1 protein levels. These newer approaches aim to limit the secondary effects on the transcript expression, due to, for example, down-regulation of RNA binding proteins, which occurs on sustained depletion of NMD factors. By comparing significant hits of DGE and DTE methods of the reference transcriptome (GENCODE) between the HEK cell lines and the said data sets, we obtained a high Pearson's correlation coefficient (R2 > 0.7) of the log2 fold change in all comparisons (Supplemental Fig. S1). We conclude that these different perturbation approaches lead to consistent changes in the transcript of the analyzed data set, specifically in terms of log2 fold changes of genes and transcripts. This analysis has the limitation of not using the de novo transcriptome or publicly available data. We then reanalyzed a publicly available data set that used a SMG1i inhibitor on K562 cells (Zinshteyn et al. 2021) (PRJNA675773). Here, we applied the nmd-wf workflow to obtain the SMGi1-versus-DMSO contrasts, and demonstrated an increase in the enrichment of PTC containing transcripts (Supplemental Fig. S2). The limitation of the analysis of the PRJNA675773 data set is the absence of this cell line on the NMDtxDB transcriptome, and despite this limitation, Pearson's correlation coefficient among the NMDtxDB contrasts and K562_SMGi1-versus-DMSO ranged from 0.23 to 0.56. Thus, we demonstrated that the application of NMDtxDB to an external data set can be useful in terms of determining novel NMD-sensitive transcripts.
The Nanopore DRS shows only limited coverage of the novel transcriptome. The LRS column in the transcript view table identifies whether at least one primary alignment from the Nanopore DRS data supports that transcript. The transcripts for ZFAS1 and OGA shown in Figures 8 and 9 show no LRS. The absence of LRS for these transcripts is due to technical limitations such as lower throughput.
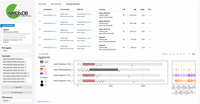
NMDtxDB page for ZFAS1, a known NMD target that is annotated as a noncoding gene. The transcript ENST00000371743 is annotated as lncRNA, but there is evidence for translation from the consensus Ribo-seq resource. In addition, this transcript is upregulated in multiple comparisons of cells depleted for NMD factors versus respective control conditions, as shown in the dot plot.
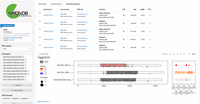
NMDtxDB page for OGA, a relevant metabolic enzyme that was recently described as an NMD target. In NMDtxDB, novel transcripts IDs are preceded by MSTRG, and can match to reference transcripts. MSTRG.3950.3 harbors a PTC derived from an OpenProt CDS source. This transcript is also significantly upregulated in three conditions.
A notable example of the utility of NMDtxDB is ZFAS1, a known NMD target that is currently annotated as a noncoding gene (Boehm et al. 2021). Figure 9 shows the NMDtxDB page for ZFAS1 and reports the up-regulation for a transcript that has evidence of PTC based on the GENCODE Ribo-seq CDS. NMD depletion results in higher expression levels of transcripts harboring PTC and, consequently, the genes comprising these transcripts. NMD activity is generally considered consistent across cells and tissues, yet its targets often include posttranscriptional regulators, which induce secondary effects in transcript expression. The expression changes in these regulators can alter the expression of downstream genes that do not contain PTC. Combining PTC annotations with expression data from NMD-depleted cells allows for improved annotation of NMD-sensitive transcripts. It is essential to describe these targets to have a more complete overview of the NMD transcriptome, with potential future applications. For another example, Figure 9 illustrates the NMDtxDB page for OGA. The OGA enzyme plays a significant role in energy metabolism pathways and has recently been identified as an NMD target associated with human disease (Li et al. 2021), which demonstrates the applicability of the database to human health.
In summary, the NMDtxDB user interface is broadly accessible, simple to use and combines detailed information on novel, NMD-sensitive transcripts along with their PTC status. In the future, we plan to extend this unique web resource with new data and modalities of NMD evidence once they become available, such as data from ribosome footprinting experiments or RNA fragments originating from endocleavage events (Schmidt et al. 2015; Boehm et al. 2016; Hoek et al. 2019). We also anticipate the use of machine learning methods to facilitate the sorting of NMD sensibly from transcripts that undergo changes due to off-target effects, which could further improve user-decision making and biological interpretation.
Given the open-source nature of the database, NMDtxDB can serve as a platform for a further examination and access to NMD transcriptomes, with the common objective of dissecting the pathway and examining its impact on human health.
MATERIALS AND METHODS
Cells lines, siRNA-mediated knockdown, and knockout cells using CRISPR–Cas9
Cell line handling and siRNA-mediated KD preparation are consistent with our previous work (Boehm et al. 2021). Flp-In-T-REx-293 (human, female, embryonic kidney, epithelial; Thermo Fisher Scientific), HeLa Tet-Off (human, female, cervical adenocarcinoma; Clontech), MCF7 (human, female, breast carcinoma; kind gift from Kay Hofmann, University of Cologne), and U2OS (human, female, osteosarcoma; kind gift from Kay Hofmann, University of Cologne) cells were cultured in high-glucose, GlutaMAX DMEM (Gibco) supplemented with 9% fetal bovine serum (Gibco) and 1× Penicillin Streptomycin (Gibco). The cells were cultivated at 37°C and 5% CO2 in a humidified incubator.
The Flp-In-T-REx-293 SMG7 KO cell lines were established and described previously (Boehm et al. 2021). Briefly, the CRISPR–Cas9 KOs used the Alt-R system (Integrated DNA Technologies) and reverse transfection of a Cas9:guideRNA ribonucleoprotein complex using Lipofectamine RNAiMAX.
For siRNA-mediated KD, the cells were seeded in 6-well plates at a density of 3 × 10⁵ cells per well and reverse transfected using 2.5 µL Lipofectamine RNAiMAX and 60 pmol of the respective siRNA, according to the manufacturer's instructions. In preparation for Nanopore direct RNA sequencing, 2.5 × 10⁶ cells were reverse transfected in 10 cm dishes using 6.25 µL Lipofectamine RNAiMAX and 150 pmol siRNA. The siRNA sequences were as follows: Luciferase 5′-CGUACGCGGAAUACUUCGA-3′; SMG5 5′-GAAGGAAAUUGGUUGAUAC-3′; SMG6 5′-GGGUCACAGUGCUGAAGUA-3′; SMG7 5′-CGAUUUGGAAUACGCUUUA-3′.
Table 4 compares the gene expression for genes targeted by KO and KD to the respective control condition. Genes targeted by siRNA show down-regulation of gene expression for respective sample. Note that SMG7 KO does not cause gene expression down-regulation, but disrupts mRNA translation, and so, protein expression (Boehm et al. 2021).
RNA library KD efficiency
RNA extraction, library preparation, and sequencing
Cells were harvested 72 h after siRNA transfection using peqGOLD TriFast (VWR Peqlab), and RNA was isolated following the manufacturer's instructions, using 150 μL 1-Bromo-3-chloropropane (Molecular Research Center) instead of 200 μL chloroform per 1 mL of TriFast. For Nanopore direct RNA sequencing, poly(A) enrichment was performed in two consecutive rounds using 100 µg of total RNA and 200 µL Dynabeads Oligo(dT)25 per sample (Thermo Fisher Scientific), following the manufacturer's instructions.
Illumina RNA sequencing
The library preparation was performed with the TruSeq mRNA Stranded kit (Illumina). After poly(A) selection (using poly-T oligo-attached magnetic beads), mRNA was purified and fragmented using divalent cations under elevated temperature. The RNA fragments underwent reverse transcription using random primers. This was followed by second-strand cDNA synthesis with DNA Polymerase I and RNase H. After end repair and A-tailing, indexing adapters were ligated. The products were then purified and amplified to create the final cDNA libraries. After library validation and quantification (Agilent TapeStation), equimolar amounts of library were pooled. The pool was quantified by using the Peqlab KAPA Library Quantification Kit and the Applied Biosystems 7900HT Sequence Detection System and sequenced on an Illumina NovaSeq6000 sequencing instrument and a PE100 protocol.
Nanopore direct RNA sequencing
Library preparation for Nanopore sequencing was carried out using the Direct RNA Sequencing Kit (SQK-RNA002) from Oxford Nanopore Technologies following manufacturer's guidelines. Sequencing was carried out on the GridION X5 platform as per manufacturer's guidelines using R9.4.1 flow cells.
RNA-sequencing read processing
Illumina reads preprocessing and alignment have been detailed previously (Boehm et al. 2021).
Nanopore DRS reads were base-called with guppy and aligned with minimap2 (Li 2021):
minimap2 -t 10 ‐‐MD -ax splice ‐‐junc-bonus 1 -k14 ‐‐secondary = no ‐‐junc-bed {junctions} -ub {minimap_index} {input}
All RNA-seq data sets were aligned against the Ensembl genome GRCh38.p13 (v102). We only considered autosomes or sex chromosomes for alignment. All features in other chromosomal regions were discarded after alignment.
Guided transcriptome assembly workflow
The workflow for identifying and annotating human NMD target transcripts relied on the Snakemake workflow management system. Snakemake provides a framework for modular, scalable, reproducible workflows (Köster and Rahmann 2012). The nmd-wf is available at https://github.com/dieterich-lab/nmd-wf under the MIT license. The transcriptome assembly was carried out in two stages, as only a subset of RNA samples was sequenced ONT-seq as well. In the first step, the reference transcriptome (Ensembl GRCh18 v102) was used as a guide to generate novel transcriptome annotations for pairs of samples with Illumina and Nanopore sequencing. StringTie was used with the parameters ‐‐mix and ‐‐rf to accomplish this. The merged GTF file from stage 1 was used as a guide to the second StringTie call for each Illumina sample. The resulting annotations were merged a last time. Annotation merge was conducted with stringtie ‐‐merge and min_iso_prop = 0.1 and min_cov = 3 parameters. The first stage used the reference transcriptome, while the second stage used the first stage merge as the guide parameter (-G). The reference gene and transcript names were as well the class codes and were obtained by running GffCompare against the reference annotation. Gffcompare assigns class codes to transcripts based on their relationship to reference annotations. The “=” class code indicates an exact intron chain match, although transcript start and end sites may differ to the reference transcripts. Splicing variants are grouped as follows: “c” for contained transcripts, “j” for those sharing at least one splice junction, and “k” for transcripts within an intron. The “n” class indicates intron retention. Other class codes are considered mostly irrelevant for splicing analysis and grouped in the other class.
Benchmarking assembly parameters versus CHESS
We optimized StringTie parameters by performing a grid search for a single sample (33G-30) and compared the assembly with GffCompare (Pertea and Pertea 2020). Based on the F1 metric, the mix preset obtained the highest score for the exon and intron feature level, while the conservative metric obtained the top for the transcript feature. We note that in terms of F1 metric, the highest source of decrease in score was the lack of guide (noguide preset) (Table 5).
Benchmark of sample 33G-30 versus CHESS
Matching long reads to transcripts
We mapped the DRS reads to the transcriptome to match the reads to the assembled transcriptome. The read alignment was computed with:
minimap2 -ax map-ont ‐‐sam-hit-only {transcriptome} {input} > {ouput}
Following the read alignment, our approach involved selecting primary alignments for the computation of transcript coverage. Primary alignments with 90% sequence coverage on read level were considered as evidence of LRS for that transcript as defined by BamSlam (Gleeson et al. 2021). Briefly, we aligned the long-read sequencing to the de novo transcriptome, so reads were mapped to transcripts. We discarded any reads that did not pass quality control or secondary alignments. Then we computed the read coverage for each alignment, considering and computing the alignment coverage based on the alignment CIGAR: (M + I)/(M + I + S + H). The transcript coverage was then defined by the ratio of alignment coverage and transcript length. Finally, we considered a transcript covered by ONT reads if at least one alignment covered over 90% of the transcript length.
Coding sequence curation
The database has two classes of CDS matches: canonical or from sources. For annotated transcripts that have CDS matches to the EnsEMBL database, we simply imported this information to the database. In NMDtxDB, this CDS source was named canonical.
To find matches for novel transcripts or transcripts without an annotated CDS, we applied a de novo discovery approach. This approach uses three databases of CDS: Ensembl, or Ribo-Seq ORFs and OpenProt, named ensembl, riboseq and openprot. First, we mapped the start codon from CDS sources from the genomic coordinates to the transcript coordinates. Next, we trimmed the transcript sequence from the start codon. We applied a modified version of the longorf.pl script (https://github.com/bioperl/bioperl-live/blob/master/examples/longorf.pl) to find the longest and complete, i.e., with canonical start and stop codons, CDS of each transcript. The coordinates of the two branches were then integrated. Duplicated CDS were dropped, and just one record was retained using the following ranking list: Ensembl, riboseq or openprot. The diagram in Figure 10 details this workflow.
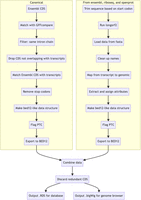
CDS integration workflow. The scheme shows the two branches of data processing for CDS integration. Database sources are described in Table 2.
If multiple distinct CDS occurred per transcript, they were reported. We compare these examples in Figure 11. It shows the canonical source as the primary source for CDS, followed by openprot. The combinations canonical + openprot, canonical + riboseq, canonical + ensembl, riboseq, and ensembl provide a similar order of magnitude of CDS-to-transcript matches. Of note, the plot highlights a higher LRS for combinations with a higher degree that comprise the canonical source, specifically columns 1–4. Heatmap and upset plot were created with the ComplexHeatmap package (Gu et al. 2016).
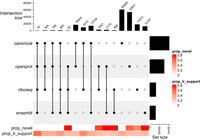
Distinct combination of CDS source per transcript. The plot compares the source of CDS per transcript, using combinations to show overlapping CDS sources per transcript. The color bar in the bottom shows, respectively, the proportion of novel transcripts or transcripts with LRS by combination.
Gene and transcript expression modeling
Salmon was used to compute gene and transcript expression, which was then summarized with tximport in the dtuScaledTPM mode (Soneson et al. 2015; Love et al. 2018). Transcripts were filtered using the DRIMSeq::dmFilter function with parameters of minimum gene expression of 10, minimum transcript expression of 1, and minimum transcript proportion of 0.10, resulting in 82,799 transcripts (16,812 genes). The remaining transcripts were discarded from further modeling. Gene counts were imported using tximport in the lengthScaledTPM mode; only genes containing transcripts that passed the transcript filtering were considered for downstream analysis.
The DEXSeq package was used to perform differential transcript usage analysis (Anders et al. 2012). The experiment was run with a treatment versus control design, as per the contrast listed in Table 1. The full model was defined as:
∼ sample + exon + group:exon
While the reduced model was defined as:
∼ sample + exon.
The DEseq2 package with an independent hypothesis weighting (IHW) correction was used to analyze the differentially expressed genes (Love et al. 2014; Ignatiadis et al. 2016). Genes were filtered using a minimum count threshold, with the row sum of counts in the dds object having to be ≥10 in at least three samples. The lfcShrink function from the ashr (Adaptive Shrinkage) package was used to obtain shrunken fold changes (Stephens 2017).
Database and web application
The web-application infrastructure is based on our previous work (Britto-Borges et al. 2022). In short, the Shiny web-application is hosted via the Open Analytics ShinyProxy server, in the demilitarized zone of the high-performance computer cluster at Heidelberg University Hospital's Klaus Tschira Institute for Computational Cardiology. The application is built with the Golem framework (https://github.com/ThinkR-open/golem), using ggplot2 (Wickham 2016) and ggtranscript (Gustavsson et al. 2022) for visualization. In contrast to our previous application, we replaced the PostgreSQL database by a docker checkpoint-restore system that improves user experience by reducing application loading times. Gene card information is obtained via the mygene REST API (Xin et al. 2016).
DATA DEPOSITION
Raw files for the RNA-sequencing are available at the Sequence Read Archive at https://www.ncbi.nlm.nih.gov/sra/PRJNA1054031. An archive of source code and databases is available at https://zenodo.org/records/10533763. Code for workflow and web-application is available at https://github.com/dieterich-lab/nmd-wf and https://github.com/dieterich-lab/NMDtxDB (MIT license).
SUPPLEMENTAL MATERIAL
Supplemental material is available for this article.
ACKNOWLEDGMENTS
We would like to express our gratitude to Harald Wilhelmi for his support with infrastructure and user experience optimization, Federico Marini for feedback on the user interface, and members of the Dieterich lab and anonymous testers for suggestions. We also thank the Cologne Center for Genomics, CCG, for preparing the sequencing libraries and operating the Illumina sequencer. Nanopore Next-Generation Sequencing was carried out at the West German Genome Center, Düsseldorf. This work was supported by the DFG Research Infrastructure West German Genome Center, project 407493903, as part of the Next-Generation Sequencing Competence Network, project 423957469. Christoph Dieterich and Niels H. Gehring received DFG grant nos. DI 1501/12-1, GE 2014/10-1 as part of the DFG Sequencing call no. 1.
Author contributions: T.B.-B.: conceptualization; data curation; formal analysis; investigation; methodology; software; validation; visualization; writing—original draft preparation and review and editing. N.H.G.: conceptualization; funding acquisition; resources. V.B.: conceptualization; data curation; investigation; resources. C.D.: conceptualization; funding acquisition; project administration; resources; supervision; writing—original draft preparation and review and editing.
Footnotes
-
Article is online at http://www.rnajournal.org/cgi/doi/10.1261/rna.080066.124.
-
Freely available online through the RNA Open Access option.
- Received April 19, 2024.
- Accepted July 11, 2024.
This article, published in RNA, is available under a Creative Commons License (Attribution-NonCommercial 4.0 International), as described at http://creativecommons.org/licenses/by-nc/4.0/.
REFERENCES
MEET THE FIRST AUTHOR

Meet the First Author(s) is an editorial feature within RNA, in which the first author(s) of research-based papers in each issue have the opportunity to introduce themselves and their work to readers of RNA and the RNA research community. Thiago Britto-Borges is the first author of this paper, “NMDtxDB: data-driven identification and annotation of human NMD target transcripts.” Thiago is a senior researcher in the Dieterich lab, part of the Klaus Tschira Institute for Computational Cardiology. As members of the department of Cardiology at Heidelberg University Hospital, research in the lab spans both basic and translational research in system cardiology, with a strong focus on RNA biology and bioinformatics.
What are the major results described in your paper and how do they impact this branch of the field?
The goal of the NMDtxDB project is to study the mRNA nonsense-mediated decay (NMD) pathway in context to RNA splicing changes. NMD is an intriguing regulatory mechanism as, despite the existence of a well-defined rule, known as the 50 nt rule, for mRNA targeting, there are secondary effects to NMD factor depletion and other regulatory targets. In addition, the pathway is relevant to human health and important for diseases like Duchenne muscular dystrophy. Our work has a threefold impact. First, it provides a new data set with four cell types depleted for three key proteins that are required for the NMD pathway activation. Secondly, it presents a computational workflow that describes the transcriptome of these cells, including transcripts not annotated by reference databases, and so revealing potential new NMD targets. This workflow is crucial for running statistical modeling and annotating PTCs. Finally, the results are presented in an easy-to-use web application, which also intends to attract researchers outside the RNA decay field. Our work also addresses some technical challenges, which will allow us to integrate data sets from different methods and laboratories in the future.
What led you to study RNA or this aspect of RNA science?
I have a long-standing interest in sequence analysis, a branch of bioinformatics that uses biological sequences for understanding RNA function. In that sense, studying the NMD pathway is particularly worthwhile because the 50 nt rule describes which mRNAs trigger the pathway activation. However, this rule does not explain all the changes in transcript expression we observe. This opens up opportunities for both bioinformatics methods development and further description of human diseases, such as heart failure.
If you were able to give one piece of advice to your younger self, what would that be?
Working hard seems to please others, but taking breaks can help you to work better in the long run. A scientific project is usually not a sprint.
What are your subsequent near- or long-term career plans?
I am a bioinformatician at a time when vast amounts of OMICs and clinical data are being produced and accessible to researchers. This is very exciting. However, there are many challenges to using such data sets, as they can be difficult to compare or have unaccounted for sources of variation. In addition, current methods cannot simply predict a class or output a number. Modern methods require explaining the results transparently. Thus, my career goal is to further develop in silico methods for dissecting and explaining molecular mechanisms or mechanisms of action that are relevant to human health, and hopefully help to improve patients’ lives.




