


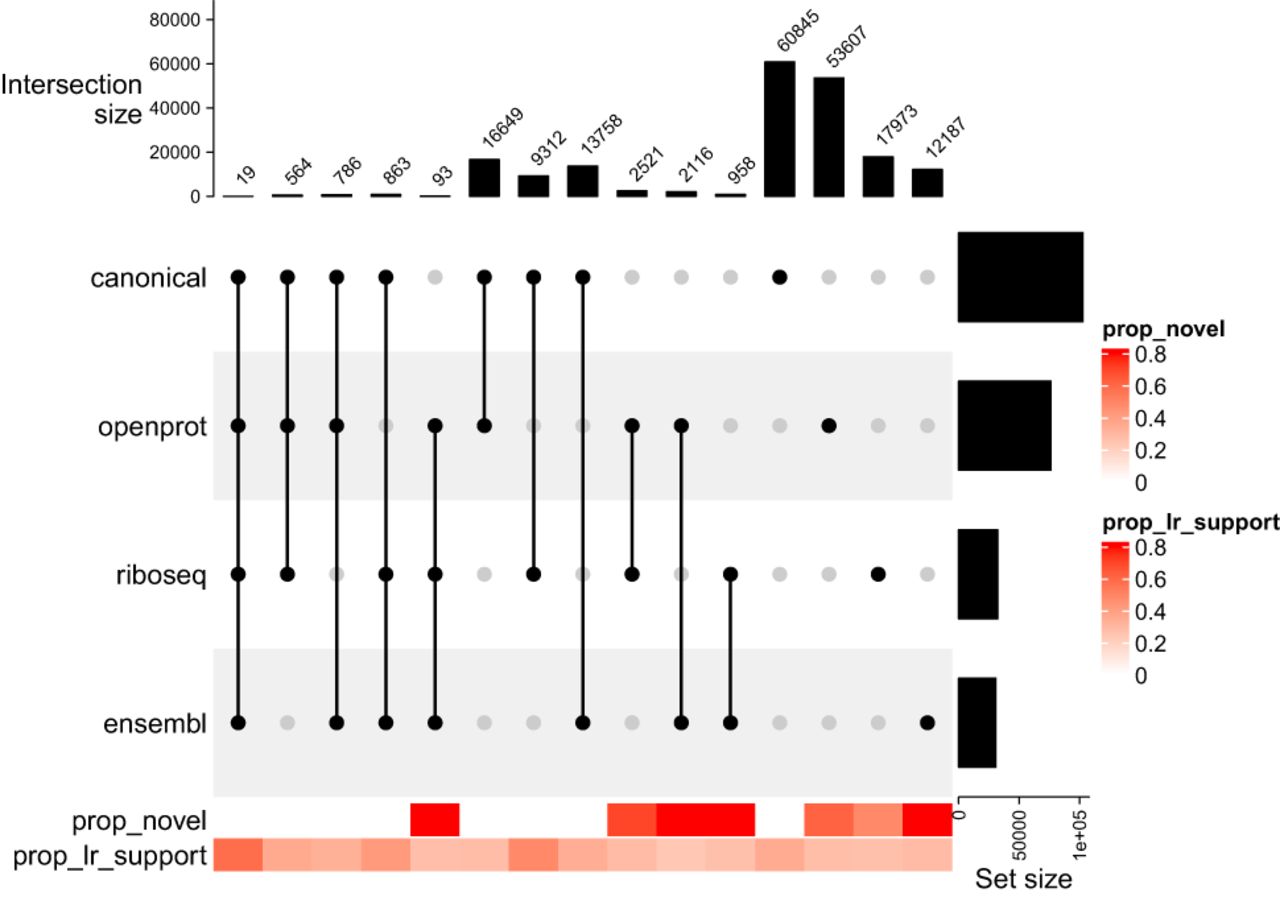
FIGURE 11.
Distinct combination of CDS source per transcript. The plot compares the source of CDS per transcript, using combinations to show overlapping CDS sources per transcript. The color bar in the bottom shows, respectively, the proportion of novel transcripts or transcripts with LRS by combination.




