


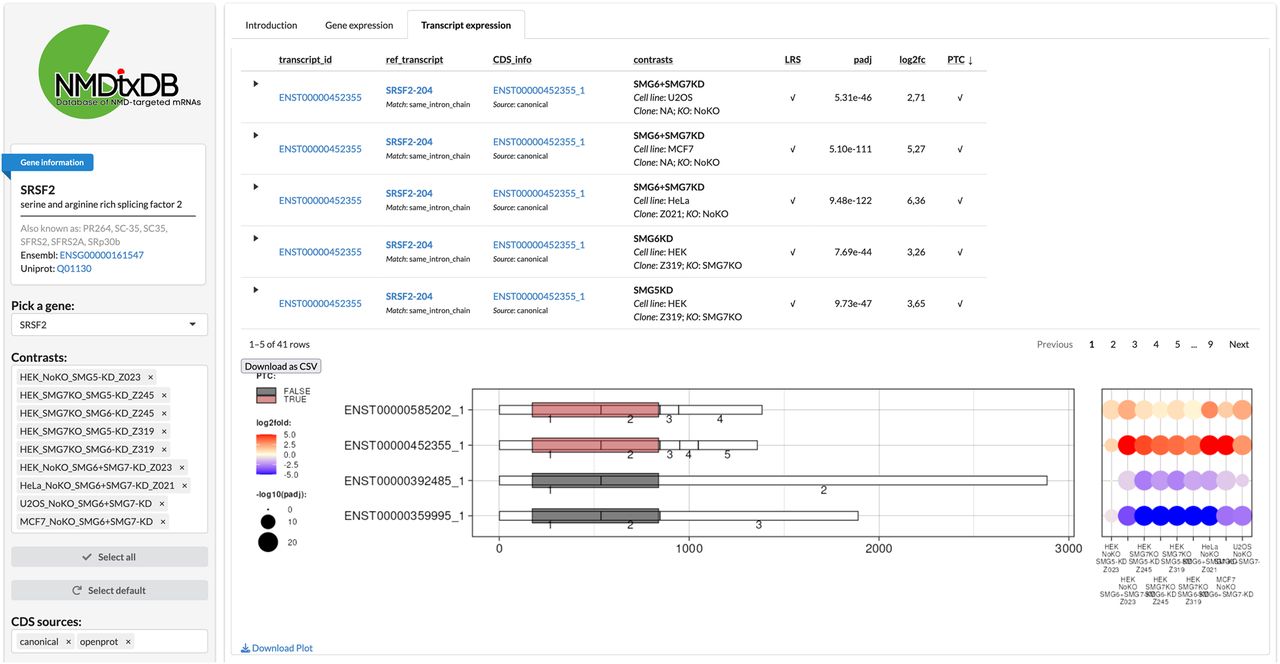
NMDtxDB transcript expression view. On NMDtxDB, each view is unified by gene. The sidebar comprises the Gene Information card, followed by the user input for gene, contrast and CDS source. The main panel contains two elements. On the top, a dynamic table listing each transcript-to-CDS match, one entry for each selected contrast, if the transcript was selected for the DTE test. On the bottom, a plot showing the structure for each transcript-to-CDS pair, and a dot plot showing L2FC and the adjusted P-value for each selected contrast. The URL at the transcript ID and the CDS ID link to a track hub at the UCSC Genome Browser for that transcript or CDS coordinates. The URL at the transcript name links to the Ensembl transcript page, and the type of match to the reference is detailed below. Each element of the user interface is detailed by the tutorial, and column headers show description on hover. In this example, we show SRSF2, a well-described NMD target. It shows visually that the two transcripts SRSF2-204 and SRSF2-208 are up-regulated six comparisons. The transcript structure without introns shows the relative CDS position, which indicates which exons and exon-exon junctions are downstream from the stop codon.




