


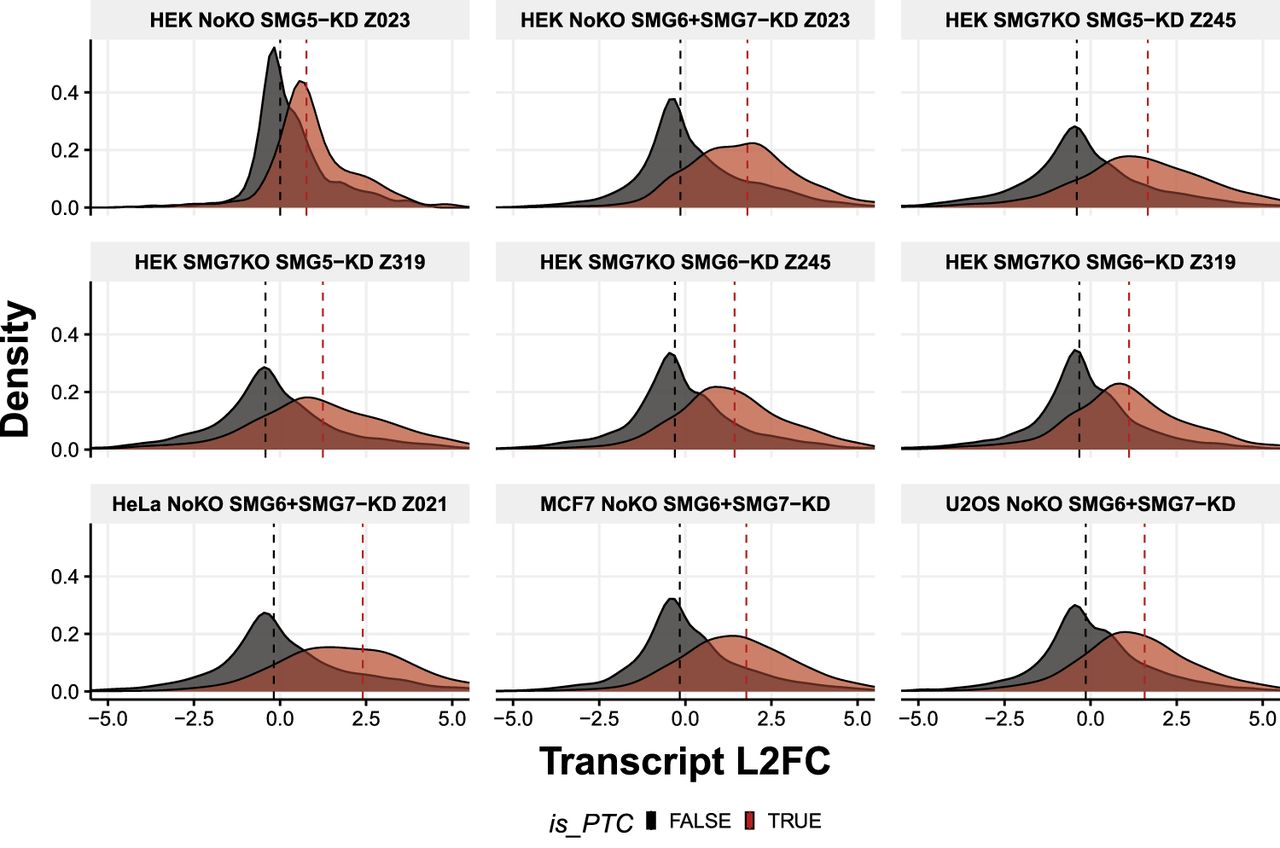
FIGURE 4.
Distribution of DTE effect size by PTC status. Each facet shows for each comparison the distribution of L2FC (x-axis) and the density (y-axis) for two groups of transcripts (PTC-harboring or not). Only transcripts with a CDS match and adjusted P-value < 0.05 for the DTE are shown. Transcripts are colored by any evidence of PTC, based on any PTC annotation for multiple CDS. Dashed vertical lines represent the median L2FC grouped by PTC status.




