


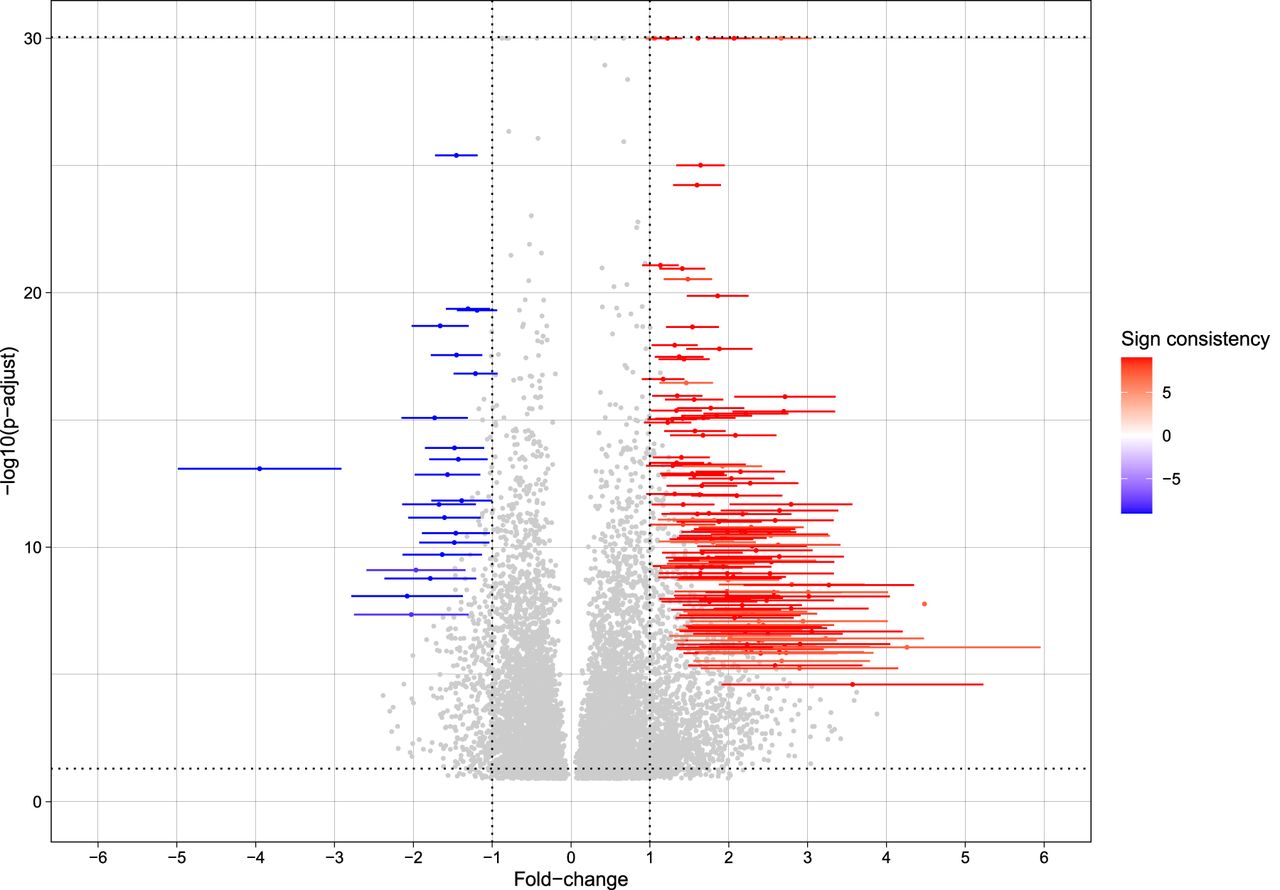
FIGURE 3.
Meta-analysis of the DGE. The analysis of gene expression was conducted using the MetaVolcano package, wherein Fisher's method and random effect model were used to summarize each gene's adjusted P-value and L2FC, respectively, for the nine contrasts. The top 1% genes, ranked by the TopConfect method, are colored, and the color map represents the direction of change and degree of consistency obtained for the effect size of each gene. This approach summarizes all relevant comparisons (NMD vs. control) in the data set. Genes with −log10 adjusted P-value > 30 were set to that threshold to improve visualization.




