


Fluorescent labeling of RNA and DNA on the Hoogsteen edge using sulfinate chemistry
- 1Department of Chemistry and Biochemistry, University of California, San Diego, La Jolla, California 92093, USA
- 2Department of Chemistry, Scripps Research, La Jolla, California 92037, USA
- Corresponding author: ntoor{at}ucsd.edu
-
↵3 These authors contributed equally to this work.
Abstract
We have devised a single pot, low-cost method to add azide groups to unmodified nucleic acids without the need for enzymes or chemically modified nucleoside triphosphates. This involves reacting an azide-containing sulfinate salt with the nucleic acid, leading to replacement of C–H bonds on the nucleobase aromatic rings with C–R, where R is the azide-containing linker derived from the original sulfinate salt. With the addition of azide functional groups, the modified nucleic acid can easily be reacted with any alkyne-labeled compound of interest, including fluorescent dyes as shown in this work. This methodology enables the fluorescent labeling of a wide variety of nucleic acids, including natively folded RNAs, under mild conditions with minimal effects upon biochemical function and ribozyme catalysis. To demonstrate this, we show that a pair of labeled complementary ssDNA oligonucleotides (oligos) can hybridize to form dsDNA, even when labeled with multiple fluorophores per oligo. In addition, we also demonstrate that two different group II introns can splice when prelabeled internally with fluorophores, using our method. Broadly, this demonstrates that sulfinate modification of RNA is compatible with ribozyme function and Watson–Crick pairing, while preserving the labile backbone.
Keywords
INTRODUCTION
Fluorescent labeling of nucleic acids is widely used in cell biology and biochemistry to tag RNA and DNA for determining cellular localization and in blotting techniques for detecting specific sequences (Rombouts et al. 2016; Miller et al. 2018; Baladi et al. 2021). Nucleic acids can be labeled using either chemical or enzymatic methods. Typically, short nucleic acids are fluorescently labeled during chemical synthesis. However, solid phase oligonucleotide (oligo) synthesis is limited to the modification of small nucleic acids; generally, no more than 150 deoxyribonucleotides with the phosphoramidite method and between 50 and 100 ribonucleotides for RNA (Flamme et al. 2019; Bartosik et al. 2020). In addition, direct synthesis of modified messenger RNAs (typically >1000 nt) is not currently possible using chemical methods. Long chemically modified RNAs are typically synthesized using T7 RNA polymerase in the presence of modified nucleoside triphosphates (NTPs). However, T7 RNA polymerase is not able to accommodate highly modified and/or bulky unnatural NTPs within the restrictive confines of its active site (Milisavljevič et al. 2018; Flamme et al. 2019; Klöcker et al. 2020). As a result, the diversity of modified RNA is limited by the enzymatic mechanism of T7 RNA polymerase. The low efficiency of incorporation of modified NTPs during in vitro transcription also results in exorbitant costs of synthesis. Modified NTPs are extremely expensive, and thus their low incorporation efficiency greatly increases the cost of synthesis for large-scale production of modified RNA. Therefore, there is a need for a low-cost and simple method for adding modifications to both large and small nucleic acids.
RNA poses unique challenges for chemical modification due to its relative lability compared to DNA. Unfortunately, many reactions used in synthetic organic chemistry would result in the RNA being destroyed due to the harsh conditions. For example, high temperatures, the presence of transition metal and lanthanide ions, and pH extremes are all known to degrade RNA (Dallas et al. 2004; Chatterjee et al. 2022). Here we demonstrate the chemical modification of nucleic acids, including RNA, with sodium difluoroalkylazidosulfinate (DAAS) under mild conditions (Zhou et al. 2013). Sulfinate salts are well-known for their ability to easily produce carbon-centered radicals under oxidative conditions (Langlois et al. 1991; Ji et al. 2011; Fujiwara et al. 2012a,b; O'Hara et al. 2013; Gianatassio et al. 2014; Gui et al. 2014). These radicals can react with heteroaromatic systems and lead to substitution of C–H bonds on the heteroarene with C–R, where R is the original organic functionality from the sulfinate salt (Fig. 1A,B). Many sulfinate salts are currently commercially available; however, DAAS is of particular interest because it adds a difluoroalkylazido group in which the terminal azide moiety can serve as a click chemistry substrate. Proteins and nucleic acids both contain heteroarenes that closely resemble the small-molecule substrates already known to react with sulfinate salts (Fig. 1C). However, only the labeling of proteins with sulfinate salts has been demonstrated (Fig. 1D; Ichiishi et al. 2018; Imiołek et al. 2018; Noisier et al. 2019; Kee et al. 2020). This work explores the use of DAAS to functionalize both DNA and RNA (Fig. 1E).
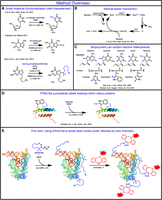
Method overview. (A) Examples of known reactivities of sulfinate salts with nucleobase and nucleobase-like heteroarene substrates. (B) The mechanism for the formation and addition of carbon-centered radicals onto heteroarene substrates using sulfinate salts. (C) Examples of potentially sulfinate-reactive aromatic groups found within proteins and nucleic acids. Examples of reactive C–H sites are indicated with blue arrows. (D) Previously published example of successful protein labeling with sulfinate salts. (E) Our two-step DNA/RNA labeling procedure proposed in this work.
RESULTS
Fluorescent labeling of a 60 nt ssDNA
In order to quantitate the amount of labeling as a function of DAAS concentration, a series of labeling experiments were conducted on a 60 nt sequence of ssDNA taken from a segment of the Oceanobacillus iheyensis (O.i.) group II intron sequence (Toor et al. 2008). This sequence was chosen such that the oligo would be unlikely to form any significant secondary structure. Labeling reactions were performed at 10 mM, 20 mM, and 40 mM DAAS, along with a control that included all other reaction components except DAAS (referred to as the 0 mM DAAS control). Reactions included twofold molar equivalents, relative to the DAAS concentration, of sodium cacodylate, pH 6.5 (for keeping the pH stable), and tert-butyl hydroperoxide (TBHP) as the oxidant for producing radicals. DAAS labeling reactions were run at room temperature for 2 h. Each sample was then purified, followed by an overnight strain-promoted azide–alkyne cycloaddition (SPAAC) reaction using excess AZ680-DBCO dye. After all samples were purified from unreacted free dye, UV/Vis spectra were measured and a peak at 680 nm was evident. This peak became proportionally larger for samples that were labeled with higher DAAS concentrations (Fig. 2A). Importantly, the 0 mM DAAS control did not show any noncovalent dye binding. The 680 nm peak seen on the dye-labeled DNA samples corresponds to the peak observed in the UV/Vis spectrum of the free dye (Fig. 2B). The average number of conjugated fluorophores per 100 nt was derived from the A680 value, and this increased linearly when plotted against DAAS concentration used for labeling (Fig. 2C). Henceforth, “labeling percentage” will refer to the average number of conjugated fluorophores per 100 nt.
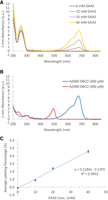
(A) UV/Vis spectra of the AZ680-DBCO labeled 0 mM, 10 mM, 20 mM, and 40 mM DAAS ssDNA1 samples. (B) UV/Vis spectra of free AZ680-DBCO and AZ488-DBCO dyes. (C) Plot of average labeling percentage versus concentration of DAAS used to label the ssDNA1 substrate. Error bars indicate standard deviations for n = 3 independent replicates.
Dye-labeled ssDNA hybridization assay
We hypothesized that the fluorescently labeled 60 nt ssDNA oligo would still retain the ability to engage in Watson–Crick pairing given that the modifications are largely on the Hoogsteen edge. To test this, samples of an 80 nt ssDNA oligo were labeled at the same DAAS concentrations used for the original 60 nt oligo (henceforth referred to as ssDNA1). This 80 nt oligo (henceforth referred to as ssDNA2) was designed such that the first 60 nt of its sequence were directly complementary to the entire ssDNA1 sequence. The 20 nt overhang on the 3′-end of ssDNA2 was not complementary to the sequence on ssDNA1 and was added to give ssDNA2 a unique gel mobility relative to ssDNA1. After DAAS labeling, ssDNA2 was clicked with AZ488-DBCO dye (Fig. 2B) in an identical manner to the AZ680-DBCO click reaction for ssDNA1. To visualize the gel mobility of the oligos separately before attempting to hybridize them, all dye-labeled ssDNA1 and dye-labeled ssDNA2 samples were run on denaturing PAGE, alongside unlabeled controls. This gel was imaged before and after ethidium bromide (EtBr) staining, using a series of different filters. Visualizing the gel under UV after EtBr staining reveals all DNA bands at the same time (Fig. 3A). The dye-labeled samples appear as ladders of several bands, representing different modification stoichiometries. Considering that sulfinate labeling is a stochastic process, the presence of multiple bands indicates a separation between oligos containing 1, 2, 3… dye molecules per DNA molecule. The dye-labeled ssDNA1 samples appear to have weaker band intensity than the dye-labeled ssDNA2 samples because of a unique EtBr quenching effect that is present with AZ680-DBCO dye. We suspect that the emission maximum of EtBr lying close to the absorbance maximum for AZ680 results in the dye reabsorbing many of the photons emitted by the EtBr fluorescence, thus lowering the apparent EtBr signal. However, imaging the same gel before EtBr staining revealed the signal solely from the fluorescent dyes, without EtBr interference (Fig. 3B,C). Two different lasers were used to separately excite each dye, eliciting a corresponding fluorescence signal from the dye-labeled ssDNA1 and dye-labeled ssDNA2 molecules within the gel. The absence of any signal from the 0 mM DAAS control lanes for either ssDNA1 or ssDNA2 indicates the lack of noncovalent dye binding. The number of bands, along with the intensity of higher order bands, increases for each of the dye-labeled samples as a function of DAAS concentration, indicating higher average labeling percentage values. It is interesting to note that all dye-labeled ssDNA1 and dye-labeled ssDNA2 samples appear highly colored to the naked eye, giving a strong visual indication of their labeling extent (Fig. 3D). Though all dye-labeled ssDNA1 and dye-labeled ssDNA2 samples discussed in this work were labeled with either AZ680-DBCO or AZ488-DBCO, respectively, labeling experiments with the dyes swapped (AZ488-DBCO for ssDNA1, AZ680-DBCO for ssDNA2) were also conducted and run alongside the original labeled oligos and unlabeled controls to compare mobility shifts between the two dyes (Supplemental Fig. S1). Overall, the gel mobility ladder effect on the dye-labeled oligos was largely the same between the two fluorophores tested, with AZ680-DBCO producing slightly larger spacings than AZ488-DBCO.
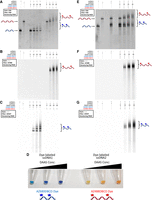
(A) Denaturing PAGE of the dye-labeled ssDNA1 and ssDNA2 samples, along with unlabeled controls. This gel was EtBr stained and imaged with an EtBr filter. (B) The same gel as in A, before EtBr staining, viewed using a laser/filter combination for Alexa Fluor 488 (used for imaging AZ488 fluorescence). (C) The same gel as in A, before EtBr staining, viewed using a laser/filter combination for Alexa Fluor 647 (used for imaging AZ680 fluorescence). (D) Picture of solutions containing the dye-labeled ssDNA1 and ssDNA2 samples in order of increasing DAAS labeling percentages. (E) Denaturing PAGE of mixtures of the dye-labeled ssDNA1 and ssDNA2 samples, along with unlabeled controls. This gel was EtBr stained and imaged with an EtBr filter. (F) The same gel as in E, before EtBr staining, imaged for AZ488 fluorescence. (G) The same gel as in E, before EtBr staining, imaged for AZ680 fluorescence. Note for (E–G): All ssDNA1/ssDNA2 combination lanes were made from previously dye-labeled samples that were mixed immediately before gel loading—no labeling was done on ssDNA1/ssDNA2 mixtures.
The dye-labeled ssDNA1 and dye-labeled ssDNA2 samples were then combined and run on native PAGE to determine if they would form a dsDNA hybrid. Previously, denaturing PAGE of these mixtures revealed that dsDNA hybrids were not able to form, as expected due to the denaturing conditions (Fig. 3E–G). However, under native conditions, equimolar mixtures of the dye-labeled 10, 20, and 40 mM DAAS samples for both ssDNA1 and ssDNA2 all traveled as single bands identically to both the unlabeled ssDNA1/ssDNA2 mixture and the 0 mM DAAS ssDNA1/ssDNA2 mixture. This indicates that even the most highly labeled samples, with multiple fluorophores per oligo, were still capable of forming dsDNA hybrids. Imaging this gel after EtBr staining, as described previously, revealed the signal from total nucleic acid content, with a generally stronger signal for dsDNA versus ssDNA due to more effective intercalation (Fig. 4A). Imaging this same gel before EtBr staining for AZ488 and AZ680 fluorescence, followed by coloration (red for AZ488, blue for AZ680) and merging, gives clear visual confirmation that fluorescence from both dyes appears in the dsDNA bands (purple = red + blue), showing that the dye-labeled ssDNA1 and dye-labeled ssDNA2 oligos successfully hybridized (Fig. 4B). The two separate greyscale fluorescence scans similarly confirm the hybridization of dye-labeled ssDNA1 and dye-labeled ssDNA2 (Supplemental Fig. S2).
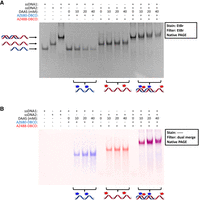
(A) Native PAGE showing the dye-labeled ssDNA1 and dye-labeled ssDNA2 samples loaded separately and as mixtures, alongside unlabeled controls. This gel was EtBr stained and imaged with an EtBr filter. (B) The same gel as in A, before EtBr staining, with the AZ488 and AZ680 fluorescence scans colored and merged. Purple coloration indicates both AZ488 and AZ680 fluorescence signal detected in the same portion of the gel. Note: All ssDNA1/ssDNA2 combination lanes were made from previously dye-labeled samples that were mixed immediately before gel loading—no labeling was done on ssDNA1/ssDNA2 mixtures.
Fluorescent labeling of a double-stranded DNA substrate
We also hypothesized that it is possible to label dsDNA since the Hoogsteen edge of nucleobases should be accessible to the DAAS-derived carbon-centered radical while being engaged in Watson–Crick pairing. Previously, the ssDNA1 and ssDNA2 samples were labeled before forming a dsDNA hybrid. We decided to use a ∼3 kb pair supercoiled bacterial plasmid along with the resulting linearized plasmid after restriction enzyme digestion for these labeling experiments. The circular and linear plasmid samples were both labeled with 10 mM DAAS, followed by dye labeling with AZ488-DBCO. An agarose gel containing both labeled constructs alongside their respective unlabeled controls was visualized with EtBr (Fig. 5A). A partial upward shift of the labeled circular plasmid relative to the unlabeled control can be seen, indicating that DAAS and/or dye labeling may be affecting its topology and thus gel mobility. Considering that the agarose gel was run under native conditions, shifts in gel mobility can result from changes in hydrodynamic radius even with no changes in polymer length. The linearized plasmid presents as multiple bands, most likely due to off target cutting by the restriction enzyme used, as only a single cut was expected. Furthermore, though linearized plasmid would be expected to run slower than supercoiled circular plasmid, a low degree of supercoiling within the circular plasmid and/or the off target cutting as previously mentioned (producing smaller fragments) could explain this effect. The same gel was then imaged under UV before EtBr was added, showing just the signal from AZ488 via a SYBR green filter (SYBR green possess similar spectral properties to AZ488) (Fig. 5B). Interestingly, only some of the bands visible from the EtBr stain showed significant fluorescence signal. The other bands gave weaker signals, though were still visible. To ensure that all observed dye signal was only the result of covalently bound fluorophores, a separate supercoiled plasmid was labeled alongside a 0 mM DAAS control to observe if AZ488-DBCO could nonspecifically bind to large double-stranded DNA samples, and no nonspecific binding was observed (Supplemental Fig. S3). These data indicate successful sulfinate modification and fluorescent labeling of nucleobases within dsDNA.
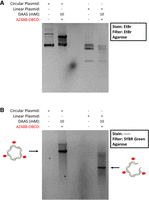
(A) EtBr stained agarose gel of the circular and linear plasmid samples, alongside their unlabeled controls. (B) The same gel as in A, before EtBr staining, imaged for AZ488 fluorescence using a SYBR green filter.
Ribozyme activity is retained following fluorescent labeling
We then sought to test whether complex RNA catalytic machinery, such as group II introns, could retain activity after sulfinate modification and click labeling. Group II introns are self-splicing catalytic RNAs that catalyze the excision of the intron and ligation of their 5′- and 3′-exons. We first tested an intron from O.i. (Fig. 6A) with a long 5′-exon added to make a gel mobility shift easily visible upon successful catalysis. This group II intron should form linear intron and cleaved free 5′-exon during an in vitro self-splicing reaction. This construct does not contain the 3′-exon or domain VI, since O.i. engages in random hydrolysis at the 3′-end after cleaving the 5′-exon (Toor et al. 2010). Splicing was monitored via the excision of the long 5′-exon. O.i. RNA was labeled with 10 and 30 mM DAAS (along with a 0 mM DAAS control), followed by click chemistry with AZ488-DBCO dye. The 10 mM DAAS sample ended up ∼2% dye-labeled (∼10 fluorophores per RNA molecule), whereas the 30 mM DAAS sample was ∼3% labeled (∼15 fluorophores per RNA molecule). Unless otherwise stated, all reactions containing group II intron RNA also contained 10 mM MgCl2 to preserve tertiary structure. Splicing reactions were carried out for unlabeled O.i. RNA and both the DAAS-labeled (no clicked dye) and dye-labeled RNAs for the 0, 10, and 30 mM DAAS samples. Denaturing PAGE was then used to analyze the splicing efficiency for each sample (Fig. 6B). The samples labeled with just 10 and 30 mM DAAS (lanes 7,8,11,12), along with the samples that were then clicked to AZ488-DBCO dye (lanes 9,10,13,14), showed significant splicing activity. Furthermore, viewing the gel before EtBr staining with a SYBR green filter indicated that dyed RNA molecules were capable of splicing, since dye signal could be seen in both the pre- and post-spliced bands (Fig. 6C). The ratio of the post- to pre-splicing band intensities does decrease as a function of DAAS concentration, indicating that higher labeling percentages can partially affect splicing. However, these data still indicate that an internally dye-labeled O.i. intron retains significant ribozyme activity.
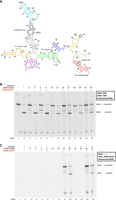
(A) Oceanobacillus iheyensis secondary structure map. (B) Denaturing PAGE showing before and after splicing time points (10 min splicing time) for a variety of O.i. samples labeled at different levels, with either DAAS by itself or with DAAS followed by AZ488-DBCO, along with unlabeled controls. Full-length (intron+ 5′-exon) and spliced bands are indicated to the right of the gel image. (C) The same gel as in B, before EtBr staining, imaged for AZ488 fluorescence.
To show that this effect can be replicated in another ribozyme, we also tested the wild-type Pylaiella littoralis (P.li.) group II intron, which has a length of ∼600 nt (Fig. 7A; Robart et al. 2014). This construct was designed with long 5′- and 3′-exons, to allow the ligated exon products to be visible on PAGE. During an in vitro splicing reaction, P.li. forms 2′–5′ lariat intron and ligated exons. P.li. was labeled with 10 mM DAAS (along with a 0 mM DAAS control) and then clicked with AZ488-DBCO dye. The 10 mM DAAS sample ended up ∼1% labeled (∼7 fluorophores per RNA molecule). Denaturing PAGE of the pre- and postspliced unlabeled, 0 mM DAAS control, and dye-labeled 10 mM DAAS samples all showed lariat and ligated exon bands (Fig. 7B). Furthermore, imaging the same gel for AZ488-DBCO fluorescence before EtBr staining reveals dye signal in the precursor, lariat, and ligated exon bands for the 10 mM DAAS sample (lanes 5,6), indicating successful splicing of P.li. containing covalently bound fluorescent dye (Fig. 7C). This splicing activity is significant given the greater complexity of P.li. and its ability to form the typical lariat seen in eukaryotic pre-mRNA splicing. Therefore, these data suggest that prefolded catalytic RNAs fluorescently labeled via DAAS linkers retain significant activity.
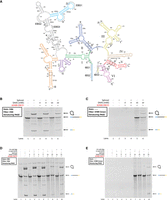
(A) Pylaiella littoralis secondary structure map. (B) Denaturing PAGE showing before and after splicing time points (10 min splicing time) for dye-labeled P.li. samples along with unlabeled controls. Full-length (intron+ 5′ and 3′-exons), lariat, and ligated exon bands are indicated to the right of the gel image. (C) The same gel as in B, before EtBr staining, imaged for AZ488 fluorescence. (D) Denaturing PAGE showing before and after splicing time points (10 min splicing time) for dye-labeled P.li. samples, along with unlabeled controls, that were DAAS-labeled under either native (+Mg) or denaturing conditions (−Mg). (E) The same gel as in D, before EtBr staining, imaged for AZ488 fluorescence.
We then asked the question of whether labeling is occurring on the solvent-exposed surface of the structured RNA versus the interior that comprises the ribozyme active site. Given the complexity of the P.li. group II intron splicing machinery, we were curious if changing the intron tertiary structure during DAAS labeling would change the splicing competency of the resulting dye-labeled samples. This could be tested by denaturing the RNA structure during DAAS labeling, followed by dye labeling and in vitro splicing assays. Thus, samples of P.li. were labeled both with and without magnesium present (referred to as P.li. +Mg and P.li. −Mg from here on). Adding EDTA to the P.li. −Mg sample ensured chelation of trace magnesium and denaturation of tertiary structure. Samples were then reacted with AZ488-DBCO dye, and then spliced in the presence of magnesium. Denaturing PAGE of the splicing assays revealed that P.li. +Mg spliced slightly less efficiently than the controls, while P.li. −Mg had a more substantial reduction in splicing products (Fig. 7D). However, when imaged for AZ488-DBCO fluorescence before EtBr staining, no signal could be seen for the P.li. −Mg lariat or ligated exon bands (lanes 7,8), while a signal remained for the P.li. +Mg lariat and ligated exon bands (lanes 9,10) (Fig. 7E). Thus, the small amount of lariat and ligated exon signal seen for P.li. −Mg after EtBr staining must have been from a population of RNAs that had ended up unlabeled in the original DAAS reaction. Any P.li. −Mg molecules that did end up dye-labeled were not capable of splicing, while a significant fraction of the dye-labeled P.li. +Mg molecules still spliced, producing fluorescently labeled lariat and ligated exons. Importantly, a 0 mM DAAS control for the −Mg condition spliced identically to unlabeled P.li. RNA, indicating that the unfolding of tertiary structure on its own was reversible when the RNA was added to magnesium-containing splicing buffer.
These results lead to the conclusion that the difference in splicing activity between P.li. +Mg and −Mg was due to DAAS labeling occurring under different tertiary structure states (folded vs. unfolded). It is likely that most nucleobases labeled in P.li. +Mg were those on the exterior of the folded RNA since they would most easily interact with the DAAS-derived radicals, leaving the nucleobases on the interior of the folded structure mostly protected from labeling. These interior nucleobases are also critical for ribozyme activity; however, due to the tertiary structure of P.li. −Mg being unfolded, we hypothesize that nucleobases in typically buried sites ended up much more solvent-exposed during the labeling reaction and thus more likely to react with DAAS-derived radicals. If certain nucleobases that would have otherwise been buried were labeled, it is possible that the presence of the bulky label would prevent proper refolding in splicing buffer, thus leading to no splicing activity for dyed samples. This result indicates that our method is not only broadly capable of labeling complex catalytic RNAs while preserving splicing activity, but that it can also serve as a means of probing RNA tertiary structure under different labeling conditions.
HPLC/mass spectrometry of DAAS-labeled O.i. RNA
In order to detect the chemical species being produced at the single nucleotide level during DAAS labeling, a sample of DAAS-labeled O.i. RNA (labeled with 40 mM DAAS) was digested to nucleosides and then applied to reverse-phase HPLC/MS in order to detect the presence of masses corresponding to the four DAAS-labeled RNA nucleosides. All four DAAS-labeled RNA nucleoside masses were detected via signals that were not present on the blank sample (Fig. 8A). However, it was found that all four masses corresponded to species in which the difluoro group on the DAAS linker was hydrolyzed to a ketone. This change was insignificant for the results discussed in this paper, as the carbon–carbon linkage is maintained regardless. The transformation of the difluoro motif into a ketone has also been noted in earlier studies of small molecule DAAS labeling (Zhou et al. 2013). As an additional control, the masses of the four unlabeled RNA nucleosides were also detected in this same sample, as expected since the DAAS labeling percentage is in the single digit percentage range, leaving most residues unlabeled (Fig. 8B). Though some of the nucleobases contain more than one C–H group, it is not entirely clear from the HPLC/MS data which positions are most reactive to DAAS labeling. However, aside from the C2-H on adenine, all other available C–H groups on the RNA and DNA nucleobases lie on the Hoogsteen edge and their modification should thus minimally affect Watson–Crick base-pairing.
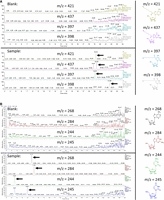
(A) LC/MS chromatograms of the four DAAS-labeled nucleosides (indicated by arrows), produced from a digested DAAS-labeled O.i. sample. A blank is included. Structures are included on the right, color coded to their respective chromatograms. The extra peak for DAAS-labeled guanosine at 18.81 min results from an unrelated mass from the blank. The peak at 19.35 min corresponds to the actual DAAS-labeled guanosine species. (B) LC/MS chromatograms of the four canonical nucleosides (indicated by arrows), produced from a digested DAAS-labeled O.i. sample. A blank is included. Structures are included on the right, color coded to their respective chromatograms. The extra uridine peak at 3.52 min results from cytidine overlap (likely caused by natural 13C incorporation) due to their difference of only 1 AMU.
DISCUSSION
We have shown a novel procedure by which azide moieties can be added to RNA and DNA without degradation through a single pot, low-cost approach, allowing the nucleic acid to be functionalized with a diverse array of commercially available alkyne-labeled small molecules. Very large RNAs can be labeled with this method, thus allowing easy access to chemical space that otherwise would be out of reach with chemical synthesis or in vitro transcription. This work is significant because it shows that C–H functionalization of heteroarene nucleobases can be done in the context of a labile RNA backbone under mild, aqueous conditions.
Our results with the dye-labeled ssDNA1 and ssDNA2 constructs confirm that clicking multiple fluorophores per oligo preserves the ability of single-stranded DNA to form double-stranded DNA. It is likely that the selectivity of DAAS labeling toward the Hoogsteen edges of nucleobases is responsible for this retention of biochemical function. In contrast, commercially available nucleic acid labeling kits modify the Watson–Crick edge via nucleophilic substitution reactions (Mirus Bio, Label IT kits), leading to a larger reduction in base-pairing ability. Therefore, DAAS labeling may have significant applications for northern and Southern blotting, as producing fluorescently labeled single-stranded DNA or RNA probes would be rapid, low-cost, and simple, while also free of enzymes, expensive fluorophore-containing NTPs, and radioactive materials.
The ability of a complex group II intron ribozyme to splice, even when labeled with a bulky fluorophore, indicates that this labeling procedure minimally affects the biochemical function of the RNA. To our knowledge, our group II intron experiments represent the first examples of internally fluorescently labeled introns undergoing successful splicing in vitro. Labeling large RNAs is difficult and expensive due to the limitations of oligo synthesis and enzymatic incorporation of modified NTPs. Furthermore, not only are modified NTPs expensive and incorporated at low rates, but it remains unclear if a catalyst like a group II intron would still fold correctly if bulky modified NTPs were randomly incorporated within its sequence. As our experiments with the P.li. group II intron show, allowing any residue to be labeled regardless of tertiary structure is very likely to inhibit refolding and thus block ribozyme function. A method that labels natively folded RNAs is more likely to preserve biochemical function. Additionally, the sensitivity of DAAS labeling to tertiary structure can itself serve as a possible chemical method for probing RNA folding.
The fact that DAAS can label both circular and linearized dsDNA plasmid shows that a sulfinate reagent can effectively access the Hoogsteen edge of nucleobases that are engaged in Watson–Crick pairing. In addition, this demonstrates that labeling is not occurring only on the ends of the nucleic acid (like periodate oxidation, for example), due to the uncut plasmid being circular and thus having no ends. The presence of more than two labeling bands for both dye-labeled ssDNA substrates along with the presence of labeled lariat from the P.li. splicing experiments adds additional evidence for internal labeling. We did attempt to map modification sites in RNA using primer extension; however, we found only weak evidence for RT stops. It may be possible that RTs can read through nucleotides modified with DAAS on the Hoogsteen edge. Extrapolating from the plasmid modification data, we think it is likely that dsRNA regions can be similarly modified, in addition to ssRNA.
Sulfinate salt chemistry is also useful as a tool for basic research of nucleic acid biochemistry. Fluorescent probe attachment can be helpful for tracking nucleic acids in gels and for localization within cells. The attachment of affinity probes, such as biotin, can facilitate nucleic acid purification and is also useful for the identification of specific nucleic acid–protein interactions. Click chemistry allows a variety of other functional groups to be added to nucleic acids, such as sugars or glycans, affinity tags (biotin), proteins, magnetic beads, and gold nanoparticles. For example, it has been recently reported that some RNAs are glycosylated within cells (Flynn et al. 2021). Our sulfinate modification protocol could be used to generate large quantities of glycosylated RNAs to probe their biological function. Our method enables a diverse set of modifications and can be easily scaled to the larger quantities required for the possible industrial production of RNA therapeutics.
MATERIALS AND METHODS
In vitro transcription
In vitro transcription reactions (1 mL final volume) contained the following components: 40 µg linearized plasmid DNA, 50 mM Tris-HCl pH 7.5, 25 mM MgCl2 (17.5 mM MgCl2 for transcribing P.li. to avoid premature splicing), 2 mM spermidine, 20 mM total NTPs (5 mM for each NTP), 0.05% Triton X-100, and 5 mM dithiothreitol. T7 RNA polymerase was used for transcription, along with inorganic pyrophosphatase to minimize pyrophosphate precipitates. Transcription reactions were run at 37°C for 3 h, and reactions were stopped with the addition of 12 µL of 0.1 M CaCl2 and 20 units of TURBO DNase (Thermo Fisher). Incubation with DNase proceeded for 45 min at 37°C. Following DNase treatment, 200 µg of Proteinase K (Thermo Fisher) were added and the reactions were incubated at 37°C for an hour. Transcription reaction tubes were then spun down for 5 min at 20,000 RCF, and the supernatant was filtered through a 0.2 µm membrane. The RNA was purified by buffer exchange in Amicon Ultra-15 centrifugal filters, into 5 mM sodium cacodylate pH 6.5/10 mM MgCl2 buffer.
Modification of nucleic acids with DAAS
DAAS reactions were run under aqueous conditions, with the RNA or DNA substrates at 1 mg/mL, DAAS concentrations between 10 and 40 mM, sodium cacodylate pH 6.5 buffer at a 2:1 molar ratio relative to the DAAS concentration, and TBHP at a 2:1 molar ratio relative to the DAAS concentration. TBHP should always be added to the mixture last, followed by immediate mixing. Reactions did not need to be cooled prior to TBHP addition (as is often recommended in sulfinate labeling protocols for small molecules), since the TBHP stock solution that was used was already significantly diluted in water, and the reaction scales were small (typically 100 µL). The TBHP stock solution should be kept at 4°C when not being used. MES and similar buffers (MOPS, HEPES) should be avoided due to negative effects on yields in peroxide-based reactions (Baker et al. 2007; Ichiishi et al. 2018). Extra MgCl2 or EDTA can also be added to the reactions to alter RNA tertiary structure during labeling. Once reactions were prepared and mixed thoroughly, they were allowed to react at room temperature. Reactions were typically run for 2 h, as longer times did not seem to significantly increase yields.
Purification of DAAS-labeled nucleic acids
Once the DAAS labeling reactions were complete, reaction mixtures were buffer exchanged on centrifugal filters, such that all small molecules associated with the labeling reaction could pass through the filter, leaving the DAAS-labeled nucleic acid behind. It is important that buffer exchange is done with a suitable buffer for maintaining RNA structure, if this is desired. Note on reaction precipitates: reactions using more than 10–20 mM DAAS typically produce a small amount of a light-yellow precipitate. This is likely the product of two difluoroalkylazido radicals dimerizing, producing a 14-carbon species that would be expected to have very little solubility in water. Spinning down the reaction tubes at 20,000 RCF for 10 min allowed the supernatant, containing the soluble DAAS-labeled nucleic acid, to be isolated from the precipitate and buffer exchanged. This centrifugation step prior to cutoff filtration prevents the reaction precipitate from clogging the filter membrane. DAAS-labeled nucleic acids can also be purified by ethanol precipitation if preserving their structure is not mandatory.
Dye labeling of DAAS-labeled nucleic acids
SPAAC reactions were run under aqueous conditions, with the DAAS-labeled RNA or DNA substrates at 0.25 mg/mL, sodium cacodylate pH 6.5 at 50 mM, and the desired DBCO-labeled dye at 100 µM. The reactions were left at room temperature overnight (Agard et al. 2004). Once the reactions were complete, the fluorescently labeled nucleic acids were purified identically to the “Purification of DAAS-labeled nucleic acids” procedure. Centrifugation prior to cutoff filtration is not needed as no precipitates should form. Dye-labeled nucleic acids possessed identical stability to that of the corresponding unlabeled nucleic acid, with DNA being more resistant to spontaneous degradation than RNA. The intron RNAs used in this work remain stable for at least a year in a solution containing 10 mM Mg2+ at 4°C.
LC/MS analysis of DAAS-labeled RNA
Purified DAAS-labeled RNA was digested using the NEB Nucleoside Digestion Mix according to the manufacturer's protocol. The digested sample was diluted by a factor of 3.25 in water containing 0.1% formic acid. Forty microliters of the sample was used for LC/MS analysis. An Agilent 1260 liquid chromatograph (LC) system coupled with a Thermo LCQ Deca mass spectrometer (MS) was used, using electrospray ionization (ESI) as the ion source. The instrument was operated under positive ion mode with a source voltage of 5 kV, sheath gas flow rate of 80 units, auxiliary gas flow rate of 20 units, and a capillary temperature of 250°C. An Agilent Eclipse XDB C-18 HPLC column was used. The HPLC gradient used was as follows: 0 min, 0% B; 1 min, 0% B; 15 min, 20% B; 21 min, 95% B; 25 min, 95% B; 26 min, 0% B; 32 min, 0% B, where A was H2O with 0.1% formic acid, and B was acetonitrile with 0.1% formic acid. A flow splitter was utilized to deliver 20% of the LC flow (0.20 mL/min) to the ESI source, while the rest was sent to waste.
Determination of dye labeling percentage
The labeling percentage for a sample of dye-labeled nucleic acid can be determined by first correcting its 260 nm absorbance
(A260) value to remove any contribution from the attached dye. This is shown in the following formula, where  is the corrected A260 value for the dye-labeled nucleic acid, AS, 260 is the uncorrected A260 value for the dye-labeled nucleic acid, AS,max is the absorbance value at λmax (the wavelength of maximum absorbance of the dye) for the dye-labeled nucleic acid, AF,260 is the A260 value for the free dye, and AF,max is the absorbance value at λmax for the free dye:
 Both AF,260 and AF,max can be obtained from a UV/Vis spectrum of the free dye. Once
  is obtained, it can be converted to a mg/mL concentration value via the appropriate conversion factor, depending on if the
sample is ssDNA, dsDNA, or RNA. This concentration value can then be converted to an effective molar concentration of nucleobases
(which assumes, for mathematical purposes, that they are free monomers) using both the molar mass of the nucleic acid and
the number of bases per molecule. The absorbance value of the dye-labeled nucleic acid sample at λmax can be converted to an effective molar concentration of dye molecules via Beer's Law, using the molar absorptivity (ɛmax) provided by the manufacturer. The ratio of the effective molar concentration of dye divided by the effective molar concentration
of nucleobases then gives the fraction of nucleobases that contain conjugated dye molecules, allowing a final conversion to
labeling percentage.
is obtained, it can be converted to a mg/mL concentration value via the appropriate conversion factor, depending on if the
sample is ssDNA, dsDNA, or RNA. This concentration value can then be converted to an effective molar concentration of nucleobases
(which assumes, for mathematical purposes, that they are free monomers) using both the molar mass of the nucleic acid and
the number of bases per molecule. The absorbance value of the dye-labeled nucleic acid sample at λmax can be converted to an effective molar concentration of dye molecules via Beer's Law, using the molar absorptivity (ɛmax) provided by the manufacturer. The ratio of the effective molar concentration of dye divided by the effective molar concentration
of nucleobases then gives the fraction of nucleobases that contain conjugated dye molecules, allowing a final conversion to
labeling percentage.
Group II intron splicing reactions
For both the O.i. and P.li. splicing reactions, 2× master mixes were made containing 200 mM MgCl2, 100 mM Tris-HCl pH 7.5, and 1 M NH4Cl (for O.i.); or 20 mM MgCl2, 2 M NH4Cl, and 80 mM Tris-HCl pH 7.5 (for P.li.). O.i. splicing reactions were run at 55°C for 10 min, while P.li. splicing reactions were run at 45°C for 10 min. Splicing reactions were at 10 µL scale and contained 2 µg of RNA. After the allotted splicing time, reactions were quenched with excess EDTA, mixed with formamide/bromophenol blue loading dye, and run on denaturing PAGE.
ssDNA oligos
ssDNA1 and ssDNA2 were both ordered from IDT and had the following sequences:
ssDNA1: GCGACATGGAATCTGAAGGAAGCGGACGGCAAACCTTCGGTCTGAGGAACACGAACTTCA
ssDNA2 (bolded region is complementary to ssDNA1):
TGAAGTTCGTGTTCCTCAGACCGAAGGTTTGCCGTCCGC
TTCCTTCAGATTCCATGTCGCTTGATGAAGGGAAAGACTGC
SUPPLEMENTAL MATERIAL
Supplemental material is available for this article.
ACKNOWLEDGMENTS
We would like to thank Professor Yitzhak Tor and Yao Li for their help with LC/MS experiments, along with the UCSD Molecular Mass Spectrometry Facility (MMSF) for LC/MS data. We would like to thank Tim Wiryaman for his preliminary experiments with PSMS-Zn modification of RNA. We also thank Phil Baran for helpful comments on the manuscript. Research reported in this work was supported by the National Institute of General Medical Sciences (NIGMS) of the National Institutes of Health (NIH) under award number R35GM141706 awarded to N.T.
Footnotes
-
Article is online at http://www.rnajournal.org/cgi/doi/10.1261/rna.079679.123.
- Received April 6, 2023.
- Accepted May 12, 2023.
This article is distributed exclusively by the RNA Society for the first 12 months after the full-issue publication date (see http://rnajournal.cshlp.org/site/misc/terms.xhtml). After 12 months, it is available under a Creative Commons License (Attribution-NonCommercial 4.0 International), as described at http://creativecommons.org/licenses/by-nc/4.0/.
REFERENCES
MEET THE FIRST AUTHORS


Meet the First Author(s) is an editorial feature within RNA, in which the first author(s) of research-based papers in each issue have the opportunity to introduce themselves and their work to readers of RNA and the RNA research community. Tiziano Bassi and Anastassia Hirlinger are joint first authors of this paper, “Fluorescent labeling of RNA and DNA on the Hoogsteen edge using sulfinate chemistry.” Tiziano is a third year PhD student in the chemistry and biochemistry department at UC San Diego in Navtej Toor's laboratory. Anastassia completed her PhD work in the Toor laboratory and is now a postdoctoral scholar in Tariq Rana's laboratory in the UC San Diego School of Medicine. The Toor laboratory is interdisciplinary and broadly focused upon RNA structure and chemical biology.
What are the major results described in your paper and how do they impact this branch of the field?
Postsynthetic chemical modification of nucleic acids is difficult due to their fragile phosphodiester backbone, particularly in the case of RNA. We developed a method for introducing azide-containing linkers via carbon–carbon bonds onto the nucleobases of RNA and DNA, allowing diverse functionalization through click chemistry. The key reagent for this process is DAAS, a sulfinate salt that was originally developed for labeling small molecule heteroaromatic substrates. After fluorescent labeling with alkyne-tagged dyes, we observed that ssDNA and two different intron RNAs still possessed Watson–Crick base-pairing ability and significant splicing activity, respectively. Additionally, sulfinate labeling was shown to be sensitive to the tertiary structure of the RNA substrate during labeling, allowing its potential use as a structure probe. Broadly, our work provides a simple, inexpensive method for internal attachment of azide groups onto RNA and DNA under mild conditions that preserve the biochemical function of the labeled species. Even though this work focuses on the attachment of fluorophores, this methodology can easily be used to attach any desired functional group containing an alkyne. For example, it is possible to attach alkyne-labeled lipids and sugars to RNA with this approach.
What led you to study RNA or this aspect of RNA science?
TB: I took a rather unconventional route to RNA chemical biology. As a chemistry undergraduate, I measured delayed neutron emission from uranium and plutonium fission at my campus's nuclear reactor facility. However, in the last year of my degree, I found a new passion for the intersection of chemistry and biology, leading me into a chemical biology track for my PhD program.
What are some of the landmark moments that provoked your interest in science or your development as a scientist?
TB: Since I had pivoted to a biological direction relatively late in my chemistry undergraduate program, I had a lot of catching up to do on my own time. This involved reading through several biochemistry textbooks in order to get up to speed with the material I would be studying in graduate school. At this point, I already had a strong basis in organic chemistry, therefore the biochemical pathways were relatively simple for me to understand from a mechanistic point of view. However, what really captured my curiosity was the sheer complexity and number of unique chemical transformations happening within a cell at any given time. Considering that physical chemistry was my original focus, the universe within a cell seemed quite alien to me and enticed me to learn more.
If you were able to give one piece of advice to your younger self, what would that be?
TB: Early on in graduate school, I tended to avoid too much risk-taking with respect to my experiments. If I had a choice, I preferred the direction that was more likely to be successful, even if not as exciting. However, my experience has taught me the importance of pushing beyond my comfort zone in scientific research. While I still understand the importance of being realistic with one's experimental expectations, it is important to never be too fixated on initial predictions of success regarding a new idea. The history of scientific progress is filled with examples of the impossible becoming possible, and this has inspired me to continue pushing beyond boundaries in my work.
What were the strongest aspects of your collaboration as co-first authors?
TB: Ana earned her PhD in 2020 and completed foundational experiments showing that sulfinate labeling of nucleic acids was possible and could be utilized for diverse functionalization. After she graduated, I joined the program and took on the project, quantifying the amounts of fluorescent labeling as a function of DAAS concentration and exploring the effects of higher labeling yields than had been tested before. Furthermore, I also explored the effects of fluorescent labeling on ssDNA Watson–Crick base-pairing ability, RNA splicing competency, and RNA refolding after being labeled in a denatured state.




