


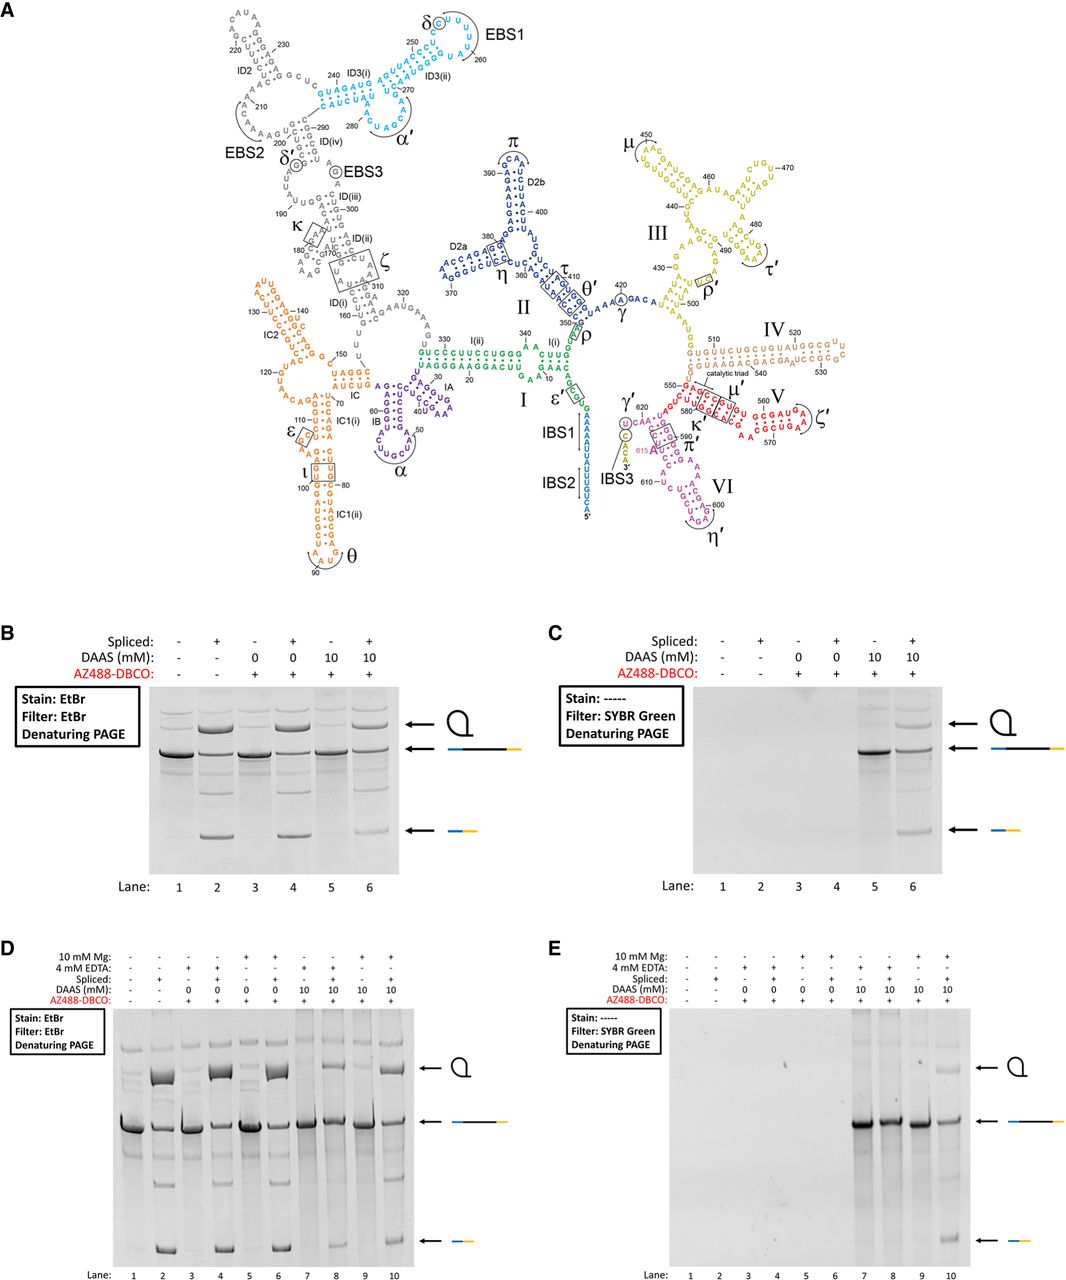
(A) Pylaiella littoralis secondary structure map. (B) Denaturing PAGE showing before and after splicing time points (10 min splicing time) for dye-labeled P.li. samples along with unlabeled controls. Full-length (intron+ 5′ and 3′-exons), lariat, and ligated exon bands are indicated to the right of the gel image. (C) The same gel as in B, before EtBr staining, imaged for AZ488 fluorescence. (D) Denaturing PAGE showing before and after splicing time points (10 min splicing time) for dye-labeled P.li. samples, along with unlabeled controls, that were DAAS-labeled under either native (+Mg) or denaturing conditions (−Mg). (E) The same gel as in D, before EtBr staining, imaged for AZ488 fluorescence.




