


Translational control by Trypanosoma brucei DRBD18 contributes to the maintenance of the procyclic state
- Martin Ciganda1,
- José Sotelo-Silveira2,
- Ashutosh P. Dubey1,
- Parul Pandey1,
- Joseph T. Smith1,
- Shichen Shen3,
- Jun Qu3,
- Pablo Smircich4,5 and
- Laurie K. Read1
- 1Department of Microbiology, Jacobs School of Medicine and Biomedical Sciences, University at Buffalo, Buffalo, New York 14203, USA
- 2Departamento de Genómica, Instituto de Investigaciones Biológicas Clemente Estable, Montevideo 11600, Uruguay
- 3Department of Pharmaceutical Sciences, University at Buffalo and NYS Center of Excellence in Bioinformatics and Life Sciences, Buffalo, New York 14203, USA
- 4Laboratorio de Bioinformática, Departamento de Genómica, Instituto de Investigaciones Biológicas Clemente Estable, Montevideo 11600, Uruguay
- 5Sección Genómica Funcional, Facultad de Ciencias, Universidad de la República, Montevideo 11400, Uruguay
- Corresponding authors: lread{at}buffalo.edu, psmircich{at}fcien.edu.uy
Abstract
Trypanosoma brucei occupies distinct niches throughout its life cycle, within both the mammalian and tsetse fly hosts. The immunological and biochemical complexity and variability of each of these environments require a reshaping of the protein landscape of the parasite both to evade surveillance and face changing metabolic demands. In kinetoplastid protozoa, including T. brucei, posttranscriptional control mechanisms are the primary means of gene regulation, and these are often mediated by RNA-binding proteins. DRBD18 is a T. brucei RNA-binding protein that reportedly interacts with ribosomal proteins and translation factors. Here, we tested a role for DRBD18 in translational control. We validate the DRBD18 interaction with translating ribosomes and the translation initiation factor, eIF3a. We further show that DRBD18 depletion by RNA interference leads to altered polysomal profiles with a specific depletion of heavy polysomes. Ribosome profiling analysis reveals that 101 transcripts change in translational efficiency (TE) upon DRBD18 depletion: 41 exhibit decreased TE and 60 exhibit increased TE. A further 66 transcripts are buffered, that is, changes in transcript abundance are compensated by changes in TE such that the total translational output is expected not to change. In DRBD18-depleted cells, a set of transcripts that codes for procyclic form-specific proteins is translationally repressed while, conversely, transcripts that code for bloodstream form- and metacyclic form-specific proteins are translationally enhanced. RNA immunoprecipitation/qRT-PCR indicates that DRBD18 associates with members of both repressed and enhanced cohorts. These data suggest that DRBD18 contributes to the maintenance of the procyclic state through both positive and negative translational control of specific mRNAs.
Keywords
INTRODUCTION
Infectious organisms regulate crucial processes such as proliferation and generation of infective stages through coordinated changes in their protein repertoire in response to changes in nutrients, immune response of the host, and other environmental factors such as temperature (Verma-Gaur and Traven 2016; El Mouali and Balsalobre 2019; Johansson and Freitag 2019). Trypanosoma brucei is a parasite with a complex life cycle that involves a Glossina insect vector and a mammalian host, in which regulated differentiation proceeds through distinctly adapted life stages (Matthews 2005). Within the mammalian host, proliferation of slender bloodstream forms (BFs) is accompanied by differentiation via quorum sensing mechanisms into cell cycle-arrested stumpy forms that are preadapted to progress into insect forms once taken up in a blood meal (Quintana et al. 2021). Within the tsetse fly midgut, parasites differentiate into the procyclic form (PF) (Rotureau and Van Den Abbeele 2013). As nutrient availability and environmental conditions within the midgut change, PF parasites begin their migration toward the salivary glands, where infective metacyclic forms (MFs) are generated (Christiano et al. 2017).
In trypanosomes, control of gene expression is largely posttranscriptional (Clayton 2019), taking place through the action of trans acting factors on cis elements in the UTRs of the mRNAs (or occasionally, the coding regions) (Kramer and Carrington 2011). RNA-binding proteins (RBPs) are critical trans acting factors that control steady-state levels of mRNAs by regulating mRNA processing, nuclear export, degradation, and translatability (Kolev et al. 2014; Clayton 2019). For example, the PuREBP1/2 complex, which contains two RBPs, controls the purine-dependent decay of the NT8 nucleobase transporter mRNA in PF T. brucei by binding a stem–loop element to its 3′ UTR (Rico-Jimenez et al. 2021). The RBP PUF9 stabilizes target transcripts involved in kinetoplast replication during S-phase (Archer et al. 2009). RBPs have also emerged as fundamental players in the regulation of the T. brucei life cycle (Kolev et al. 2014; Clayton 2019). RBP10 is a BF-specific protein that binds a U(A)U6 motif in the 3′ UTR of many target RNAs and is required for the growth of T. brucei as BFs (Wurst et al. 2012; Mugo and Clayton 2017). Cells depleted of RBP10 can only grow as PFs, and if PFs are stimulated to overexpress RBP10, they can only grow as BFs. RBP7 is one of over 30 molecules identified in response to quorum sensing that triggers the transition from slender BFs to quiescent stumpy BFs (McDonald et al. 2018). Finally, overexpression of RBP6 in PF triggers their differentiation to epimastigotes and, subsequently, MFs. Despite their critical importance in all facets of growth and development, most T. brucei RBPs remain uncharacterized.
DRBD18 is a double RRM-containing protein that is both essential and abundant, and whose depletion leads to a large remodeling of the transcriptional landscape in BF and PF T. brucei (Lott et al. 2015; Bishola Tshitenge and Clayton 2022). In addition, we previously showed that DRBD18 has a role in the nuclear export of a subset of mRNAs (Mishra et al. 2021). Subsequent work by others has demonstrated that depletion of DRBD18 leads to defects in pre-mRNA processing (Bishola Tshitenge and Clayton 2022). Thus, DRBD18 is a multifunctional RBP. Interestingly, DRBD18 was found associated with polysomes in BF cells (Klein et al. 2015), and DRBD18 pull-downs recovered numerous ribosomal proteins and translation factors in BF and PF (Lott et al. 2015; Bishola Tshitenge and Clayton 2022), suggesting a direct role for DRBD18 in translational control. Multiomic approaches involving ribosome profiling (Ribo-seq) have been successfully used to address several aspects of translational control in trypanosomes (Jensen et al. 2014; Vasquez et al. 2014; Smircich et al. 2015; Chavez et al. 2021). Here, we use these approaches to explore the function of DRBD18 in translational regulation in PF T. brucei.
RESULTS
DRBD18 associates with ribosomes and translation initiation factor eIF3a
Previous studies from our laboratory and others demonstrated the presence of ribosomal proteins and translation factors among the proteins enriched by association with DRBD18 in T. brucei (Supplemental Table S1; Lott et al. 2015; Bishola Tshitenge and Clayton 2022), suggesting a role for DRBD18 in translation. To determine if DRBD18 is associated with translating ribosomes in PF, we analyzed sucrose gradient fractions from sedimented cell lysates (Fig. 1A). As shown by continuous measurement of absorbance at 260 nm (blue trace), fractions were collected containing ribosome-free (RF) components, ribosomal subunits, monosomes (M), and polysomes. Western blot analysis demonstrated that DRBD18 can be detected in fractions from the polysome-enriched, dense portions of the gradients (Fig. 1A, top). Quantification of duplicate blots revealed that ∼1.5%–2% of total cytoplasmic DRBD18 is polysome-associated. To confirm that the presence of DRBD18 in these fractions correlates with the presence of polysomes, we treated control lysates with either EDTA or puromycin (Fig. 1A), disassembling ribosomes. As shown in the bottom panel, monosomes and polysomes are dissociated upon EDTA or puromycin treatment, and concomitantly, DRBD18 is lost from the high-density fractions. Thus, a small fraction of DRBD18 associates with polysomes, consistent with a substoichiometric and/or transient interaction.
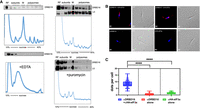
DRBD18 associates with polysomes and translation initiation factor eIF3a. (A) Anti-DRBD18 western blot detection of DRBD18 in high-density, polysomal fractions from cycloheximide-treated lysates separated on 10%–40% sucrose gradients (top). EDTA-mediated (bottom left) or puromycin-mediated (bottom right) dissociation of ribosomes leads to loss of DRBD18 association with high-density fractions. (L5) ribosomal protein L5, (RF) ribosome free, (M) monosomes. (B) Proximity ligation assay (PLA) in cells with carboxy-terminally HA-tagged eIF3a using antibodies against HA and DRBD18. Two examples are shown in the top row with corresponding DIC images. Red dots indicate signal from the amplification of individual interactions. Negative controls in the bottom row are individual antibodies alone; anti-DRBD18 (left), anti-HA (right), with corresponding DIC images. Bar, 2 μm. (C) Quantification of dots per cell (100 cells per condition); both antibodies, blue; anti-DRBD18 alone, red; anti-HA alone, green. Students t-test, (****) P < 0.0001.
We previously identified nine subunits of the translation initiation factor, eIF3, in DRBD18 pull-downs (Supplemental Table S1). In addition to its well-characterized role in translation initiation, eIF3 can also be a negative regulator of translation, with some functions being subunit-selective (Valasek et al. 2017; Wolf et al. 2020). In T. brucei, eIF3 is composed of 11 subunits (subunits a through l, with the exception of subunit j), and they can be tagged, overexpressed and copurified in a complex (Li et al. 2017). To define the association of DRBD18 and the eIF3 complex, we selected eIF3a for further study as this subunit was also detected in association with DRBD18 in BF (Bishola Tshitenge and Clayton 2022). To achieve high resolution and in situ specificity, we utilized a PLA (Fredriksson et al. 2002) to visualize the interaction between DRBD18 and eIF3a-HA in fixed and permeabilized cells. When candidate interactors are within 40 nm, the ligation and amplification reactions amplify this single event into a detectable fluorescence signal. As seen in Figure 1B, when PF T. brucei are incubated with both α-DRBD18 and α-HA antibodies, fluorescence signals from the interactions (artificially colored in red) are observed (eight dots per cell, range 3–17; Fig. 1C), indicating that DRBD18 and eIF3a-HA are in close proximity, either interacting directly or as part of a complex. DRBD18 has been described as being cytoplasmic and nuclear, and it is likely that it shuttles between both compartments (Lott et al. 2015; Dean et al. 2017; Bishola Tshitenge and Clayton 2022). In turn, T. brucei eIF3 is cytoplasmic, consistent with its role in translation (Li et al. 2017). Topologically, therefore, the cytoplasm provides the most opportunities for interaction between eIF3a and DRBD18, and that is indeed what we observed. As controls, when individual primary antibodies are utilized alone, the number of dots per cell falls significantly (range 0–4, 100 cells per condition, Fig. 1C). These data confirm the specificity of the DRBD18–eIF3a interaction, which may be in the context of the canonical eIF3 complex or within a distinct complex. Interaction of DRBD18 with both translating ribosomes and translation initiation factor, eIF3a, supports a role for DRBD18 in translation.
Depletion of DRBD18 leads to a translational defect
Having shown a physical association between DRBD18 and components of the translational machinery, we next investigated the global translational status of PF cells under conditions of RNAi-mediated DRBD18 depletion. Lysates from uninduced and induced cells were layered onto sucrose gradients and separated by ultracentrifugation so that ribosomal subunits, monosomes, and polysomes could be discriminated and visualized. Integrating the area under each peak gives a readout of the total mass in the selected category, and the monosome/polysome area ratio provides an indication of translational status (Rowe et al. 2014; Chassé et al. 2017): The lower this ratio, the more ribosome mass will be engaged in higher density polysomal fractions actively translating mRNAs. Conversely, the higher the ratio, the less ribosomal mass will be engaged in higher translational output. After the induction of DRBD18 RNAi, the monosome/polysome ratio is increased (Fig. 2A), reflecting a decrease in translational activity mediated by DRBD18 depletion. Four replicates of the experiment were quantified, and the monosome/polysome ratios are shown in Figure 2B. To rule out the possibility that this phenotype is a consequence of indirect stress-related processes, we analyzed polysomal profiles of PF cells depleted of the essential RBP, RBP16 (Pelletier and Read 2003). We performed the assays at 24 h postinduction, a time point at which DRBD18 and RBP16 cell lines both exhibit growth phenotypes (Supplemental Fig. S1). The decrease in polysomes in the DRBD18-depleted cells, but not in the RBP16-depleted cells (Supplemental Fig. S1), demonstrates that DRBD18 knockdown leads to a specific decrease in translating polysomes.
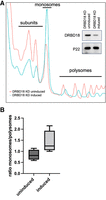
Depletion of DRBD18 in procyclic cells leads to translational defects. (A) Polysomal profiles of lysates from PF DRBD18 RNAi cells either uninduced (red) or doxycycline-induced (blue). (Inset) Western blot of induced and uninduced whole cell samples showing efficient knockdown of DRBD18; p22 is used as a loading control. (B) Quantification of the monosome to polysome ratio from four independent experiments as in (A).
Depletion of DRBD18 leads to changes in the translational efficiencies of a subset of transcripts
To gain a better understanding of how translational regulation through DRBD18 occurs in PF T. brucei, we performed ribosome profiling comparing DRBD18-depleted cells (induced with doxycycline) to DRBD18-replete cells (uninduced). The length distribution and mapping periodicity profile of reads was consistent with bona fide ribosomal footprints (Supplemental Fig. S2; Ingolia et al. 2009; Jensen et al. 2014; Vasquez et al. 2014; Smircich et al. 2015). Analysis using the anota2seq package (Oertlin et al. 2022) revealed that 102 transcripts were significantly altered in their translational efficiencies (TEs), resulting in either an increase (41 transcripts, TE UP) or a decrease (61 transcripts, TE DOWN) in translation efficiency (Fig. 3A, light and dark red, respectively; Supplemental Table S2). Note that because the transcript for DRBD18 was targeted via RNA interference using the 3′ UTR, many reads were counted for the gene in the induced samples, artificially marking DRBD18 as being reduced in translation. After a closer analysis of read distribution in all the samples, DRBD18 was consequently removed from the list of affected genes, leaving 60 transcripts in the TE DOWN set and a total of 101 transcripts with altered TE that is expected to lead to increased protein levels. Additionally, we identified another set of transcripts for which the rates of association with ribosomes change when DRBD18 is depleted, but because the transcript abundance changes significantly in the opposite direction, their translational output is buffered in a way that no overall changes in protein levels are expected (Supplemental Table S2). These are labeled “buffered,” and colored light and dark blue in Figure 3A. A final set of transcripts is changed at the level of mRNA abundance, which is accompanied by the expected change in translation rates (thus, no change in TE is observed) (Fig. 3A, green; Supplemental Table S2). Given the level of translational repression observed upon DRBD18 knockdown in Figure 2, it was somewhat surprising that only 60 mRNAs were identified as TE DOWN. However, some of the transcripts that are translated less efficiently, and therefore lose association with the ribosome, are present in high abundance (e.g., EP1 procyclin, Supplemental Fig. S3), and their loss from higher order polysomes may account for the observed phenotype. Overall, these data demonstrate that DRBD18 impacts the TE of a subset of mRNAs both positively and negatively.
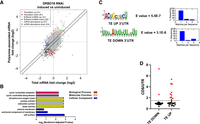
Ribosome profiling of cells depleted of DRBD18 reveals changes in TE. (A) Anota2seq plot showing changes in ribosome-associated transcripts against changes in abundance of total transcripts. mRNAs with altered TE (Translation), either enhanced or repressed, are in light and dark red, respectively. mRNAs that change at the level of abundance, but are then buffered at the translational level so that their protein output is not expected to change (Buffered), either in transcripts with lower or higher abundance, are in light and dark blue, respectively. mRNAs that are regulated mainly by their abundance (mRNA abundance), either up-regulated or down-regulated, are in light and dark green, respectively. (B) GO term analysis of translationally regulated mRNAs. Enriched GO term categories for the TE DOWN mRNAs are indicated on the left with the −log10 (Bonferroni adjusted P-value) shown on the bottom. Red bars correspond to enriched biological process categories, yellow bars to enriched molecular functions categories, and blue bars correspond to categories enriched cellular component categories. TE UP genes were not significant after the Bonferroni adjustment. (C) Enriched motifs in the 3′ UTRs of TE UP and TE DOWN sets. XSTREME analysis was performed on annotated 3′ UTRs longer than 6 nt. Sequence logo plot is illustrated for the most significant matches in the TE UP and TE DOWN data sets, with significance and number of motifs per sequence indicated to the right. (D) Correlation of TE UP and TE DOWN data sets with transcripts whose 3′ UTRs are shortened upon DRBD18 RNAi in BF. Red dots; those transcripts with reportedly higher CDS/3′-UTR read ratios upon DRBD18 depletion (Bishola Tshitenge and Clayton 2022).
To begin to characterize the set of mRNAs that are translationally regulated by DRBD18, we analyzed GO terms enriched in these sets. In the TE UP genes, enriched GO categories include those involved in carboxy-terminal protein methylation, signal transduction, mRNA processing, mRNA cleavage, and posttranslational modifications; however, none of these reached significance after Bonferroni correction. For the genes enriched in the TE DOWN set, we detected terms related primarily to adenylate cyclase activity (Fig. 3B). Indeed, six adenylate cyclases exhibited decreased TE upon DRBD18 depletion, while one had increased TE (Supplemental Table S2).
As translational regulatory elements are often found in 3′ UTRs, we next determined whether the TE UP and TE DOWN transcripts contain conserved motifs in their 3′ UTRs using XSTREME (Grant and Bailey 2021). Of the 41 genes with increased TE and 60 genes with decreased TE, 26 (63%) and 38 (63%), respectively, had annotated 3′ UTRs that allowed comprehensive motif analysis. These UTRs had varying lengths (range 75–11,187 nt for those in the TE UP set, averaging 2038 nt; range of 38–4007 nt for the TE DOWN set, averaging 693 nt). A search for motifs using standard parameters (length 6–15 expected anywhere in the sequence) yielded six and eight motifs, respectively. Figure 3C shows the most significant motifs by E value (by at least an order of magnitude): a 9 nt motif (ACUGCGUCU) for the TE UP data set and a U-rich sequence with one conserved A residue for the TE DOWN data set. Eighteen sites were discovered for this 9 nt motif in the TE UP data set (present in 69.2% of input UTRs), and twenty of the U-rich sites were discovered in the TE DOWN data set (52% of input UTRs). Both motifs were typically present in one copy per transcript (Fig. 3C). The distinct motifs found in the TE UP and TE DOWN transcript sets suggest these motifs could be involved in translational regulation.
It was previously reported that DRBD18 knockdown in BF T. brucei led to the shortening of some transcripts’ 3′ UTRs. This set of transcripts was identified by an increase in reads from the open reading frame relative to those in the 3′ UTR upon DRBD18 depletion (limited to those transcripts with annotated 3′ UTRs) (Bishola Tshitenge and Clayton 2022). Thus, we next asked if our TE UP or TE DOWN transcripts were enriched for mRNAs previously identified as having shortened 3′ UTRs. Of our 41 TE UP mRNAs, 26 have annotated 3′ UTRs, and 10 of these (38%) exhibit 3′ UTR shortening in BF DRBD18 knockdowns (Fig. 3D). In contrast, only two of 37 (5%) of those TE DOWN mRNAs with annotated 3′ UTRs were reported to have shortened 3′ UTRs when DRBD18 was knocked down. It should be kept in mind that we interpret these results cautiously, because the 3′ UTR data set was obtained in BF, whereas our ribosome profiling data set was obtained in PF. Nevertheless, these findings suggest that some fraction of DRBD18-mediated translational repression may occur through alterations of mRNA 3′ UTRs.
DRBD18 regulates TE of life cycle stage-specific transcripts
To further assess the impact of DRBD18-mediated translational regulation, we asked whether there were any life cycle stage-specific patterns to the translationally affected transcripts. To this end, we took advantage of published data sets that describe protein expression changes during the parasite life cycle. We used a tool to visualize proteome-wide ordered protein abundances in BF versus PF cells (Tinti and Ferguson 2022) to highlight the TE UP and TE DOWN sets (Fig. 4A, magenta and yellow, respectively). In this published proteome, we identified 26 genes from our TE UP and 42 genes from our TE DOWN data sets. Of these, we observed a correlation between transcripts in the TE DOWN set and those proteins that are more highly expressed in PF (Fig. 4A, vertical box). Similarly, we identified a correlation between transcripts in the TE UP set and those proteins that are more highly expressed in BF (Fig. 4A, horizontal box). To quantify these associations, we obtained intersection lists between the TE UP and TE DOWN transcripts and the PF- and BF-specific proteins (defined arbitrarily by manually selecting values below 3.7 on a given axis), and we tested these lists by hypergeometric tests to determine the significance of the overlap. For TE UP and PF-specific proteins, and TE DOWN and BF-specific proteins, the overlaps were not statistically significant. However, for TE DOWN and PF-specific proteins, a significant overlap was observed, and this included numerous adenylate cyclase gene products (Fig. 4B). While the TE UP and BF-specific proteins overlap did not reach statistical significance due to the large number of BF proteins in the published proteome, 41% (12 out of 29) of the TE UP genes that were also present in the proteome are BF-specific (Fig. 4C). Interestingly, in the set of TE UP transcripts whose protein products are BF-specific, we identified RBP10, a positive regulator of the BF life cycle stage (Mugo and Clayton 2017). To confirm this finding, we performed western blot analysis of RBP10 in DRBD18 replete and depleted conditions. As expected, almost no RBP10 is detected in uninduced PF DRBD18 RNAi cells (Fig. 4D). However, when DRBD18 is depleted, we observe a dramatic increase in RBP10 signal, identifying DRBD18 as a negative regulator of RBP10 protein production in PF. Overall, these data demonstrate that DRBD18 plays a role in maintaining the PF state by enhancing the translation of a subset of PF-specific proteins and repressing the translation of a subset of BF-specific proteins.
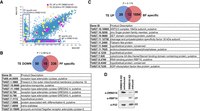
DRBD18 contributes to the maintenance of the procyclic translatome by repressing the translation of bloodstream-specific and enhancing the translation of procyclic-specific transcripts. (A) An available data set of protein abundances (Tinti and Ferguson 2022) in procyclic versus bloodstream life cycle stages is plotted with genes from the TE UP and TE DOWN categories highlighted in magenta and yellow, respectively. A cutoff value of 3.7 on each axis was arbitrarily selected to enrich protein lists in procyclic- and bloodstream-specific proteins. (B) Venn diagram of the intersection between the TE DOWN category and procyclic (PF) specific proteins. A hypergeometric test was performed to assess the significance of these intersections. A list of intersecting genes is shown below. (C) Venn diagram of the intersection between the TE UP genes and bloodstream (BF) specific proteins. A hypergeometric test was performed to assess the significance of these intersections. A list of intersecting genes is shown below. (D) Western blot of RPB10 (Tb927.8.2780), confirming its up-regulation upon DRBD18 knockdown in PFs. P22 is a loading control.
Given the life cycle-specific nature of many transcripts that are translationally regulated by DRBD18, we next asked if DRBD18 is also involved in the translational regulation of MF-specific genes. In a previous study, mass spectrometry analysis identified sets of proteins whose abundance increases or decreases in MFs generated in culture by RPB6 overexpression (Christiano et al. 2017). We first compared our translationally DRBD18-regulated data sets to the MF/PF protein expression ratios from this study (Fig. 5A). We identified a significant difference between the TE DOWN and TE UP transcripts with regard to their expression in MF versus PF (Fig. 5). Transcripts that are translationally repressed in the absence of DRBD18 tend to have low relative MF/PF expression. Conversely, transcripts that are translationally enhanced in the absence of DRBD18 tend to have higher MF expression relative to PF expression. We next compared the gene lists from our TE UP data set and those transcripts that are increased in MF (MF up) and identified seven overlapping genes; this overlap was significant as indicated by a hypergeometric test (Fig. 5B). Similarly, comparison of the overlap between our TE DOWN data set and those genes that are decreased in MF identified nine overlapping genes, again with a significant overlap (Fig. 5C). Thus, DRBD18 further contributes to maintenance of the PF state by repressing translation of a set of MF-specific transcripts and enhancing translation of transcripts that are more highly expressed in PF.
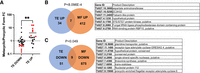
DRBD18 contributes to the maintenance of the procyclic translatome by repressing the translation of metacyclic-specific and enhancing the translation of procyclic-specific transcripts. (A) An available data set of protein abundances in procyclic versus metacyclic life cycle stages (Christiano et al. 2017) was analyzed for correlation with our TE data set. Transcripts were segregated by TE DOWN or TE UP, and the protein fold change (FC) in metacyclics versus procyclics was plotted for each gene that was present in the proteome. (**) P = 0.0063 by Student's t-test. Red dots, nine TE DOWN transcripts with metacyclic (MF)/procyclic (PF) FC values of <0.5, and seven TE UP transcripts with MF/PF FC values of >2.0. (B) Venn diagram showing the intersection of TE UP and metacyclic (MF) up genes; identities of the seven overlapping genes are shown to the right. (C) Venn diagram showing the intersection of TE DOWN and MF down genes; identities of the nine overlapping genes are shown to the right. In (B) and (C), hypergeometric tests were performed to assess significance of these intersections.
Global proteome of PF cells depleted in DRBD18 reveals that protein level changes accompany changes in TE
As changes in TE are expected to perturb the proteome, we next asked whether we could identify proteomic changes in DRBD18-depleted cells consistent with the translation effects identified by ribosome profiling. Using quantitative mass spectrometry, we detected 4734 proteins with an average of 8.1 peptides per protein (Supplemental Table S3). We identified 322 proteins that yielded a >50% FC upon DRBD18 RNAi (protein ratio <0.67 or >1.5) while reaching a level of significance (P < 0.05). Of these, 152 are up-regulated, and 170 are down-regulated. We identify by mass spectrometry peptides corresponding to 23 out of the 41 TE UP transcripts. Of these 23, eight were up-regulated at the protein level (Fig. 6; Supplemental Table S3). As expected, RBP10 (Tb927.8.2780) was significantly up-regulated. In addition, ZC3H32 (Tb927.10.5250), a BF-specific, essential cytosolic mRNA-binding protein that can repress translation when tethered to a reporter (Klein et al. 2017), is also up-regulated. Glycogen synthase kinase 3 (Tb927.10.13780), an enzyme previously studied as a potential drug target (Ojo et al. 2008), was up-regulated upon DRBD18 knockdown as well. For the 60 TE DOWN transcripts, we identified corresponding peptides for 28 out of these 60 by mass spectrometry, and eight of the corresponding gene products were identified in the down-regulated proteome (Fig. 6; Supplemental Table S3). These include the GRESAG4 (Tb927.11.1480), an adenylate cyclase that is translationally enhanced in PF (Durante et al. 2020). Thus, taking into account the number of TE transcripts for which peptides were detected, we corroborate approximately one-third of the detected TE changes at the protein level. The absence of corresponding changes for the remaining translationally regulated mRNAs and our global proteome data may have several explanations. For example, we noted that some proteins encoded by TE UP and TE DOWN transcripts did change abundance in the expected direction, but were slightly outside our significance criteria. For others, this discrepancy may be explained by the existence of posttranslational controls, such as phosphorylation, methylation, or ubiquitination that modulate protein stability. Collectively, these data demonstrate that DRBD18 impacts the PF T. brucei proteome, and does so at least in part by affecting the TE of a subset of transcripts.
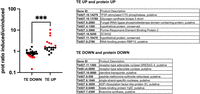
Changes in the proteome accompany TE changes detected by ribosome profiling in DRBD18-depleted cells. The protein ratio in cells depleted of DRBD18 (induced) versus that in uninduced cells is plotted for our TE DOWN and TE UP data sets. The significance between the TE DOWN and TE UP data sets was calculated by Student's t-test; (***) P = 0.0007. The TE genes whose products are also significantly altered in the proteome are indicated in red and listed on the right.
DRBD18 associates with numerous translationally regulated mRNAs
Because DRBD18 RNAi leads to changes in the abundances of several RBPs, some alterations in TE could occur indirectly through the actions of other RBPs. To begin to define which DRBD18-mediated changes in TE can be attributed to direct DRBD18 action, we performed RNA immunoprecipitations (RIPs), followed by qRT-PCR analysis of selected translationally altered mRNAs. Figure 7 (red numbers) shows that of six TE UP transcripts tested, all six (100%) exhibited significantly higher binding to anti-DRBD18 antibody-coated beads than to control beads. This includes mRNAs encoding RBP10 (Tb927.8.2780) and ZC3H32 (Tb927.10.5250), as well as additional mRNAs that are increased in MF and/or BF. Of the 10 TE DOWN transcripts tested (note that two of the primer pairs target two transcripts each), three (30%) showed significant binding to DRBD18, each of which is PF specific. However, the enrichment of TE DOWN mRNAs (Fig. 7, black numbers) was typically lower than that of TE UP mRNAs (Fig. 7, red numbers). Together, these data strongly support a model in which DRBD18 binding to a subset of mRNAs leads to their translational repression. A small number of transcripts may also undergo DRBD18-mediated translational enhancement.
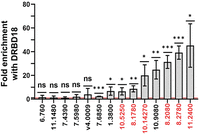
DRBD18 associates with a subset of transcripts whose translational it regulates. Ten mRNAs translationally repressed by DRBD18 knockdown (black numbers) and six mRNAs translationally enhanced by DRBD18 knockdown (red numbers) were quantified in DRBD18 immunoprecipitations by qRT-PCR. Note that the primers targeting Tb927.6.760 also target Tb927.6.790, and those targeting Tb09.v4.0009 also target Tb927.9.15660. Values shown are fold enrichment in the DRBD18 pull-down compared to a blank bead control. Red line indicates no enrichment. The experiment was performed in biological triplicate, each with three technical qRT-PCR triplicates, and significance was calculated by Student's t-test. ns, not significant; (*) P < 0.05; (**) P < 0.01, (***) P < 0.001. Numbers indicate gene numbers from TriTrypDB.
DISCUSSION
Translational control constitutes a major mechanism of gene regulation in T. brucei, including during life cycle progression (Jensen et al. 2014; Vasquez et al. 2014). However, the factors that impact the translatability of specific transcripts are poorly understood. In this manuscript, we report an expanded gene regulatory role for the T. brucei RBP, DRBD18, using ribosome profiling to quantify its impact on the TE of PF mRNAs. We found that DRBD18 regulates the translational outputs of over 100 mRNAs in PF cells, with both increases and decreases in TE observed upon DRBD18 knockdown. Depletion of DRBD18 leads to decreasing the TE of several PF-specific mRNAs and increasing the TE of both BF- and MF-specific mRNAs, highlighting a role for DRBD18-mediated translational control in life cycle stage maintenance.
The impacts of DRBD18 on translation could be direct or indirect, with specific mRNAs subject to distinct mechanisms. In support of direct control by DRBD18, we show here using RIP/qRT-PCR that DRBD18 associates with numerous transcripts whose TE it regulates. While this association could be through direct DRBD18-mRNA binding or indirect via another RBP, it provides strong evidence that DRBD18-containing mRNP complexes mediate some of the TE changes reported here. Specifically, all six of the TE UP transcripts tested were associated with DRBD18, strongly supporting a role for DRBD18 in translational repression. In contrast, less than one-third of TE DOWN transcripts were bound and then typically with lower enrichment values, suggesting a less prominent direct role for DRBD18 in translational enhancement. Notably, none of the five tested adenylate cyclase transcripts tested were enhanced in DRBD18 pull-downs, suggesting an indirect effect of DRBD18 on this family of mRNAs. We also show here that a fraction of DRBD18 associates with translating ribosomes. It is not yet known if this association promotes or inhibits translation of DRBD18-bound transcripts, or whether there are transcript-specific effects. Additionally, we show that DRBD18 interacts with the translation initiation factor, eIF3a. Our previous pull-down/mass spectrometry study identified the majority of T. brucei eIF3 subunits with DRBD18 in PF, suggesting DRBD18 interacts with the intact eIF3 complex (Lott et al. 2015). However, a similar study in BF T. brucei revealed only the eIF3a subunit (Bishola Tshitenge and Clayton 2022). These findings may reflect life cycle-specific differences in DRBD18 interactions, or they may be due to technical differences. eIF3a pull-downs in PF T. brucei did not identify DRBD18 (Li et al. 2017), suggesting that only a small subset of total eIF3a binds DRBD18. Beyond its well-known function in the assembly of the 43S preinitiation complex, eIF3 has recently been reported to function in all stages of translation, including noncanonical modes of translation initiation, repression, and termination, as well as nonsense-mediated decay and protein quality control, with some functions being subunit-selective (Valasek et al. 2017; Wolf et al. 2020). The eIF3a subunit reportedly exerts both positive and negative transcript-specific effects on translation in mammalian cells. Thus, it will be exciting in the future to determine the precise interactions between DRBD18 and eIF3 and how these modulate the translation of specific transcripts.
The TE of those mRNAs that are enriched in DRBD18 RIP/qRT-PCR could be impacted by direct effects on translation, through association or dissociation with ribosomes, as discussed above. Alternatively, they may occur via other changes to RNA processing with downstream effects on translation. While DRBD18 impacts the nuclear export of a subset of mRNAs (Mishra et al. 2021), we note that these effects cannot be contributing to the TE changes seen here as we measured polysome-associated mRNA compared to cytoplasmic mRNA (see Materials and Methods). More importantly, DRBD18 impacts the 3′-UTR length of some mRNAs by modulating poly(A) addition sites in both BF and PF T. brucei (Bishola Tshitenge and Clayton 2022; J Bard, B Tylec, and L Read, unpubl.). Utilization of differential poly(A) addition sites on a given mRNA presumably leads to the inclusion and exclusion of translational regulatory elements in mRNA 3′ UTRs (Clayton 2019). Comparison of our PF TE UP and TE DOWN data sets to mRNAs reported to have altered 3′ UTRs in BF DRBD18 knockdowns revealed shortened 3′ UTRs in 38% of TE UP transcripts, while TE DOWN transcripts showed little correlation with changes in 3′ UTR length. Current experiments are focused on identifying the entire cohort of DRBD18-mediated changes in poly(A) addition sites in PF. These studies will then allow us to precisely define the intersection between mRNAs with altered TE in this study and those with altered 3′ UTRs, and to define and test potential translational regulatory elements.
Comparison of mRNAs that are translationally regulated by DRBD18 with published data sets of life cycle-specific protein expression (Christiano et al. 2017; Tinti and Ferguson 2022) uncovered a previously unknown and important role for DRBD18: contributing to the maintenance of the PF state. DRBD18 knockdown led to derepressed translation in PF of numerous transcripts that are normally up-regulated in BF and MF. One of the most striking was RBP10, a BF-specific repressor that strongly promotes the BF life cycle stage in T. brucei (Wurst et al. 2012; De Pablos et al. 2017; Mugo and Clayton 2017). Here, we show by ribosome profiling, mass spectrometry, and western blot that RBP10 translational output is increased after DRBD18 depletion in PF. Additionally, DRBD18 associates with RBP10 mRNA as shown by RIP/qRT-PCR. In BF, RBP10 binds PF-specific mRNAs via a UA(U)6 motif, and targets them for degradation and translational inhibition, although the order of events is unclear (Mugo and Clayton 2017; Clayton 2019). Conversely, ectopic expression of RBP10 in PF, similar to the increased RBP10 expression we observe in PF after DRBD18 knockdown, led to cells that could only grow as BF and in which polysomal mRNA analysis suggested conversion to BF (Mugo and Clayton 2017). We show here that DRBD18 is critical for repressing RBP10 levels in PF, normally keeping both RBP10 mRNA abundance and TE low (Supplemental Table S2). Thus, we predict that one mechanism by which DRBD18 helps maintain the PF state is through its effect on RBP10 expression. Consistent with this prediction, the RBP10-binding motif, UA(U)6, is reminiscent of the top motif identified in our TE DOWN data set, suggesting that increased RBP10 may bind and contribute to translational repression of some PF-specific mRNAs upon knockdown of DRBD18 in PF. However, additional mechanisms must be at play, since many transcripts whose TE is altered in our data set are not targets of RBP10, including six of the 10 that overlap the PF-specific set (Mugo and Clayton 2017). Another BF-specific protein whose TE is increased and which is up-regulated in the proteome after DRBD18 knockdown, is the RBP, ZC3H32. ZC3H32 is a repressor that negatively impacts the expression of reporter mRNAs to which it is tethered (Klein et al. 2017); thus it may be repressing specific mRNA abundance and/or translation in PF DRBD18 knockdown cells. ZC3H32 is also up-regulated 16-fold during metacyclogenesis (Christiano et al. 2017). Together, our data indicate that in PF T. brucei, DRBD18 normally acts upstream of both RBP10 and ZC3H32, repressing both their RNA abundance and translatability. This, in turn, keeps RBP10 and ZC3H32 from repressing specific PF transcripts, some of which may be represented in our TE DOWN data set in DRBD18 knockdown cells.
The role of DRBD18 in repressing RBP10 expression in PF is somewhat unexpected, as DRBD18 plays the opposite role in BF. We show here that DRBD18 depletion leads to a 10-fold increase in RBP10 protein (Supplemental Table S3), whereas in BF, DRBD18 depletion caused a threefold decrease in RBP10 protein (Bishola Tshitenge and Clayton 2022). One potential mechanism by which DRBD18 may effect such functions is its presence in distinct mRNPs. For example, two abundant, constitutively expressed T. brucei RBPs are DRBD2 and ZC3H41 (Clayton 2019). Of these, DRBD18 reportedly interacts with DRBD2 in BF and ZC3H41 in PF (Lott et al. 2015; Bishola Tshitenge and Clayton 2022), and distinct mRNPs likely have different roles in gene regulation. The basis for this binding specificity is unknown. However, arginine methylation of DRBD18 affects its protein–protein interactions in PF (Lott et al. 2015), and it is possible that the protein is differentially methylated in a life cycle-specific manner. Together, these data implicate DRBD18 in promoting the PF state in PF, while promoting the BF state in BF.
The current study has expanded our understanding of the critical regulatory RBP, DRBD18, in T. brucei. In addition to its previously described roles in regulating transcript abundance (Lott et al. 2015; Bishola Tshitenge and Clayton 2022), poly(A) site selection (Bishola Tshitenge and Clayton 2022), and mRNA nuclear export (Mishra et al. 2021), we show here that transcript-specific regulation of TE contributes to DRBD18's remodeling of the PF proteome. Overall, DRBD18 appears to play an important role in maintaining life cycle stage identity in T. brucei.
MATERIALS AND METHODS
Generation of cell lines
PF T. brucei strain 29–13 and all cell lines derived from this strain were grown at 27°C in SM medium supplemented with 10% fetal bovine serum (FBS) containing hygromycin (50 µg/mL) and G418 (15 µg/mL). The 29-13-derived PF cell line containing a doxycycline-inducible RNA interference construct that targets the 3′ UTR of DRBD18 (Tb927.11.14090) was described elsewhere (Lott et al. 2015). An endogenous eIF3a subunit was tagged carboxy-terminally with an HA tag by the PCR only methodology (Dean et al. 2015) using forward primer 5′-TGCCTACGAAAGGTAAAGTATCTAAGCGTGATGAACAACAAATGCTTCTGGAAATGGAGAAAGAGCGCCTACAAGGGAAGGGTTCTGGTAGTGGTTCC-3′ and reverse primer 5′-CTACTTATACCACCTATTCCCCTTCAACAGGTACTCACTTATTACCTCTTAAGCTACCGTATTAAGACCCCCTTCGAAGCCCAATTTGAGAGACCTGTGC-3′, creating an amplicon with a blasticidin selection cassette. After transfection of parental cells with 10 µg of a gel-purified PCR product, positive transfectants were selected with 20 µg/mL blasticidin and resistant clones were obtained by limiting dilution. To create the KRBP16 3′-UTR RNAi cell line, we PCR-amplified a 535-bp fragment of the KRBP16 3′ UTR, as annotated in the TriTrypDB gene database (Tb927.11.7900), using T. brucei Lister 427 genomic DNA as a template. Forward primer (GATCGGATCCCAGTGGTTAAGCGGAGGGGGAAAAAGTTCTTATTCGC) and reverse primer (GATCAAGCTTGGAGACACGTTATATATAGCATTAAGACACGCTCAAAAA AAGACGACCTGCACCC) were designed with 5′ overhangs containing the BamHI and HindIII restriction sites, respectively. The KRBP163UTR RNAi amplicon was blunt-end ligated into the pJet cloning vector using the CloneJET PCR Cloning Kit (Thermo Fisher), and the pJet-KRBP163UTR plasmid was transformed into competent DH5α Escherichia coli. The resulting pJet-KRBP163UTR plasmid was dual-digested with BamHI and HindIII, the KRBP163UTR insert was gel-purified, and ligated into the p2T7-177 vector in the BamHI and HindIII cloning sites. Approximately 2 × 10⁷ procyclic 29–13 cells were resuspended in 100 µL of electroporation buffer containing 10 µg of NotI-digested p2T7-177 KRBP163UTR RNAi plasmid, electroporated using the Lonza Nucleofector device, and immediately transferred to 40 mL of prewarmed SDM79 growth medium supplemented with 15% FBS. After 24 h, 1 mL of transfectant parasites were diluted with 19 mL fresh medium, and phleomycin was added to a final concentration of 2.5 µg/mL. Clones were obtained by limiting dilution, and KRBP16 depletion was validated by western blot.
Antibodies and western blot
After SDS-PAGE in 12.5% gels, transfer to nitrocellulose membranes, and blocking in TBST with 5% nonfat dry milk, proteins were identified by probing with rabbit polyclonal antibodies against DRBD18 (Lott et al. 2015) (1:2500 dilution), p22 (Hayman et al. 2001) (1:5000 dilution), RBP16 (Hayman et al. 2001) (1:2000 dilution), rat polyclonal antibodies against RBP10 (Wurst et al. 2012) (1:500 dilution; a generous gift from Christine Clayton and Susanne Kramer), RPL5 (Ciganda et al. 2012), or mouse monoclonal antibody against hemagglutinin (Thermo Scientific, cat # 26183) (1:5000 dilution). Blots were washed and incubated with either goat anti-rabbit HRP or goat anti-mouse HRP (1:10,000 dilutions). Signal was detected using enhanced chemiluminescence detection (Thermo Scientific, SuperSignal West Pico Plus), imaged in a ChemiDoc system (Bio-Rad), and analyzed using Bio-Rad Image Lab software.
Polysomal profiles
PF cells were grown to log phase in SMD79 medium at 28°C, and between 1 and 5 × 10⁸ cells were sedimented at 3000 rpm for 10 min. Cells were resuspended in 5 mL of medium containing cycloheximide at a final concentration of 100 µg/mL, incubated for 5 min, washed in PBS containing cycloheximide, and finally resuspended in 750 µL of buffer A (10 mM Tris pH 7.4, 300 mM KCl, 10 mM MgCl2) supplemented with cycloheximide (or left cycloheximide-free for puromycin treatment), protease inhibitors (Roche), RNase out (Invitrogen), and 1 mM dithiothreitol (DTT). Following a 3 min incubation, 125 µL of lysis buffer (buffer A supplemented with sucrose at 0.2 M final concentration and NP-40 1.2%) was added, and the cells were lysed in a Dounce homogenizer (30–50 strokes). The lysate was cleared by centrifugation (12,000g, 10 min at 4°C) and supplemented with heparin (10 mg/mL) and RNase out (40 U). For polysome disruption, lysates were either treated with EDTA (30 mM final concentration) or puromycin (2 mM final concentration in the absence of cycloheximide), supplemented with KCl 500 mM, and incubated for 15 min at 4°C, then 15 min at 37°C prior to loading on the gradients. Equivalent OD260 units of the resulting cytoplasmic extracts were then layered onto 10%–40% sucrose linear gradients (generated using a Biocomp gradient maker) and centrifuged at 4°C for 2 h at 230,000g using a SW41Ti rotor and an Optima XPN 100 ultracentrifuge. Following ultracentrifugation, the gradient was fractionated using a tube piercer (Brandel) and analyzed on an ISCO UV detector paired to a fraction collector. Data were digitized using a DATAQ DI-149 data acquisition instrument. Protein was purified from fractions using methanol chloroform precipitation. Briefly, samples were mixed sequentially with four volumes of methanol, one volume of chloroform, and three volumes of water, and then centrifuged at 14,000g for 1 min. The upper aqueous layer was removed, preserving the protein interface which was then washed with four volumes of methanol, and recovered by centrifugation and subsequent drying and resuspension in SDS-PAGE sample buffer.
Polysome profiles with uninduced and induced DRBD18 RNAi cells were performed with cyclohexamide as described above. Gradients with lysates from uninduced and induced cells were run in parallel.
Ribosomal profiling
Ribosomal profiling experiments were performed in biological triplicate. To prepare ribosomal footprints, 5 × 10⁸ PF T. brucei cells containing the doxycycline-inducible RNAi construct for DRBD18 silencing were grown in SDM79 medium, supplemented with 10% FBS, at a density of 5–10 × 106 cells/mL and induced with 4 µg/mL doxycycline for 24 h. Induced and uninduced cells were then collected by centrifugation at 3000g for 10 min, resuspended in a twentieth of the original volume of medium, and subsequently treated with 100 µg/mL cycloheximide for 3 min. The cells were then rapidly chilled with the addition of four volumes of ice-cold PBS and centrifuged at 3000g, 4°C, for 10 min, washed in ice-cold polysome buffer (10 mM Tris-HCl pH 7.4, 300 mM KCl, and 10 mM MgCl2) and, if necessary, quickly frozen in liquid nitrogen. Thawed cells were then resuspended in a twentieth of the volume of ice-cold polysome buffer and lysed by the addition of one-third volume of polysome buffer containing 0.2 M sucrose and 0.1% NP-40, incubated 10 min on ice and subjected to 30 strokes of a Dounce homogenizer with a tight-inner tolerance pestle. The lysates were cleared by centrifugation at 12.5k rpm for 15 min in a microcentrifuge and then treated with RNase I (1500 U) on ice for 2 h. Cleared lysates were run on a 10%–40% sucrose linear gradient at 4°C for 3 h at 230,000g. RNA was purified from the monosome fraction (TRIzol), run on UREA-PAGE, and size-selected by gel-purifying the 20–100 nt fragment of each lane. The RNA was dephosphorylated with calf intestinal phosphatase, reprecipitated, and was then ready for library preparation. Control, nonribosome protected RNA was isolated from the cleared lysate (TRIzol) and fractionated to a comparable size range by zinc-mediated fragmentation (Invitrogen) prior to gel purification.
Library preparation, sequencing, and analysis
Libraries were prepared using the Illumina NEBNext Multiplex Small RNA Library Prep Set 1. Samples were sequenced at the UB Genomics and Bioinformatics Core on a HiSeq 2500. Quality filtered reads were mapped to the T. brucei TREU927 genome (version 52, http://tritrypdb.org) using bowtie2 (doi.org/10.1038/nmeth.1923) in very sensitive-local mode. The number of reads per annotated mRNA was determined using featureCounts (doi.org/10.1093/bioinformatics/btt656). The count table was manually curated, and outliers were removed from the analysis. Features with less than two counts per million were removed from further analysis (8966 genes passed these criteria). Between 150,000 and 950,000 reads per sample were mapped; low counts were due to heavy contamination of rRNA in the sequenced samples. To evaluate differential translation efficiency (TE), the anota2seq package (doi.org/10.1093/nar/gkz223) (Oertlin et al. 2022) was applied with default parameters (log2FC > |1| and false discovery rate [FDR] < 0.15). As before, experimental batch effects were introduced as a variable in the linear model. This software classifies mRNAs into three categories; the “translation” group is defined as genes where a significant difference in translation occurs because of a change in TE. In the “mRNA abundance” group are mRNAs that significantly change both their translation and mRNA steady-state level (not changing their TE). Finally, the “buffered” group consists of mRNAs that change their steady-state level, but this change does not yield a modification of the translation level of the protein (by modification of the TE). See Supplemental Table S2 for normalized counts per gene (using DESeq2) and complete anota2seq results. Data normalization assumes that overall expression levels are not affected; however, in our conditions, a global reduction in translation is observed. In this scenario, normalization will compensate for the global effect, such that the “up” and “down” regulation refers to the average change for the population of transcripts. That is, up-regulated or down-regulated genes in our lists are more regulated than the average gene. However, the absolute change cannot be quantified precisely. Overrepresentation of GO terms among DEGs lists was established using the tools available at TriTrypDB (http://tritrypdb.org/) using an adjusted P-value of less than 0.05 as a cutoff for significance. Statistical analysis and plots were performed in R, unless otherwise specified. Python in-house scripts were used to analyze the size of mapped reads in each sample.
Proximity ligation assay
PF was fixed with 2% formaldehyde, deposited on poly-l-lysine coated slides, permeabilized with 0.5% NP40, and blocked with Duolink Blocking Solution (SIGMA) for 60 min at 37°C. The fixed cells were first incubated with primary antibodies against target proteins raised in different species (rabbit anti-DRBD18) (Lott et al. 2015) and mouse monoclonal anti-HA (cat # 26183, Invitrogen), and then with Duolink Probes MINUS and PLUS. The probes were ligated and amplified according to the manufacturer's instructions. Serial image stacks (0.2 μm Z-increment) were collected with capture times from 100 to 400 msec (100× PlanApo, oil immersion, 1.46 na) on a motorized Zeiss Axio Imager M2 stand equipped with a rear-mounted excitation filter wheel, a triple pass (DAPI/FITC/Texas Red) emission cube, differential interference contrast (DIC) optics, and an Orca ER CCD camera (Hamamatsu). Images were collected using Volocity 6.1 Acquisition Module (Improvision Inc.), and individual channel stacks were deconvolved by a constrained iterative algorithm, pseudocolored, and merged using Volocity 6.1 Restoration Module.
Proteomics
Sample preparation
A surfactant cocktail-aided extraction/precipitation/on-pellet digestion (SEPOD) protocol was used for sample preparation as previously described (Shen et al. 2018a).
Trypanosoma brucei cell pellets were suspended in 400 µL ice-cold surfactant cocktail buffer (50 mM Tris-formic acid [FA], 150 mM NaCl, 2% SDS, 0.5% sodium deoxycholate, 2% IGEPAL CA630, pH 8.4) supplemented with complete protease inhibitor cocktail tablets (Roche Applied Science). Samples were vortexed, placed on ice for 30 min for cell lysis, and sonicated by three sonication-cooling cycles (10 sec each) using a high-energy probe sonicator (Qsonica). Protein lysates were centrifuged at 18,000g, 4°C for 30 min, and the supernatant was transferred to new Eppendorf tubes. Protein concentration was determined by bicinchoninic acid assay. For protein digestion, 100 µg protein was aliquoted from each sample. Protein was reduced by 10 mM DTT at 56°C for 30 min and then alkylated by 25 mM iodoacetamide (IAM) at 37°C for 30 min in darkness. Both steps were performed with constant shaking at 550 rpm in a covered thermomixer (Eppendorf). Protein was precipitated by adding six volumes of ice-cold acetone with vigorous vortexing, and the mixture was incubated at −20°C for 3 h. Protein precipitated was pelleted by centrifugation at 18,000g, 4°C for 30 min, and was gently rinsed by 500 µL methanol. After removing all liquid, the protein pellet was left to air dry for 1 min, and 80 µL Tris-FA pH 8.4 was added to wet the pellet. A total volume of 20 µL trypsin (Sigma-Aldrich) dissolved in 50 mM Tris-FA pH 8.4 (0.25 µg/µL) was added to each sample to reach a final enzyme-to-substrate ratio of 1:20 (w/w), and samples were incubated in a covered thermomixer at 37°C for 6 h with constant shaking. Tryptic digestion was terminated by the addition of 1 µL FA, and samples were centrifuged at 18,000g, 4°C for 30 min. Supernatant was carefully transferred to LC vials for analysis.
LC–MS analysis
The LC–MS system consists of a Dionex UltiMate 3000 nano LC system, a Dionex UltiMate 3000 micro LC system with a WPS-3000 autosampler, and an Orbitrap Fusion Lumos mass spectrometer (Thermo Fisher Scientific). A large-inner diameter (i.d.) trapping column (300 µm i.d. × 5 mm, Agilent Technologies) was coupled to the analytical column (75 µm i.d. × 65 cm, packed with 2.5 µm XSelect CSH C18 material) for high-capacity sample loading, cleanup and delivery. For each sample, peptide equivalent to 4 µg protein was injected for LC–MS analysis. Mobile phases A and B were 0.1% FA in 2% acetonitrile (ACN) and 0.1% FA in 88% ACN. The 180-min LC gradient profile for the analytical column was: 4% B for 3 min, 4%–9% B for 5 min, 9%–30% B for 117 min, 30%–50% B for 10 min, 50%–97% B for 1 min, 97% B for 17 min, and then equilibrated to 4% for 27 min. The mass spectrometer was operated under data-dependent acquisition (DDA) mode with a maximal duty cycle of 3 sec. MS1 spectra were acquired by Orbitrap (OT) under 240k resolution for ions in the m/z range of 400–1500. Automatic gain control (AGC) target and maximal injection time was set to 175% and 50 msec, and dynamic exclusion was set as 60 sec, ±10 ppm. Precursor ions were isolated by quadrupole with a 1.6-Th m/z window for fragmentation by high-energy collisional dissociation (HCD) at 30% energy. MS2 spectra were acquired by OT under 15k resolution. AGC target and maximal injection time was set to 100% and 22 msec. Detailed LC–MS settings and information can be found in our previous publications (Shen et al. 2017, 2018b; Wang et al. 2021).
Data processing and analysis
An in-house developed UHR-IonStar pipeline was used for data processing and analysis. For protein identification, database searching was performed using the MS-GF+ search engine (v20210108, released in January 2021). Search parameters included: (i) Protein database: human Swiss-Prot protein sequence database (20,302 entries, downloaded in May 2020); (ii) Precursor mass tolerance: 20 ppm; (iii) Instrument type: Q-Exactive; (iv) Matches per spectrum: 1; (v) Dynamic modifications: oxidation of Methionines (M) and acetylation of peptide amino-termini; (vi) Fixed modification: carbamidomethylation of Cysteines (C); (vii) Maximal missed cleavages: 2. Peptide-spectrum match (PSM) filtering, protein inference/grouping, and FDR control were performed by IDPicker (v3.1.18192.0). Protein/peptide FDR was set to 1%, and a minimum of two unique peptides per protein was set. Proteins with no unique peptides were grouped with a maximum of 50 proteins per protein group. The filtered PSM list was generated by the UHR-IonStar APP (https://github.com/JunQu-Lab/UHRIonStarApp) using protein/peptide/PSM lists exported from IDPicker. For protein quantification, peptide quantitative features were extracted from LC–MS files using SIEVE (v2.2, Thermo Fisher Scientific) and processed by the UHR-IonStar APP to generate final quantification results. Main procedures included: (i) chromatographic alignment with ChromAlign (Sadygov et al. 2006) for data set-wide retention time (RT) calibration and peak clustering. Performance of the alignment step was evaluated by alignment scores in the entire data set; (ii) data-independent MS1 quantitative feature extraction using the direct ion-current extraction (DICE) method, which utilizes a predefined m/z-RT window (10 ppm, 1 min for 240 MS1 acquisition) to extract ion chromatograms for all precursor ions subjected to fragmentation and MS2 acquisition in the aligned data set. Each set of ion chromatograms with corresponding area under the curve (AUC) in the data set was termed as a “frame”; (iii) integration of the SIEVE frame database and the filtered PSM list by a unique identifier combining file name and MS2 scan number. Frames with valid peptide sequences were subjected to frame-level quality control, global data normalization, peptide-level outlier detection, and aggregation to the protein level. More detailed information about the UHR-IonStar pipeline can be found in our previous publications (Shen et al. 2018b; Wang et al. 2021). Quantification results were further processed by the UHR-IonStar APP for data formatting/cleanup, statistical testing by Student's t-test, and intergroup protein ratio calculation.
RIP qRT-PCR
RIP qRT-PCR was performed essentially as described (McAdams et al. 2018, 2019). Briefly, 1 × 10¹⁰ PF cells were harvested and washed once with cold 1× PBS (pH 7.4). Cells were resuspended in 25 mL no FBS SM media to a concentration of ∼5 × 10⁹ cells/mL−1 and transferred to a 100 × 15 mm Petri dish. Plates were incubated on ice, and UV irradiated at 400 mJ/cm2 in a Stratalinker 1800 (Stratagene). Cells were pelleted, washed with PBS, snap-frozen in liquid N2, and stored at −80°C until use. Cells were resuspended in 10 mL of lysis buffer (Tris-HCl [pH 7.5], 20 mM NaCl, 0.1% NP40, and 1% Triton X-100) and then lysed by passing through a 21-gauge needle 20 times. Cell lysate was centrifuged at 18,000 rpm for 30 min at 4°C, and the supernatant was adjusted to 150 mM NaCl. Crosslinked DRBD18-RNA complexes were immunopurified from cellular extracts using anti-DRBD18 antibodies (Lott et al. 2015) attached to Protein A fast flow beads (GE Healthcare); minus antibody crosslinked Protein A fast flow beads served as the control. Captured protein–RNA complexes were washed with wash buffer (Tris-HCl [pH 7.5], 150 mM NaCl, 0.1% NP40), and 5% of the beads from each sample were used for western blot to confirm the pull-down of DRBD18. Beads were treated with DNase I (Sigma) followed by proteinase K (Roche). RNA was extracted by phenol/chloroform, and cDNA was prepared using gene-specific primers (Supplemental Table S4). Subsequently, qRT-PCR was performed using 18S rRNA for normalization, and FC was calculated using the ΔΔCT method as previously described (McAdams et al. 2018, 2019). Note that the primers targeting Tb927.6.760 also target Tb927.6.790, and those targeting Tb09.v4.0009 also target Tb927.9.15660.
DATA DEPOSITION
RNA sequencing results are available at the Sequence Read Archive under project number PRJNA913808. The mass spectrometry proteomics data have been deposited to the Proteome Xchange Consortium via the PRIDE (Perez-Riverol et al. 2022) partner repository with the data set identifier PXD039064.
SUPPLEMENTAL MATERIAL
Supplemental material is available for this article.
ACKNOWLEDGMENTS
We thank Christine Clayton and Susanne Kramer for anti-RBP10 antibodies and Brianna Tylec for assistance with figure preparation. We also thank the UB Genomics and Bioinformatics Core, especially Don Yergeau. This work was supported by the NIH R01AI141557 to L.K.R. P.S. and J.S.-S. received financial support from the PEDECIBA and are members of ANII research career.
Footnotes
-
Article is online at http://www.rnajournal.org/cgi/doi/10.1261/rna.079625.123.
-
Freely available online through the RNA Open Access option.
- Received February 8, 2023.
- Accepted August 24, 2023.
This article, published in RNA, is available under a Creative Commons License (Attribution-NonCommercial 4.0 International), as described at http://creativecommons.org/licenses/by-nc/4.0/.
REFERENCES
MEET THE FIRST AUTHOR

Meet the First Author(s) is an editorial feature within RNA, in which the first author(s) of research-based papers in each issue have the opportunity to introduce themselves and their work to readers of RNA and the RNA research community. Martin Ciganda is the first author of this paper, “Translational control by Trypanosoma brucei DRBD18 contributes to the maintenance of the procyclic state.” He carried out this work while he was a Research Scientist at the University at Buffalo. Since then, he has taken on a role within the R&D Multi-Omics team (Cell Biology) at Thermo Fisher Scientific.
What are the major results described in your paper and how do they impact this branch of the field?
Life cycle transitions comprise checkpoints that integrate information from the environment and the cellular state to trigger coordinated changes in the protein landscape. This work shows that an RNA-binding protein alters the TE of subsets of mRNAs in the pathogenic parasite Trypanosoma brucei to favor the maintenance of the parasite in the insect stage. It adds to a growing understanding of RNA-binding proteins in development and differentiation.
What led you to study RNA or this aspect of RNA science?
There was a time when I thought I understood RNA, but that was before I learned about trypanosomes! From extensive editing of mitochondrial RNAs to trans-splicing, polycistronic mRNAs (in a eukaryote), and Pol I transcription of protein-coding genes, almost every aspect of our current understanding of RNA has been informed or expanded upon by the dedicated work of very talented scientists on these fascinating organisms.
During the course of these experiments, were there any surprising results or particular difficulties that altered your thinking and subsequent focus?
I think that about a week after I had a first result for this paper that was intriguing and suggested a set of follow-up experiments, the laboratory had to be shut down because of the pandemic. That led to a period of lots of reading, ideas, thinking, and discussions with the laboratory and collaborators before I could go back and tackle the next question hands-on. Even though it was frustrating at the time, there was also a valuable lesson in there about the importance to take the time to consider the power of a well-rounded hypothesis and a thought-out plan to falsify it.
What are some of the landmark moments that provoked your interest in science or your development as a scientist?
When I was in high school, my biology teacher was sick one day, and the substitute decided to explain to us the Jacob–Monod model of the lac operon (which I'm pretty sure was not on the syllabus). I was immediately hooked on how a seemingly mysterious “decision” by a microorganism on what food to metabolize could be so elegantly explained in terms of concrete interactions between molecules, and I could not wait to become a scientist myself to find out what other complex behaviors and observations could be analyzed and explained in this way. Although today I see the limitations of reductionism, it is the discovery of these fundamental networks and interactions that still excites me the most.
If you were able to give one piece of advice to your younger self, what would that be?
I would probably say to my younger self that he should not hesitate to seek out the help and advice of the big names that might seem intimidating to him at the time (more often than not they love to talk, and one can always be around taking notes and learning). Also, he should learn early on that research outside of academia can be just as exciting, and sometimes even more rewarding.
Are there specific individuals or groups who have influenced your philosophy or approach to science?
I started my scientific training in Uruguay, where I was inspired by the philosophy of many local giants, including Clemente Estable, whose idea that a small country can be made big through science (con ciencia grande no hay país pequeño) led to groundbreaking efforts in public and private investment in science. At one point I had the privilege of working at the institute he founded, where even today scientists continue to struggle for resources and funding, while producing research of excellent quality.




