


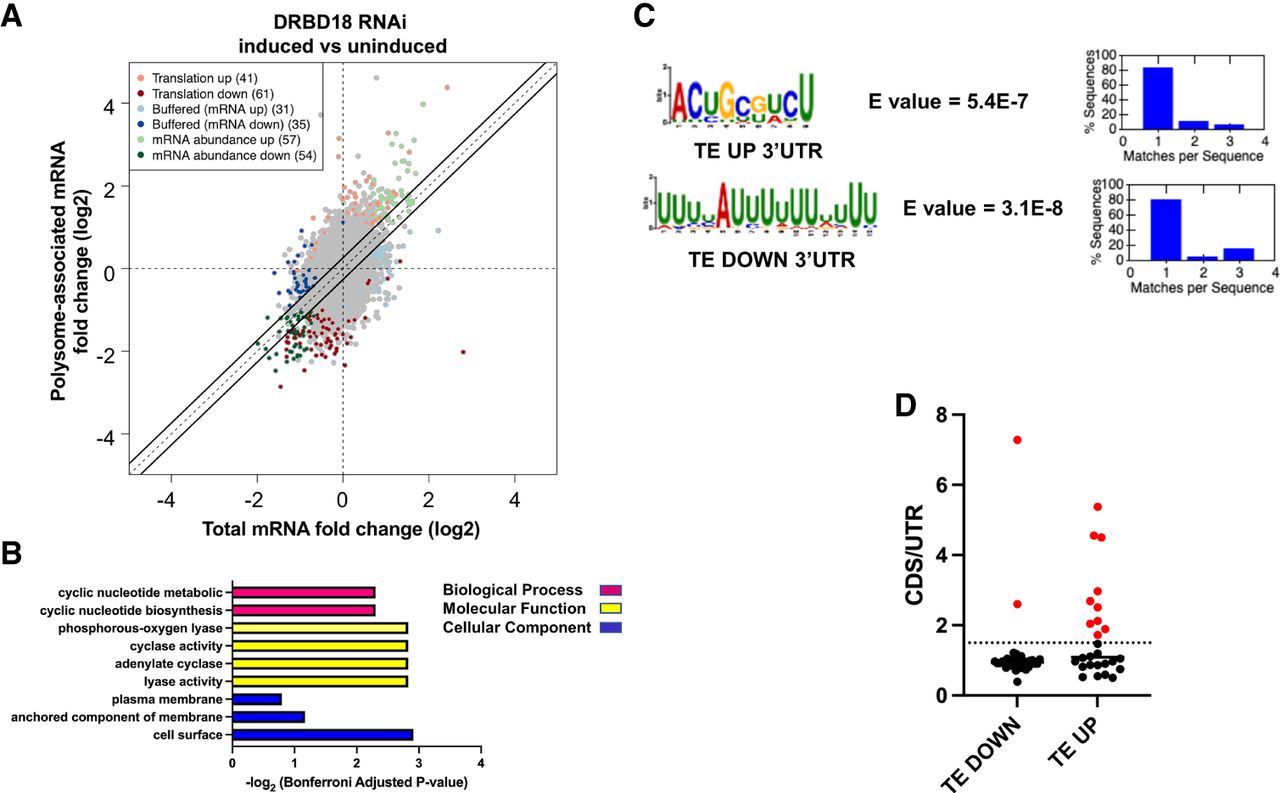
Ribosome profiling of cells depleted of DRBD18 reveals changes in TE. (A) Anota2seq plot showing changes in ribosome-associated transcripts against changes in abundance of total transcripts. mRNAs with altered TE (Translation), either enhanced or repressed, are in light and dark red, respectively. mRNAs that change at the level of abundance, but are then buffered at the translational level so that their protein output is not expected to change (Buffered), either in transcripts with lower or higher abundance, are in light and dark blue, respectively. mRNAs that are regulated mainly by their abundance (mRNA abundance), either up-regulated or down-regulated, are in light and dark green, respectively. (B) GO term analysis of translationally regulated mRNAs. Enriched GO term categories for the TE DOWN mRNAs are indicated on the left with the −log10 (Bonferroni adjusted P-value) shown on the bottom. Red bars correspond to enriched biological process categories, yellow bars to enriched molecular functions categories, and blue bars correspond to categories enriched cellular component categories. TE UP genes were not significant after the Bonferroni adjustment. (C) Enriched motifs in the 3′ UTRs of TE UP and TE DOWN sets. XSTREME analysis was performed on annotated 3′ UTRs longer than 6 nt. Sequence logo plot is illustrated for the most significant matches in the TE UP and TE DOWN data sets, with significance and number of motifs per sequence indicated to the right. (D) Correlation of TE UP and TE DOWN data sets with transcripts whose 3′ UTRs are shortened upon DRBD18 RNAi in BF. Red dots; those transcripts with reportedly higher CDS/3′-UTR read ratios upon DRBD18 depletion (Bishola Tshitenge and Clayton 2022).




