


Visualizing large RNA molecules in solution
- 1Department of Chemistry and Biochemistry, University of California, Los Angeles, California 90095, USA
- 2Department of Microbiology, Immunology and Molecular Genetics, University of California, Los Angeles, California 90095, USA
- 3California NanoSystems Institute, University of California, Los Angeles, California 90095, USA
Abstract
Single-stranded RNAs (ssRNAs) longer than a few hundred nucleotides do not have a unique structure in solution. Their equilibrium properties therefore reflect the average of an ensemble of structures. We use cryo-electron microscopy to image projections of individual long ssRNA molecules and characterize the anisotropy of their ensembles in solution. A flattened prolate volume is found to best represent the shapes of these ensembles. The measured sizes and anisotropies are in good agreement with complementary determinations using small-angle X-ray scattering and coarse-grained molecular dynamics simulations. A long viral ssRNA is compared with shorter noncoding transcripts to demonstrate that prolate geometry and flatness are generic properties independent of sequence length and origin. The anisotropy persists under physiological as well as low-ionic-strength conditions, revealing a direct correlation between secondary structure asymmetry and 3D shape and size. We discuss the physical origin of the generic anisotropy and its biological implications.
Keywords
INTRODUCTION
Single-stranded RNA (ssRNA) molecules consisting of thousands of nucleotides (e.g., messenger RNAs and ssRNA viral genomes) are responsible for a wide range of fundamental biological processes (Gesteland et al. 2006; Schneemann 2006). Yet, little is known about their native structures because they cannot be characterized with the high-resolution tools used for shorter RNAs such as transfer RNAs and ribozymes. For instance, long RNAs are unlikely to crystallize unless complexed with proteins or antibiotics (Nissen et al. 2000; Bashan et al. 2003), and their unperturbed structures therefore cannot be elucidated by the usual X-ray diffraction methods. Whereas high-field nuclear magnetic resonance (NMR) can directly and reliably probe the structures of short ssRNAs in solution (Flinders and Dieckmann 2006), this technique cannot be used for molecules longer than 1000 nt because of their slow rotational diffusion. Third, while low-resolution three-dimensional (3D) reconstructions of RNAs in solution can be obtained from small-angle X-ray scattering (SAXS) reconstructions, the method has generally been applied to RNA molecules ∼200 nt in length or shorter, often containing one dominant secondary structure (Lipfert et al. 2007a,b, 2008; Lamb et al. 2008). Applying this technique to larger RNAs is considerably more difficult because the scattered intensity relevant for overall size determination lies at very small angles, close to the incident beam. The method has been used so far for only one long RNA, the 3569-nt ssRNA of bacteriophage MS2 (Zipper and Folkhard 1975; Ribitsch et al. 1985; Zipper and Durschlag 2007). Finally, techniques such as negative-stain electron microscopy and atomic force microscopy are problematic because long RNA may be significantly altered by the staining, drying, and surface-adsorption interactions involved in sample preparation.
Apart from the technical constraints mentioned above, there are fundamental conceptual limitations to how precisely we can determine the 3D structure of long RNAs in solution. As for any large macromolecule—even the simplest linear polymer—the spatial conformation of each molecule differs from that of the next because of thermal fluctuations arising from random collisions with solvent molecules. Moreover, because long RNAs allow for a large number of intramolecular base-pairing combinations having the same energy (Yoffe et al. 2008), they are best represented by an ensemble of many thermally accessible secondary structures. Because the topological constraints for tertiary (overall) structures originate from secondary structure (Lilley 1998; Tinoco and Bustamante 1999; Lescoute and Westhof 2006; Bailor et al. 2010), the lack of a distinctly preferred secondary structure implies that no two molecules of the same sequence are likely to have the same 3D conformations. This diversity of spatial conformations implies that a long RNA molecule in solution behaves as a statistical object whose properties are derived from an ensemble of possible structures. It makes secondary (and implicitly tertiary) structure determination using the otherwise-powerful computational (Mathews et al. 1999; Zuker 2003) and chemical (Weeks 2010) techniques very challenging.
With the above limitations in mind, this work tackles the following questions about the nature of an ensemble of RNA molecules in solution: (1) Can we ascribe a specific size and shape (anisotropy) to an ensemble of fluctuating molecules of a given sequence? (2) Can we distinguish between the sizes and shapes of ensembles of different sequence lengths? and finally (3) How do the measured shapes and sizes, representing an ensemble of diverse secondary structures as noted above, compare with the volume swept out by the thermally accessible 3D conformations of predicted secondary structures? In other words, do long ssRNA molecules in solution bear any resemblance to thermodynamically equilibrated structures?
In the following sections, we describe a combined experimental and computational approach for elucidating the coarse-grained ensemble-averaged shape and size of long ssRNAs. The RNAs studied are all synthesized by in vitro transcription. In order to achieve reproducible ensembles, they are incubated in the buffer of interest for 24 h. Studies of the 6400-nt-long turnip yellow mosaic virus RNA (Eecen et al. 1985) show that this treatment is necessary and sufficient to achieve highly reproducible hydrodynamic properties. We visualize the low-resolution secondary structure (branching pattern) of individual RNA molecules by cryo-electron microscopy (cryo-EM) in order to compute their ensemble sizes and shapes. First, the RNAs are studied in solutions free of Mg2+ and other multivalent ions, thereby minimizing tertiary interactions and exposing more clearly the conformations of their native secondary (branched) structures. We then relate these shapes to those ultimately formed in Mg2+-containing physiological solution conditions and show that the diversity of structures in the ensemble is significantly reduced. This effect of Mg2+ is consistent with its well-known role in promoting condensation of large RNAs (Ribitsch et al. 1985; Buchmueller et al. 2000) or folding of smaller RNA molecules into unique native structures (Draper 2004; Caliskan et al. 2005; Chu et al. 2008).
The sizes and shapes deduced from analyses of cryo-EM images are in agreement with structures we obtain independently from 3D reconstructions of SAXS form factors (Konarev et al. 2006; Lipfert et al. 2007a; Lamb et al. 2008) and those we predict by molecular dynamics (MD) software recently developed (Jonikas et al. 2009) for simulating spatial conformations of RNA secondary structures. With this combination of approaches, we demonstrate that the 3D anisotropy of long ssRNAs can be directly deduced from analysis of their cryo-EM images. These results involve the first use of cryo-EM and MD simulations for investigating the structures of long (>500 nt) RNA molecules.
Our results show that, despite existing as an ensemble of slightly different thermally accessible secondary structures, an arbitrary primary sequence can be associated with a distinct large-scale pattern of branching that plays a dominant role in determining the overall size and shape of the molecule. We measure the maximal envelope containing all the spatial configurations of a large RNA and show that this represents an anisotropic flattened prolate volume (i.e., scalene ellipsoid). We argue that this anisotropy is a generic property of all large RNAs and elucidate its physical origin using graph theoretical and statistical analyses of secondary structure ensembles. Finally, we discuss the implications of this generic anisotropy for biological processes such as RNA–protein binding and viral self-assembly.
RESULTS
We study three RNA molecules with lengths 975, 1523, and 2777 nt; the first two correspond to noncoding sequences from yeast, and the third to a ready-to-translate positive-strand viral RNA molecule. The two shorter molecules share a significant portion of their nucleotide sequence; they are made by in vitro transcription, starting from the same (randomly chosen) position in an intergene region of chromosome XII of the yeast genome (Saccharomyces cerevisiae) (Cherry et al. 1997) (see Materials and Methods). The viral sequence is the second molecule (RNA2) in the tripartite genome of cowpea chlorotic mottle virus (CCMV) (Allison et al. 1989). The RNA lengths are picked to cover the range from 1000 to 3000 nt, with the precise lengths of transcripts determined only by the availability of reliable polymerase chain reaction promoter sites during DNA template preparation. We compare noncoding and coding sequences in order to emphasize the generic aspects of RNA shape.
Cryo-electron microscopy
In cryo-EM, molecules in aqueous buffers are flash-frozen to preserve their structures in a vitrified medium for observation. When many identical configurations can be averaged, single-particle reconstruction methods can yield atomic or near-atomic resolution, as in the case of protein assemblies in solution (Yu et al. 2008; Liu et al. 2010; Zhang et al. 2010) and shorter RNA molecules (Baird et al. 2010). With long RNA molecules, however, this is not possible because each sequence is necessarily associated with a large ensemble of secondary structures and 3D conformations. Figure 1, A and C, are typical many-molecule cryo-EM 2D-projection views of the 975-nt and 1523-nt RNAs in 10 mM Tris-EDTA (TE) solution, i.e., a Mg2+-free low-ionic-strength buffer.
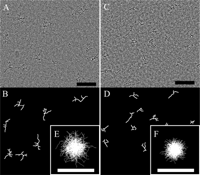
Cryo-EM images of RNAs in films of freely suspended vitrified solution. (A,C) Fourier band-pass filtered cryo-EM images of 1523-nt (A) and 975-nt (C) RNAs in vitrified 10 mM TE buffer. Individual RNA molecules with different configurations, suspended in random orientations, are seen as dark branched objects. (B,D) Traced skeletons (see Materials and Methods) of the molecules in panels A and C. For each RNA, the inset (E,F) depicts a hundred traced projections superimposed with their centers of mass in registry. Scale bars, 60 nm. (For more traces, see Supplemental Fig. S2.)
The cryo-EM contrast seen in Figure 1, A and C, arises primarily from the phosphorus-rich RNA backbone (dark), while the bright edges around the molecules result from phase contrast obtained by underfocusing the electron beam. The lateral resolution is sufficient to discern the width of double-stranded regions (for comparison of DNA and RNA, see Supplemental Fig. S1) and the overall branching in each distinct molecular projection. Corresponding branched “molecular skeletons,” attributable to the sequence-dependent secondary structures, are depicted as white traces (Fig. 1B,D) (see Materials and Methods) below each cryo-EM image. Earlier studies of small (<100 nt) RNAs by fluorescence resonance energy transfer (Lilley 1998; Zhuang 2005) and traditional EM imaging enhanced by tungsten shadow-casting (Wang et al. 1994), gold labeling (Beales et al. 2001), or the grafting of long duplexes (Nakamura et al. 1995) have revealed the numbers and relative orientations of duplexes emanating from a single junction. Here we deduce similar branching information for much longer molecules, without labeling or chemical/physical modification.
Hundreds of traced projections like those in Figure 1, B and D, have been collected from 20–50 cryo-EM micrographs, each containing many RNA molecules (see Supplemental Fig. S2). Figure 1, E and F, shows the superpositions of the centers of mass of 100 tracings for each of the two molecules. The circular shapes of the superimposed profiles indicate that the molecular orientations were random in the plane of imaging, hence unbiased by the (∼100 nm) (see Materials and Methods) thickness of the embedding vitreous ice or by any systematic shear alignment or imaging artifacts. The difference in radii of the profiles points clearly to the difference in sizes of the two molecules, but not in their shapes. To infer shapes, one would ideally calculate the radial density distributions of the molecules about their centers-of-mass. However, because we cannot discern features along the direction of projection (z) in the cryo-EM image of a molecule (and its traced skeleton by definition), a considerable amount of its mass is unaccounted for. Radial density distributions obtained from superimposed cryo-EM projections or traced skeletons (e.g., from Fig. 1E,F) are therefore inherently inaccurate. We circumvent this limitation by calculating the anisotropy of the smallest convex envelope (i.e., volume) containing all the observed configurations for each RNA. A method using Feret diameters (Walton 1948) is developed next to characterize the size and shape of this molecular ensemble volume.
To obviate the need to characterize the missing mass along z, the method relies only on the minimum and maximum extents of randomly oriented projections. In the present context, the maximum (or minimum) Feret diameter of an arbitrarily shaped object in a fixed orientation is the maximum (or minimum) distance that would be measured by infinitely long parallel faces of a set of calipers moved continuously around its 2D projection. The difference between these maximum (M) and minimum (m) diameters, divided by their sum, is a direct measure of the anisotropy [A = (M − m)/(M + m)] of that projection. A change in orientation of the object may lead to a change in anisotropy of its projection, and the average over all possible orientations characterizes the shape of the object.
Figure 2, C and D, shows histograms for the distributions of maximum and minimum Feret diameters obtained from at least a hundred tracings for each of the two molecules. The mean Feret anisotropy of projections from all possible orientations, 〈A〉, is 0 for a sphere, and at large n approaches 1 for perfectly prolate ellipsoids (those with axial ratios of n:1:1) and 0.28 for perfectly oblate ellipsoids (those with a ratio of n:n:1) (see Fig. 3). 〈A〉 values for the 1523-nt and 975-nt molecules are 0.34 ± 0.01 (σ = 0.14) and 0.32 ± 0.01 (σ = 0.13), indicating that the molecules are comparably anisotropic. Furthermore, their values of 〈A〉 in excess of 0.28 suggest that the molecules are not purely oblate. We confirm that the shape of the molecular ensemble is prolate from scatterplots of M and m versus A (Fig. 2A,B). Individual projections with large anisotropy are seen to have M significantly larger than those with small A values; this trend (i.e., positive slopes of M regressions in Fig. 2A,B) indicates that the shapes of both molecular ensembles are predominantly prolate rather than oblate. (M is constant for pure oblates.) We illustrate this by aligning the projections in Figure 1, E and F, by rotations about their centers of mass such that the directions representing the maximum Feret diameter are vertical; we recover elliptical superimposed shapes of different dimensions (Fig. 4A2,B2) as expected for prolate objects.
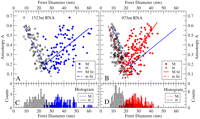
Anisotropy analysis of cryo-EM projections of RNA molecules. (C,D) Histograms of the maximum (M, colored bars) and minimum (m, empty bars) Feret diameters of the hundred traced molecular skeletons of the 975-nt (red) and 1523-nt (blue) ssRNAs shown in Figure 1, E and F. For each molecular skeleton, the measured M (filled circles) and m (empty circles) are plotted against the calculated anisotropy for that projection [A = (M − m)/(M + m)] resulting in the scatterplots in panels A and B. Solid and dashed linear regression trend-lines are shown, respectively, for M and m. (Ten points farthest from the mean of each data set were trimmed before regression analysis.)
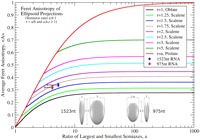
Projected anisotropy of ellipsoidal objects as a function of semi-axis ratios. Calculated average Feret anisotropies 〈A〉 from rotational analyses of ellipsoids with semi-axes ratio a:b:1, where the ratio r = a/b is fixed for each curve. 〈A〉 is plotted against a, the ratio of the longest and shortest semi-axes, equivalent to the experimental maximum value of M/m. Notice that 〈A〉 for oblate ellipsoids asymptotically reaches 0.28, distinctly lower than the experimental values of 0.32 and 0.34 obtained experimentally for the 975-nt and 1523-nt RNAs. The RNAs are therefore predominantly prolate. The red (975 nt) and blue (1523 nt) diamonds are plotted at the maximum value of M/m obtained from their projections. The vertical error bars represent the standard error of 〈A〉 and the horizontal error bar to the left of each point indicates the top 10 percentile range of M/m. The inferred semi-axes ratios for the two molecular ensembles, using r = 1.75, are 5.3:3.0:1 for 1523 nt and 4.2:2.4:1 for 975 nt (see inset at the bottom).
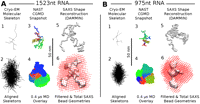
Comparison of structures from cryo-EM, coarse-grained MD, and SAXS, for the 1523-nt (A, left) and 975-nt (B, right) RNA molecules. The top rows in A and B show snapshots of (1) a traced single-molecule cryo-EM projection (TE buffer); (3) a NAST CGMD configuration showing the C3 backbone of the MFE secondary structure of the RNA, with a red–green–blue gradient indicating nucleotide index from 5′ to 3′; and (5) the centroid SAXS bead reconstruction. The bottom rows in A and B show composite images of ensembles of molecules: (2) 100 traced cryo-EM projections (TE buffer) with maximum Feret diameters vertically aligned with centers of mass in registry; (4) 1000 overlaid snapshots from a 0.4-μsec NAST trajectory aligned by minimizing RMSDs between corresponding nucleotides in each pair of snapshots by rotation; and (6) the ensemble volume of 50 overlaid SAXS bead reconstructions (red dots) and the filtered consensus volume (gray surface) (see text; Materials and Methods). The flatness of the molecules is revealed by comparing these composite images with the orthogonal views presented in Supplemental Figure S4.
Furthermore, from the fact that m decreases with anisotropy, we conclude that the prolate volume representing the ensemble of structures must have asymmetry about its long axis, i.e., either different minor axes or bending deformations along the major axis. The corresponding volumes resemble flattened-prolate or bean-like prolate objects (see Supplemental Fig. S3). This explains the tendency for projections with higher anisotropy to arise from progressively shorter m, hence the negative slopes of m regressions in Figure 2, A and B. To quantify the asymmetry of the molecules we have calculated 〈A〉 for a broad range of scalene ellipsoids, i.e., ones with unequal principal axes (see Fig. 3). By comparing calculated plots of 〈A〉 versus maximum (M/m) with the measured values for the 1523-nt and 975-nt molecules, we conclude that the principal ellipsoidal dimensions for these RNAs are in the ratio of 5.3:3:1 and 4.2:2.4:1 (see Fig. 3, insets), respectively. These ellipsoids are predominantly prolate because the difference in magnitude between the largest principal axis and any smaller one is greater than the difference between the smaller ones. This can also be inferred from the scatterplot where the range of M values is larger than that for m.
Our ability to capture projections over a wide range of A for a prolate shape confirms that the orientations of molecules in the samples are not biased by the thickness of the vitrified layer or related surface effects. End-on projections of a prolate object, such as the low-A projections in Figure 3, would not be observed if insufficient thickness of the vitrified layer limited rotational freedom. The Feret diameter method developed above for long RNA molecules lends itself more generally to anisotropy determinations of irregular objects of any size if their projections can be imaged by other techniques.
Small-angle X-ray scattering
The sizes and shapes obtained by cryo-EM are supported by SAXS measurements of ensemble-averaged molecular form factors. RNA SAXS profiles of scattered intensity (I) versus scattering vector (q) and corresponding fits of radii of gyration are presented as Supplemental Figure S5 and Supplemental Table ST1. For linear polymers such as double-stranded DNA, the ellipsoidal dimensions of the average molecular envelope are easily estimated if the cross-sectional diameter is known to be at least 2.5 times smaller than the length (Glatter and Kratky 1982). The ratios of principal axes determined above by cryo-EM (Fig. 3) indicate that this condition is not met, making such analyses inappropriate for this class of large RNAs. We therefore focus on recent Monte-Carlo-based geometric reconstruction methods for computing the molecular volume (Svergun 1999; Walther et al. 2000), which provide better insight into ensemble anisotropy.
The reconstructed SAXS data (see Materials and Methods), presented in Figure 4A5,A6 (1523 nt) and 4B5,B6 (975 nt), show the 3D distributions of scattering density for the RNAs in TE buffer. The configuration of beads shown in Figure 4A5 or 4B5 is one of 50 reconstructions whose calculated I versus q gives a good fit to the measured profile; the beads have a radius (d/2) of 13 Å, determined by the maximum measured scattering vector (qmax = 2π/d). Because all 50 reconstructed geometries are degenerate and equally likely representations of the anisotropy of the ensemble in solution, we compare the shape of the total volume and a filtered consensus volume representing the geometry conserved in most reconstructions (see Materials and Methods). The superposition of all 50 reconstructions is shown as red dots in Figure 4A6,B6. The gray surface in these figures denotes the consensus volume that indicates their shared overall shape. More explicitly, the red volume is constructed by aligning all 50 reconstructions; each red point indicates the presence of beads from one or more reconstruction (i.e., occupancy > 0). The gray volume is constructed by removing points of lowest occupancy from the red volume until half the total remain. Note that a large difference between the red and gray volumes reflects the fact that many degenerate and dissimilar bead geometries can explain the ensemble-averaged scattering. The geometric discrepancy between degenerate reconstructions can be quantified by calculating the average normalized spatial discrepancy (NSD) (Kozin and Svergun 2001) of the reconstructed set with respect to the centroid structure (Fig. 4A5,B5 shows the centroid geometry for the two RNAs). We expect NSD < 1 for a well-determined structure (i.e., with most molecules in the same conformation in solution), and NSD ≥ 1 for poorly determined structures. Both the RNAs above yield NSD ∼ 2 in TE buffer (see Supplemental Table ST1). This implies that the spatial configurations of molecules in solution are not highly conserved, and hence the shapes and sizes of the 975-nt and 1523-nt RNAs are poorly determined in TE. We expect and find a closer congruence of the total and filtered volumes (Fig. 5) and a lower NSD (∼1.4) (see Supplemental Table ST1) in a physiological Mg2+-containing buffer where the RNA is likely to be in a condensed or collapsed state (Ribitsch et al. 1985; Buchmueller et al. 2000; Caliskan et al. 2005). Overall compaction of the molecule is also confirmed by the emergence of a second peak at q < 0.05 Å−1 in the Kratky plot of the SAXS profile (see Supplemental Fig. S5C).
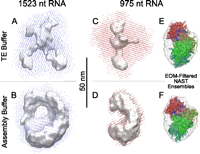
Comparison of total and filtered DAMMIF SAXS reconstructed volumes of 1523-nt and 975-nt RNAs in TE and in vitro assembly buffers. (A,C) (same as Figs. 4A6,B6) The total (dots) and filtered consensus volumes (gray surface) of the two RNAs in 10 mM TE buffer. Notice that in the higher-ionic-strength Mg2+-containing in vitro assembly buffer (B,D), the total volumes are smaller and the consensus volumes occupy a larger fraction of the total volume. This indicates that fewer bead configurations can explain the measured scattering curves, suggesting that the shape diversity in the conformational ensemble of RNA has been reduced in the presence of Mg2+. Each molecule, however, has an overall prolate or bean-like shape in both buffers. (E,F) Aligned RNA configurations (colored tubes) picked using the ensemble optimization method (see Materials and Methods) from 0.4-μsec trajectories of 11 distinct secondary structures for the 975-nt sequence. The volume collectively swept out by these trajectories is shown as a translucent gray surface. Aligned EOM optimized configurations are shown as colored tubes with a red–green–blue gradient in the 5′–3′ direction. Consistent with the DAMMIF results, the EOM optimized ensemble in TE buffer (E) is elongated, while a bent concave shape is seen in the in vitro assembly buffer (F).
Although the molecular ensembles of RNAs are not well determined, we learn about their dominant anisotropy by comparing SAXS consensus volumes with the shapes and sizes determined by cryo-EM. Orthogonal views of the 975-nt and 1523-nt RNA consensus volumes in TE buffer (Fig. 4A6,B6; Supplemental Fig. S4) show that the conserved anisotropy is consistent with a flattened prolate object (Fig. 3, inset). Figure 5 shows that consensus volumes for both RNAs change significantly with the introduction of Mg2+ ions. While the overall prolate character is maintained, the flat shape seen in TE buffer changes to distinctly concave.
While SAXS studies offer a better insight into the anisotropy of an ensemble and how well determined it is, they have several technical limitations for large RNAs. Because we rely on data immediately next to the incident beam to determine the radii of gyration and the maximum extent of the molecule (see Materials and Methods), our ability to estimate these values is particularly sensitive to scattering from the edges of the confining slits as well as the presence of aggregated states of RNA. These cause a slight overestimation of the maximal dimensions as seen by comparing the aligned cryo-EM projections of the 975-nt and 1523-nt RNAs (Fig. 4A2,B2) with the total or filtered reconstructed volumes (Fig. 4A6,B6).
Coarse-grained molecular dynamics simulations
To test whether experimentally measured physical properties can be understood on the basis of an ensemble of equilibrium structures, we use the Vienna package (see Materials and Methods) (Hofacker et al. 1994) to predict an ensemble of 1000 thermally accessible secondary structures for the two RNAs. The nucleic acid simulation tool (NAST) (see Materials and Methods) (Jonikas et al. 2009) is then used to compute coarse-grained molecular dynamics (CGMD) trajectories, allowing the 3D visualization of equilibrium secondary structures.
NAST uses experimentally measured distance metrics between the C3 atoms of each nucleotide to generate realistic 3D configurations using molecular dynamics simulations. Figure 4A3,B3 shows snapshots from 4-μsec NAST trajectories equilibrated at 300 K for the 1523-nt and 975-nt molecules (see Materials and Methods). The snapshots are rendered as a tube passing through all the nucleotide C3 atoms, with the molecule highlighted from its 5′ to 3′ ends by colors running from red through green to blue. Figure 4A4,B4, showing superpositions of 1000 regularly sampled configurations from CGMD trajectories, illustrates the volume explored by the molecules during 0.4 μsec of simulation. The NAST snapshots and volumes shown for both RNAs are for the minimum free energy (MFE) secondary structures. Trajectories for 10 additional secondary structures for the 975-nt sequence yielded shapes and time-averaged radii of gyration consistent with the MFE structure (see Supplemental Table ST1).
The CGMD snapshots were generated entirely by computation, starting from the primary sequence. Comparing Figure 4A1 and 4A3 and similarly 4B1 and 4B3 indicates that the size, shape, and branching of projections of predicted equilibrium structures are very similar to the cryo-EM projections measured in solution. The dimensions of the aligned skeletons in Figure 4A2,B2 are in better agreement with the CGMD volumes than the consensus or total SAXS volumes.
The simulation results, however, are limited by their use of a specific semi-empirical (i.e., knowledge-based) set of potentials. The potentials built into NAST for single-stranded nucleotides are acknowledged to allow larger angular ranges to be sampled at multi-helix junctions than expected in solution (Jonikas et al. 2009). In addition, because long-range electrostatic interactions are neglected, 3D configurations with parts of the molecule close to each other have higher than expected statistical weight. Radii of gyration calculated from these trajectories are accordingly systematically lower than those from SAXS measurements, which overestimate these values as discussed earlier (see Supplemental Table ST1). However, since the maximum dimensions of the trajectory volumes shown in Figure 4A4,B4 are set by the most extended conformations, the shape and size of the corresponding volume are less sensitive to the sampling artifact. It is significant that despite the above limitations, we find the calculated trajectory volumes to be consistently prolate and the magnitude of the principal axis to be consistent with cryo-EM measurements (see Fig. 4A2,A4,B2,B4). Any snapshot during the trajectory is typically flat and prolate (see Supplemental Fig. S4).
One way to work around the limitations of NAST is by selecting only those spatial configurations that are consistent with experimental data. In the current context, this involves selecting a subset of snapshots from a NAST trajectory whose theoretical scattering form-factors are consistent with the measured SAXS curve. A genetic-algorithm-based ensemble optimization method (EOM) has recently been developed for SAXS-based selection of conformations from a large pool of candidate structures (Bernadó et al. 2007). This method is applied to NAST trajectories computed above for the 11 distinct secondary structure of the 975-nt sequence in order to generate the ensembles of experimentally consistent NAST configurations shown in Figure 5. From a pool of more than 11,000 conformations sampled from 11 trajectories, optimized ensembles were separately generated (see Materials and Methods) based on the SAXS profiles of the 975-nt RNA in TE buffer (Fig. 5E) and in vitro assembly buffer (Fig. 5F). The optimized ensemble in each case consists of 60–70 conformations representing a subset of the gray volume. The gray surface represents the total volume containing all the configurations in the initial pool (same for both buffers) (see Materials and Methods). The optimized ensembles for TE and assembly buffers have different overall shapes. Conformations in TE are typically more extended along the vertical direction, while in assembly buffer they are distinctly bent into a concave shape. As in Figure 4, each optimized configuration is color-coded to indicate sequence identity. Consistent with the limitations noted above, the radii of gyration of conformations in both optimized ensembles are systematically higher than the average value for the entire trajectory.
Computational constraints limit the number of trajectories of alternate secondary structures that can be generated for the longer RNAs, thereby reducing the conformational diversity of the initial pool of NAST conformations used for SAXS-based ensemble optimization to the MFE trajectory. Despite these limitations, useful information about the location of different parts of the backbone (5′ and 3′ ends, etc.) can be obtained, particularly for in vitro assembly buffer, where lower conformational diversity is expected. For the 1523-nt RNA, the MFE NAST trajectory was sampled regularly to generate 10,000 configurations as the initial pool and processed as above. An ensemble optimized for in vitro assembly buffer is shown in Supplemental Figure S8 to demonstrate the ability to ascribe chemical identity to different parts of corresponding SAXS consensus volumes.
Sequence and length dependence
To test for differences in anisotropy between coding and noncoding sequences, we compare the 975-nt and 1523-nt sequences above with the 2777-nt viral genomic RNA2 of CCMV. As before, cryo-EM, SAXS, and CGMD are used to study the shape and size of the RNA in solution. Because of the large size of the RNA at low ionic strength, reliable low-q SAXS data could not be obtained in TE buffer. (Mg2+-induced compaction does allow reliable SAXS curves to be obtained in in vitro assembly buffer.) Comparisons between the states of the RNA in TE and in vitro assembly buffer are therefore done by cryo-EM instead of using SAXS. Figure 6 and Supplemental Figure S6 show molecular projections of CCMV RNA2 in TE (panel A) and in vitro assembly buffer (panel B). The branches seen in TE are distinctly longer and more rigid. Accordingly, the overall projected area per molecule is smaller under assembly conditions.
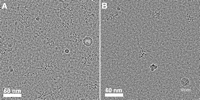
Cryo-EM projections of 2777-nt CCMV RNA2 in TE and in vitro assembly buffers. (A) Projections of randomly oriented RNA molecules in TE buffer, with a 30-nm spherical polystyrene (PS) bead used as internal size reference. (B) Four molecules of the same RNA in assembly buffer (see Materials and Methods) with a wild-type CCMV virus particle (28-nm outer diameter) added as an internal size marker. The central RNA molecule in panel B is shown in Figure 7 after rotation. Notice that in TE buffer the branching within each projected molecule is discernible and the individual arms appear to be longer and straighter (implying a longer persistence length). The molecules occupy smaller projected areas in the Mg2+-containing buffer consistent with their compaction and a reduction in the diversity of conformations. Traced skeletons for both panels are available as Supplemental Figure S6.
A comparison of the circular cryo-EM projection of a virus particle (Fig. 7A) and a CCMV RNA2 molecule in in vitro assembly buffer (Fig. 7B) shows that the size of the viral genome is comparable to that of the particle into which it assembles, but its dimensions are slightly larger and its shape elongated. A similar size and shape can also be predicted directly from the primary sequence of CCMV RNA2. This is clear when the traced molecular skeleton (Fig. 7C) is compared with a NAST CGMD projection (Fig. 7D) of a predicted secondary structure. The convergence between experiment and simulation also extends to ensembles of structures. The overall shape and size of 2000 superimposed CGMD snapshots from a 0.8-μsec trajectory (Fig. 7E) compare well with the consensus volume (Fig. 7F, gray surface) reconstructed from the measured SAXS profile.
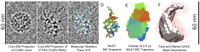
Comparison of cryo-EM, coarse-grained MD, and SAXS structures of 2777-nt CCMV RNA2 in physiological buffer with a wild-type virus particle. (Left) cryo-EM projections of a single wild-type CCMV virion (A) and one molecule of 2777-nt CCMV RNA2 (B) from a solution of RNA in an in vitro assembly buffer to which a trace amount of virions was added as a size marker. The parent image with projections of several RNA molecules is Figure 6B. Notice that the RNA molecule is comparable in size to the virion, but elongated and slightly larger in dimension. (C) A traced molecular skeleton (cyan) overlaid on the cryo-EM projection in panel B. (D) A NAST snapshot of the predicted minimum-free-energy secondary structure calculated from the primary sequence of CCMV RNA2. The RNA backbone is colored using a red–green–blue gradient from 5′ to 3′. Notice the striking similarities in shape and size between the molecular skeleton and the CGMD snapshot. (E) Two thousand snapshots from a 0.8-μsec MD trajectory are overlaid to illustrate the mobility of different parts of the molecule and the diversity of conformations in the MD ensemble. (F) The total volume (red dots) obtained by superimposing 50 SAXS bead reconstructions. The gray surface denotes a filtered consensus volume conserved in most bead reconstructions (see Materials and Methods), representing the most likely volume of the ensemble of molecules in solution. Notice the similarity in shape and size of the gray surface and the MD ensemble in panel E. Orthogonal views of the CGMD and SAXS structures and their shadow projections are compared with that of a model scalene ellipsoid in Supplemental Figure S7.
Notably, all of the results for CCMV RNA2 reinforce the conclusion that in solution these RNA molecules occupy flattened-prolate (or bean-like) volumes with significantly different projections in orthogonal directions. A comparison of shadow projections of the SAXS consensus volume, a CGMD snapshot, and a model ellipsoid are shown in Supplemental Figure S7. A distinct concavity in the planar shape of the molecules is apparent from all three techniques. A SAXS-optimized (EOM) ensemble of NAST configurations is generated for CCMV RNA2 as done for the 1523-nt RNA above and shown in Supplemental Figure S8. The striking similarity of the optimized configurations in Supplemental Figure S8 and the SAXS consensus volume in Figure 7F confirm the utility of both techniques. It enables us to identify parts of the RNA backbone (Supplemental Fig. S8) that are likely to constitute different locations of the consensus volume—for example, the tapered end (Fig. 7F, top) likely consists of local secondary structure midway in the molecule (the green color indicates nt location, around 1400) and the bulky base of the volume is composed of red, blue, and teal regions of the backbone representing a relatively short 5′ region and a longer 3′ section of the molecule.
DISCUSSION
We emphasized earlier that any long RNA sequence gives rise to an ensemble of secondary/tertiary structures and raised the question whether one can still associate a distinct size and shape with a given sequence, i.e., whether the differences between the conformational ensembles of different RNA sequences are sufficiently large that one can correlate the size and shape of long RNA molecules with their sequences. Figures 1–4 demonstrate that although the 975-nt and 1523-nt sequences share a common flattened prolate geometry, we can distinguish between their sizes. This confirms the feasibility of predicting and measuring the coarse-grained structures of long RNA molecules in solution.
The methods we use have their individual limitations, but they are complementary, allowing systematic structure elucidation when used together. We illustrated this in Figure 5 by comparing the shapes and sizes of the 975-nt and 1523-nt RNAs in TE buffer with those in a buffer with physiological ionic strength and Mg2+ concentration (see Materials and Methods). While cryo-EM Feret anisotropy measurements are accurate for determining size and ellipsoidal eccentricity, they cannot distinguish between convex and concave shapes (see Supplemental Fig. S3). In contrast, SAXS reconstructions, which are unable to accurately determine the maximum extents of large molecules (see Fig. 4) due to the technical limitations mentioned earlier, are able to discern small changes in the shape of the molecular ensemble. Comparison of the total and consensus SAXS volumes for the 975-nt and 1523-nt molecules (Fig. 5) shows that the diversity of conformations in the ensemble is reduced in the presence of Mg2+ and higher ionic strength. Despite a change in size and a better-determined conformation, the overall prolate shape of the molecules is maintained.
It is significant that the measured anisotropy of an ensemble is qualitatively recovered from molecular dynamics simulations of a single predicted secondary structure rendered in 3D space using knowledge-based potentials. Comparing individual molecular projections from cryo-EM and NAST (Fig. 4A1,3;B1,3) shows a striking consistency between the two techniques. The NAST projections recover the maximum dimensions and general branching properties of the cryo-EM projection accurately, suggesting that predicted equilibrium secondary structures and their coarse-grained NAST structures are relevant to understanding real molecules in solution despite the likelihood of cotranscriptional folding during RNA synthesis (Pan and Sosnick 2006; Geis et al. 2008). NAST, by design, ignores electrostatic interactions within the molecule and is acknowledged to sample a larger-than-expected conformational space for the input secondary structure (Jonikas et al. 2009). Our ability to discern prolate and flattened ensembles created by superposition of NAST MD trajectories of single secondary structures further indicates that this anisotropy does not depend strongly on electrostatics and solvent conditions. It must, instead, be a generic property of large RNA molecules arising from secondary structure. Consistent with this picture, our data show that large RNAs are prolate in both physiological and low-ionic-strength buffers.
To understand the physical origin of prolate anisotropy, we study the branching asymmetry of secondary structures of large ssRNAs. For each thermally accessible secondary structure, there are at most a few paths along the branched molecule that are significantly longer than the average distance between nucleotides. Although such paths are statistically small in number, they determine the asymmetry of the secondary structures and therefore the generic prolateness of the molecules in 3D. (Supplemental Table ST2 shows such rare long paths for predicted secondary structures of the three RNAs studied.) In a recent study, such maximal paths were calculated for thermally accessible secondary structures of random as well as natural sequences, and it was found that their low statistical weight is a general property of all RNA sequences (Yoffe et al. 2008).
The generic anisotropy is elucidated by calculating the probability of branching along these long paths. Using the RNA-As-Graphs
program (Gan et al. 2003; Fera et al. 2004; Izzo et al. 2011), we analyze the numbers of double-stranded helices at each junction (i.e., vertex orders in a tree-graph) for 1000 Boltzmann-sampled
secondary structures per RNA. The ensemble-averaged numbers for each junction type and therefore their relative probabilities
are shown in Supplemental Table ST2. We find in general that 2-helix junctions are more likely than 1-helix (i.e., stem–loop),
3-helix, or higher-order junctions. Of particular interest is that the number of 2-helix junctions is typically twice the
number of 3-helix junctions (higher-order junctions are rare). It follows that only a small fraction  of junctions along any long path is likely to distribute mass away from the path. The maximal path in a secondary structure
therefore determines the direction of highest anisotropy and implicitly the dominant principal axis of molecules in solution.
Almost all 1000 secondary structures computed per RNA show the same behavior (see Supplemental Fig. S9).
of junctions along any long path is likely to distribute mass away from the path. The maximal path in a secondary structure
therefore determines the direction of highest anisotropy and implicitly the dominant principal axis of molecules in solution.
Almost all 1000 secondary structures computed per RNA show the same behavior (see Supplemental Fig. S9).
Deviations from an overall prolate shape require a significant fraction of the mass of the molecule to be placed on a single branch (i.e., 3-helix or higher-order junction) that is centrally located. Such configurations, although extremely rare (<1%), are indeed sampled by the computed secondary structure ensembles. This tendency of all secondary structures to have a dominant path defining the molecular shape and maximum extent is the reason we are able to recover a common anisotropy from ensemble measurements as well as single-molecule projection analyses. As discussed below, a review of the literature on known solution and crystal structures of RNAs reveals that prolateness is a recurrent theme.
The generic flatness of molecular envelopes can be understood in terms of the relative numbers of junctions of various orders, the preferred geometry at each type of junction, and the relative spatial orientations of junctions within 3D branched structures. As mentioned above, Supplemental Table ST2 shows the numbers of junctions of various orders for predicted secondary structures of the three molecules studied. For each RNA, 2- and 3-helix junctions along with 1-helix stem–loops collectively make up >95% of the total. The geometries and relative orientations of these predominant structural motifs are analyzed next to understand how they influence the anisotropy of the molecule.
In a 10 mM buffer with monovalent salts, the Debye screening length (λD), i.e., the distance over which two parts of the charged RNA backbone repel each other electrostatically, is ∼5 nm. Under these conditions, helices joined at a two-way junction would be driven away from each other and therefore collinear. In the same vein, the thermodynamically stable configuration when three similarly charged helices (rods) are attached at a flexible junction (hinge) is when these are farthest apart and equidistant from each other. This reflects a coplanar geometry with the helices at 120° angles (much like an sp2 hybrid orbital). Y-shaped coplanar three-way junctions in unfolded RNA at low ionic strength have been reported experimentally (Kim et al. 2002) and predicted theoretically (Mohanty et al. 2005). Similarly, we expect a 4-helix junction to be tetrahedral and so on, with electrostatics determining local geometry at low ionic strength.
When electrostatic repulsions are screened, we expect coaxial stacking interactions to become important determinants of local geometry. Short-range stacking interactions between paired and unpaired bases are known to cause the coaxial organization of adjacent helices at junctions (Lilley 2000; Kim et al. 2002; Lescoute and Westhof 2006; Holbrook 2008). Helices at a 2-way junction can therefore remain collinear even though no significant electrostatic repulsions exist between them. Moreover, at a 3-helix junction, the collinearity of two helices due to coaxial stacking implicitly means that a plane is formed with the third (Kim et al. 2002; Mikulecky et al. 2004; Mohanty et al. 2005; Ouellet et al. 2010). Some 4-helix junctions have also been shown to have relatively planar structures (Lilley 1998, 2000). Coaxial helix stacking therefore provides an additional short-range 3D geometric constraint to maintain the collinearity of 2-helix junctions and coplanarity of 3-helix junctions in the absence of long-range electrostatic repulsions. The statistically dominant structural motifs in most RNAs, i.e., 2-helix and 3-helix junctions, can therefore retain their basic geometric properties under most solvent conditions as long as coaxial stacking is possible. Unlike the electrostatic argument above, which holds for all 2-helix and 3-helix junctions independent of their nucleotide sequence, the presence of coaxial stacking in a screened environment depends on the number and identity of unpaired bases at the junction. Sensitivity to nucleotide composition increases the likelihood of departures from collinear and coplanar geometries at 2-helix and 3-helix junctions, making coaxial stacking a varying geometric constraint within each molecule.
Having established the geometries of the most likely junctions, we explore whether two adjacent three-way junctions can be coplanar. Even at low ionic strength (TE buffer), the Debye screening length is of the order of the distance between the centers of neighboring helices at a three-way junction. Therefore, we do not expect electrostatic interactions to play a role in the relative orientations of adjacent 3-helix junctions. The degree of rotation of the plane of the first junction with respect to the second is therefore determined by the length and single- or double-strandedness of the connection between them. In other words, when they are connected by double-stranded regions, the relative rotation of the two planes is determined by the number of paired bases. In earlier work, we showed that the number of base pairs in a helix is narrowly distributed and peaks around 5 (Yoffe et al. 2008). The most likely connection between adjacent three-way junctions is therefore a 5-bp helix, which represents a 180° turn that leaves the junctions coplanar. If there are two to three helices between the junctions, we still expect some correlation in the direction of their planes. As the size of the linker between them increases, the likelihood of coplanarity decreases, resulting in a loss of correlation for junctions separated by several helices. As alluded to above, long paths with several tens of helices are rare in the molecules studied and account for only ∼20% of the mass. The majority of the mass of each molecule lies in shorter branches (coming off the maximal path) that are more likely to sustain local flatness. Branching properties and the preferred local geometry thus explain the prolate anisotropy of large RNAs.
As noted above, increasing the ionic strength and adding polyvalent cations such as Mg2+ reduce the electrostatic driving force for flatness while providing an alternative weaker constraint. Despite the reduced propensity for flatness in assembly buffer, the RNAs studied collapse into concave structures (resembling a slightly cupped hand) that are still relatively flat rather than globular and compact. Their SAXS consensus volumes (Figs. 5, 7) clearly indicate that some degree of flatness in the shape of the ensemble persists in a screened environment with λD ≤ 1 nm. The concave shapes observed for large RNAs can therefore be understood as outcomes of a subtle competition between (1) electrostatic repulsion and coaxial stacking, which promote the flatness of branched RNA structures; and (2) nonspecific charge screening, counter-ion condensation (Chu et al. 2008), and specific Mg2+-mediated (salt-bridge) contacts, which promote departures from collinear or coplanar geometry.
We suggested above (and showed for RNAs of length 1000–3000 nt) that a flattened prolate envelope is common to ensembles of coding and noncoding large RNAs. Previous solution SAXS studies of the 3569-nt MS2 RNA (Zipper and Folkhard 1975; Ribitsch et al. 1985) estimated its ellipsoidal dimensions to be 632:306:140 Å, consistent with a flattened prolate shape (i.e., principal axes 4.5:2.2:1 as compared with 5.3:3:1 and 4.2:2.4:1, respectively, for the 1523-nt and 975-nt RNAs). The SAXS profile for this RNA has been reanalyzed recently using multiple reconstruction methods (Zipper and Durschlag 2007) and consistently yields flattened prolate shapes that are often concave as seen for the three RNAs above. Similar SAXS evidence of elongated flat structures is available for the 1542-nt 16S ribosomal RNA (Folkhard et al. 1975), the ∼400-nt RNase P RNAs (Kazantsev et al. 2011), and the 199-nt cis VS ribozyme (Lipfert et al. 2008). In addition, a recent analysis of the asphericity of high-resolution NMR and X-ray structures in the PDB database reveals that most RNAs (typically smaller than 1000 nt) have a prolate shape (Hyeon et al. 2006). Combining these studies with our results yields a large body of experimental evidence for a flat and prolate geometry under very different buffer conditions for various unrelated coding and noncoding RNAs ranging from 199 to 3569 nt. The generality of prolate anisotropy confirms its fundamental origin in the asymmetry of secondary structure branching common to all RNAs.
It is noteworthy that linear polymers such as double-stranded DNA have prolate envelopes (Haber et al. 2000) whose ellipsoidal dimensions are determined by the inherent anisotropy of individual 3D random walks (Rudnick and Gaspari 1987). The relative ellipsoidal dimensions of a random-walk polymer (Rudnick and Gaspari 1987) are quite similar to those observed here for the branched 975-nt and 1523-nt RNAs by cryo-EM. As mentioned above, most large RNA molecules tend to have one (or a few) long paths compared with the remaining paths in the branched pattern. While this maximal path sets the magnitude of the principal axis of the prolate ellipsoid, it typically accounts for only 20% of the mass of the molecule. In the past, we have treated the maximal path within a secondary structure as the contour length of a linear polymer to predict physical properties such as the radius of gyration (Yoffe et al. 2008). This approximation, while a useful measure for comparing ensembles of different sequences, does not accurately predict the physical dimensions of the RNA envelope. It neglects the large excluded volume due to branches and other effects such as coaxial stacking, which may collectively increase the effective persistence length of the maximal path to nearly the physical dimensions of the molecule.
That steric effects are significant is clearly seen in the superposed NAST trajectories in Figures 4A4,B4 and 7E, where the locations of regions representing the maximum extent of the molecule (indicated by backbone colors) do not change significantly with respect to each other. For example, the NAST snapshot in Figure 7D shows that the 5′ (red) and 3′ (blue) ends of the 2777-nt viral RNA are located in close physical proximity at the bottom and most distant from the top of the molecule (green, i.e., nucleotide ∼1400). Over the entire trajectory, these regions of the molecule remain distant from each other, leading to the prolate shape of the overlaid trajectory in Figure 7E. The consistency of these NAST configurations with the SAXS consensus volume in Figure 7F allows us to predict that tertiary interactions between these two regions within the molecule are less likely than with other regions (colors) adjacent to each other. This steric separation is even stronger if one considers the SAXS-optimized ensemble in Supplemental Figure S8. The EOM-generated ensemble shows that the extent of the molecule, set by the maximum path along the secondary structure, does not exhibit large spatial fluctuations. The cross-section of the molecule, however, depends strongly on the details of local branching and ultimately defines the shape asymmetry of the molecule. In other words the details of how the remaining 80% of the mass of the molecule is organized about the longest path in a branched pattern are the key determinant of the anisotropy of large RNA molecules, rather than the intrinsic anisotropy of a random walk.
It is widely appreciated that the topology of local secondary structure motifs can significantly limit the types of spatial configurations possible at helical junctions (Lilley 1998; Batey et al. 1999; Tinoco and Bustamante 1999; Lescoute and Westhof 2006; Bailor et al. 2010). These geometric constraints often determine the shape and size of small RNA molecules. Similarly, but on a much larger scale, we have shown here that the flattened prolate shape of a large RNA is an outcome of the geometric constraints imposed by how such motifs are arranged with respect to each other in an extended secondary structure. The coarse-grained shape anisotropy established above is expected to be a strong predictor of the parts of a molecule likely to be in close spatial proximity and therefore of the likelihood of tertiary interactions and biological function in long RNAs.
In proteins, particularly globular ones, a folded state implies that certain hydrophobic domains remain inaccessible from the exterior of the protein to solvent and other cellular agents. In contrast, each RNA molecule represented by the concave SAXS consensus volume in Figure 5 occupies only a small fraction of that volume. (See individual NAST configurations in Figs. 4, 7; Supplemental Figs. S4, S7.) In other words, although the configurational freedom of RNA is reduced in physiological buffer, individual molecules are not as dense or compact as globular proteins in the space-filling sense. Most parts of the branched structure are expected to remain accessible to other molecules in solution. For example, it follows that positively charged proteins are likely to bind over the entire molecule due to Coulomb interactions. Thus, flatness and prolateness in solution increase the surface-to-volume ratio of the molecule and implicitly the availability of the entire nucleotide sequence for interaction and recognition events. This is consistent with the tendency of large protein-bound RNAs to have relatively flat structures—for instance, the pancake-shaped 16S ribosomal RNA (Wimberly et al. 2000; Holbrook 2008) and the genomes within spherical viruses, which are found lining the inside of the capsid as a concentric shell (Jacrot et al. 1977; Schneemann 2006; Toropova et al. 2008). Particularly noteworthy examples are (∼400 nt) RNase P RNAs from phylogenetically distinct bacterial species that are known to have flat shapes in solution (Kazantsev et al. 2011). Significant conformational changes have been proposed to occur in these upon binding with a small (14 kDa) protein, and the concave solution structure found in a subclass of these RNAs enhances substrate recognition capability.
Our results and the examples above suggest that the 3D conformations of an RNA, as defined by its branching properties, can also contribute to the energetics of its interaction with proteins. While electrostatic and hydrogen-bonding interactions often compensate for the loss in conformational entropy, RNAs with different branching configurations arising from different sequences may provide varying thermodynamic and kinetic barriers to such interaction. This is particularly relevant to the self-assembly of viral RNAs with capsid proteins to form virus particles. We have shown in Figures 6 and 7 that the 2777-nt viral genomic RNA molecule has maximum dimensions (∼60 nm) slightly larger than the outer diameter of the capsid (28 nm) in which it is spontaneously packaged. In comparison, the maximum dimensions of the 975-nt and 1523-nt nonviral sequences (∼45 nm and 60 nm, respectively) are not significantly smaller. For 1523-nt and 2777-nt RNAs to have similar maximum dimensions, they must necessarily have very different patterns of branching in their secondary structure (see Figs. 4, 6, 7; Supplemental Table ST2). Such differences could account for the relative propensities of viral and cellular RNAs for being encapsulated by capsid protein (Adolph and Butler 1977; Sorger et al. 1986; Rulli et al. 2007; Schroeder et al. 2011) and provide structural insights into the enhanced efficiency of assembly due to specific functional motifs within viral RNAs (Bink and Pleij 2002; Rao 2006). Compactness and asymmetry in the branching of secondary structures thus represent an additional degree of freedom for large RNA sequences such as viral genomes as they evolve under the selective pressures of size and shape.
In summary, we have shown using direct cryo-EM visualization, solution SAXS experiments, and coarse-grained MD simulations that molecular ensembles of large RNAs in solution are anisotropic. Their flattened prolate shapes emerge from the branching asymmetry and basic geometric properties of multi-helix junctions in their secondary structures. Large-scale differences in anisotropy can be encoded in the primary nucleotide sequence in the form of a preferred branching pattern within a statistical ensemble. This constitutes an important genetic degree of freedom in defining the biological function of large RNAs.
MATERIALS AND METHODS
RNA synthesis and purification
The RNA molecules were transcribed from PCR templates using T7-polymerase (courtesy of Prof. Feng Guo, UCLA), followed by DNase digestion of the template. Protein impurities were removed by phenol:chloroform extraction. Polynucleotides and unreacted ribonucleotides were removed by repetitive additions of 10 mM Tris + 1 mM EDTA (TE) buffer at pH 7.4 and filtration through a 100-kDa MWCO Centricon device. The above treatment yields high-purity RNA samples that can be used directly for cryo-EM studies. For SAXS samples, to eliminate trace protein or DNA-template scatterers, an additional purification of RNA by ethanol precipitation (25°C) was conducted. The precipitate was pelleted and resuspended in TE buffer. All RNA samples were stored in TE at 4°C, dialyzed into the required buffer for 24 h, and used within 48 h. The integrity of each RNA sample was tested by gel electrophoresis in a 1% native agarose gel run in TAE buffer (pH 7.8) at every stage (i.e., post-transcription, post-dialysis, and immediately before use). The 5′ ends of both the 975-nt and 1523-nt RNAs correspond to the 874,269-th base of chromosome XII of S. cerevisiae (Cherry et al. 1997).
Cryo-EM sample preparation
The cryo-EM micrographs were acquired at the California Nano-Systems Institute Electron Imaging Center for NanoMachines, using an FEI Tecnai G2 TF20 machine at an accelerating voltage of 200 kV. RNA samples, purified as above, were diluted to 1 mg/mL and equilibrated for 24 h in either TE buffer or RNA in vitro assembly buffer (50 mM Tris-HCl at pH 7.4, 50 mM NaCl, 10 mM KCl, 5 mM MgCl2) at 4°C prior to vitrification. Glow-discharged Quantifoil holey carbon grids (R2/1 200M) were used for vitrifying the RNA solution using a Vitrobot (Mark IV, FEI). The grids were imaged using a Gatan cryo-holder, at 80,000× magnification with a total exposure of 30 e/Å2. We optimized image contrast by looking for thin samples of vitrified solution that are freely suspended over micrometer-sized holes. The appropriate thickness – thin enough to minimize background scattering from water and thick enough for RNAs to be unaffected by proximity to the surface is ∼100 nm. The images in Figure 1, A and C, were acquired at 3 μm underfocus and subsequently run through a Fourier band-pass filter (1–10 nm) to highlight the branches within each molecule.
Cryo-EM image analysis
Skeletons were traced for each molecule using the NeuronJ plugin (Meijering et al. 2004) within ImageJ (Rasband 1997–2009). Each branched arm in a molecule is traced individually by connecting its start and end points with a curve of 1 pixel width drawn along the most intense path between the points. Overlapping branches lead to each contiguous molecular skeleton. Subsequent Feret analyses and alignments were done using custom ImageJ macros.
Small-angle X-ray scattering
SAXS measurements were conducted at the Bio-SAXS beamline 4-2 at SSRL (Menlo Park, CA). The RNA concentration optimal for minimizing intermolecular interactions while obtaining reliable scattering signal was determined to be between 0.5 and 1 mg/mL RNA, comparable to the concentrations that proved optimal for the cryo-EM imaging. Twenty-five microliters of RNA solution (equilibrated in relevant buffer as above) was continuously cycled in an in-vacuum capillary cell to minimize beam damage. I versus q scattering curves were generated by radial averaging of 20 exposures of 30 sec each. The q < 0.2 Å−1 data were collected with the CCD detector at a distance of 5 m to maximize sampling intervals at low q, and merged with high-q data taken at 1 m in order to improve signal quality at q > 0.2 Å−1. Scattering profiles were processed using various components of the ATSAS 2.3 software suite (Konarev et al. 2006) as follows: PRIMUS and GNOM were used to generate the distance distribution function, P(r), which, in turn, was fed into DAMMIN (run parameters: keep mode, P1 symmetry, unknown shape) to generate an ensemble of bead-model reconstructions satisfying the experimental scattering curve. For each RNA, 50 such bead models using different initial random seeds were computed, aligned, and averaged (DAMAVER/SUPCOMB), and the consensus molecular volume was obtained by removal of the beads least likely to be in more than one reconstructed structure (DAMAVER). Fifty percent of the total beads arising from the superposition of all 50 structures were removed to generate the final filtered consensus shape. The consensus structure was rendered as a molecular surface by convolution with a Gaussian kernel using the pdb2vol tool in Situs (Wriggers and Chacon 2001) and rendered using VMD (Humphrey et al. 1996). After DAMMIF (Franke and Svergun 2009), a faster alternative to DAMMIN with adaptive search volume, became available, it was used instead of DAMMIN to repeat the above process (run parameters: slow mode, P1 symmetry, and unknown anisometry). The consensus shapes obtained using the two reconstruction algorithms were effectively identical; the data shown are from DAMMIF runs.
In order to obtain reliable P(r) curves using GNOM, it is recommended (Svergun 1992) that the product of the real-space maximum molecular dimension Dmax ascribed to the molecule (see Supplemental Table ST1) and the minimum measured scattering vector qmin not be larger than π. Setting the Dmax temporarily to the cryo-EM maximum Feret diameter (e.g., ∼450 Å for the 975-nt RNA), confirms that the qmin required to reliably determine P(r) is 0.007 Å−1. While this value lies within the range measured, it corresponds to the fifth data point from the beam stop. It invariably is also part of the Guinier region used for computing radii of gyration (because Dmax is coincidentally ∼πRg for these RNAs, the qRg ∼ 1 region is expected at qmin). The practical limitation of the Guinier region being coincident with the qmin required for reliable Dmax assignment makes both Guinier analysis and real-space Dmax determination very sensitive to parasitic scattering from the beam-confining slits and any aggregates formed spontaneously or due to beam damage.
A significant contribution from correlated counterions (Das et al. 2003) in in vitro assembly buffer adds to the apparent molecular mass of large RNAs, thereby increasing I0, the extrapolated scattered intensity at q = 0 (see low-q data trends in Supplemental Fig. S5). To compare the compactness of RNAs in the two buffers, instead of the preferred dimensionless
Kratky plots  (Glatter and Kratky 1982; Durand et al. 2010; Rambo and Tainer 2011), which are sensitive to inconsistencies in I0, we have shown conventional Iq2 versus q Kratky plots in Supplemental Figure S5C.
Coarse-grained molecular dynamics
NAST computations were performed on the Hoffman2 and Faraday clusters at UCLA. MFE secondary structures predicted from the primary sequence using the Vienna package were used as input. The MD simulations were first run for 108 steps (0.4 μsec) to equilibrate the structure at 500 K. The molecule was then equilibrated to 300 K, and 109 step (4 μsec) trajectories were computed to visualize the conformational fluctuations in each molecule. Trajectories were calculated for 10 more secondary structures out of the 1000 computed within 1 kcal/mol of the MFE structure using the RNAsubopt tool in Vienna (as described in Yoffe et al. 2008). These structures (not presented) yield overall shapes, sizes, and time-averaged radii of gyration statistically indistinguishable from that of the MFE structure (see Supplemental Table ST1). Due to computational limitations, the ensemble calculations were limited to the shortest RNA studied. The MD snapshots and trajectory overlays are rendered with the 5′ to 3′ nucleotide index represented with a red–green–blue gradient using VMD.
SAXS-optimized CGMD ensembles
The EOM package (Bernadó et al. 2007) was used to select NAST molecular configurations most consistent with the SAXS curves measured above. For the 975-nt sequence, trajectories for 11 distinct secondary structures (MFE + 10 additional) were sampled at regular intervals to generate 1000 configurations each as PDB structure files. These constituted a large pool of 11,000 input configurations from which optimized subensembles were generated. From the PDB coordinates of sampled configurations, theoretical scattering curves were first generated using CRYSOL (Svergun et al. 1995) and subsequently analyzed as an “own pool” using GAJOE (Bernadó et al. 2007). The genetic algorithm was run for 5000 generations to compute 100 possible ensembles, each containing up to 100 configurations with variable weight (i.e., repetition of configurations were allowed within an ensemble). GAJOE computations (100 cycles) involved up to 50 mutations per ensemble and 100 crossings per generation. Of the 100 ensembles computed, the one that best fit experimental data contained between 60 and 70 configurations selected from the pool. These are aligned to minimize root-mean-square deviations (RMSD) and shown in Figure 5 as colored backbones within the volume of the entire pool of configurations used (gray dots). The pool of 11,000 NAST configurations of the 975-nt RNA was optimized separately for experimental SAXS curves obtained in TE and in vitro assembly buffers as shown in Figure 5. For the 1523-nt and 2777-nt RNAs, the MFE NAST trajectory was sampled regularly to generate 10,000 configurations as the initial pool and processed as above. Ensembles optimized for in vitro assembly buffer are shown in Supplemental Figure S8.
Feret anisotropy calculation for model ellipsoids
(Note that the symbols for Feret Anisotropy and Average Feret Anisotropy in the main text of the paper are A and 〈A〉; we instead use Af and 〈Af〉 here to avoid conflicts with other conventional symbols.) The general equation of an ellipsoid of semi-principal axes a, b, and c is of the form
The projection of an arbitrarily oriented ellipsoid onto a plane leads to an ellipse described by the standard equation:
Knowledge of the dimensions of the ellipsoid (i.e., a, b, and c in Eq. 1) and its orientation (described by angles of rotation θ and φ of the ellipsoid along its principal axis and an axis orthogonal
to the direction of projection, respectively) allows us to calculate the coefficients in Equation 2 (data not shown) (see Kayikcioglu et al. 2000). To determine the Feret Anisotropy Af of the projected ellipse, we first measure its principal axes. For this, the standard form of the ellipse (Eq. 2) is first converted to the general form (analogous to Eq. 1) using a rotational transform about angle δ, where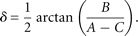 Solving for the principal axes of the rotated ellipse yields the maximum and minimum Feret diameters of the projection. The
Feret anisotropy can ultimately be written in terms of the coefficients of Equation 2 as follows:
Solving for the principal axes of the rotated ellipse yields the maximum and minimum Feret diameters of the projection. The
Feret anisotropy can ultimately be written in terms of the coefficients of Equation 2 as follows:
Averaging the Feret anisotropy of elliptical projections arising from all possible orientations of the parent ellipsoid (i.e., values of θ from 0 to 2π and ϕ from −π/2 to π/2 in steps of π/180) yields 〈Af〉. Reference 〈Af〉 curves (Fig. 3) are calculated for ellipsoids of constant a/b ratio (r = a/b), with the longest principal axis a ranging from 1 to 1000 times the length of the shortest principal axis c, which is held constant at 1. Numerical calculations were implemented in MATLAB for a, b, r ≥ 1.
SUPPLEMENTAL MATERIAL
Supplemental material is available for this article.
ACKNOWLEDGMENTS
The measurements and analyses reported would not have been possible without extensive discussions with and timely support from the following people: Dr. Magdalena Jonikas (adapting NAST to RNAs longer than 500 nt), Dr. Marc Niebuhr (SSRL SAXS beamline), Dr. Ivo Atanasov (EM instrumentation), Dr. Max Kopelevich (cluster computing), Prof. Feng Guo (discussions and T7 polymerase enzyme), Prof. Tamar Schlick and Shereef Elmetwaly (providing RNA-As-Graphs program for long RNAs), Prof. A.L.N. Rao (discussions and viral RNA plasmid), Dr. Defne Egecioglu (yeast genomic DNA and primer design), and Dr. Jelena Pesic (MATLAB code debugging). We acknowledge the use of instruments at the UCLA Electron Imaging Center for NanoMachines supported by NIH (1S10RR23057). Portions of this research were carried out at the Stanford Synchrotron Radiation Laboratory, a national user facility operated by Stanford University on behalf of the US Department of Energy, Office of Basic Energy Sciences. The SSRL Structural Molecular Biology Program is supported by the Department of Energy, Office of Biological and Environmental Research, and by the National Institutes of Health, National Center for Research Resources, Biomedical Technology Program. This research was supported by the US National Science Foundation (Grant CHE 0714411 to W.M.G. and C.M.K.) and National Institutes of Health (Grant R01GM071940 to Z.H.Z.).
Footnotes
-
↵4 Corresponding author.
E-mail agopal{at}chem.ucla.edu.
-
Article published online ahead of print. Article and publication date are at http://www.rnajournal.org/cgi/doi/10.1261/rna.027557.111.
- Received April 5, 2011.
- Accepted November 12, 2011.
- Copyright © 2012 RNA Society




