


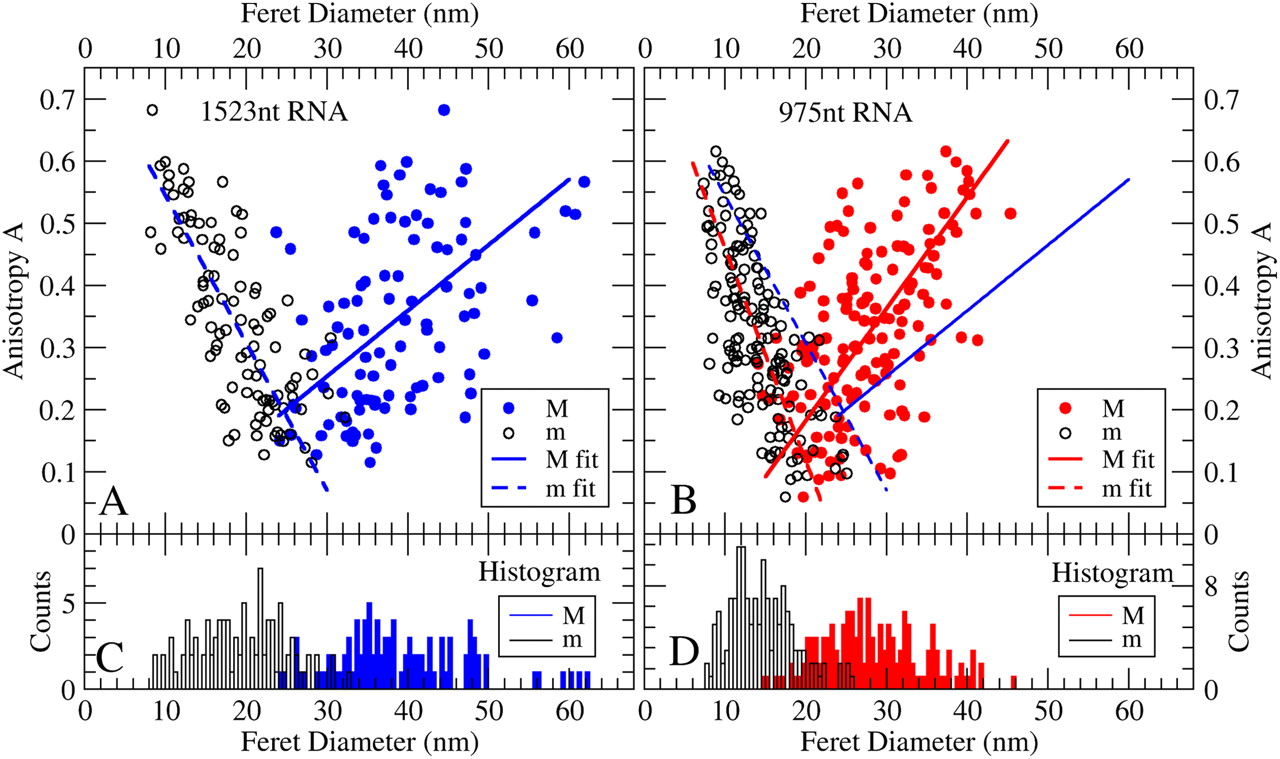
Anisotropy analysis of cryo-EM projections of RNA molecules. (C,D) Histograms of the maximum (M, colored bars) and minimum (m, empty bars) Feret diameters of the hundred traced molecular skeletons of the 975-nt (red) and 1523-nt (blue) ssRNAs shown in Figure 1, E and F. For each molecular skeleton, the measured M (filled circles) and m (empty circles) are plotted against the calculated anisotropy for that projection [A = (M − m)/(M + m)] resulting in the scatterplots in panels A and B. Solid and dashed linear regression trend-lines are shown, respectively, for M and m. (Ten points farthest from the mean of each data set were trimmed before regression analysis.)




