


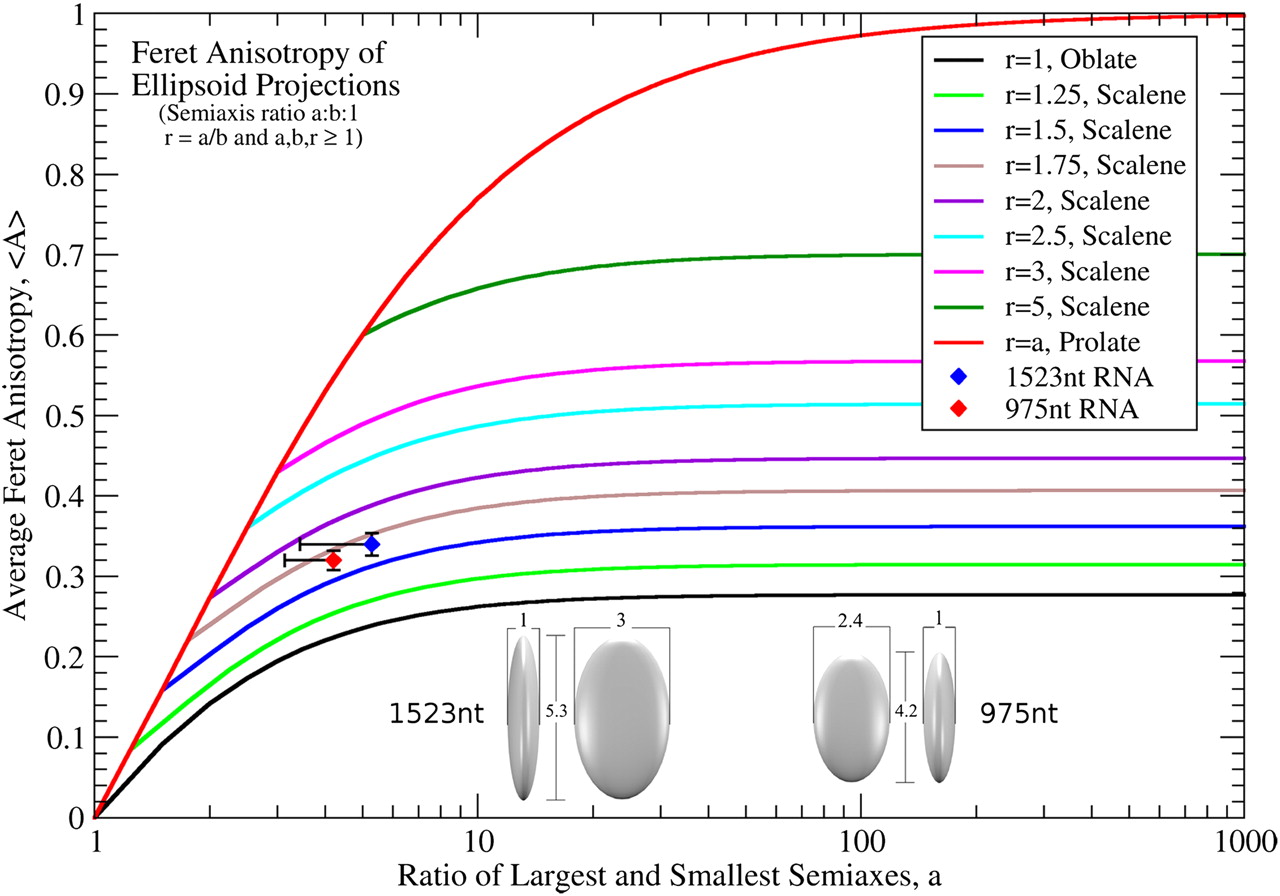
Projected anisotropy of ellipsoidal objects as a function of semi-axis ratios. Calculated average Feret anisotropies 〈A〉 from rotational analyses of ellipsoids with semi-axes ratio a:b:1, where the ratio r = a/b is fixed for each curve. 〈A〉 is plotted against a, the ratio of the longest and shortest semi-axes, equivalent to the experimental maximum value of M/m. Notice that 〈A〉 for oblate ellipsoids asymptotically reaches 0.28, distinctly lower than the experimental values of 0.32 and 0.34 obtained experimentally for the 975-nt and 1523-nt RNAs. The RNAs are therefore predominantly prolate. The red (975 nt) and blue (1523 nt) diamonds are plotted at the maximum value of M/m obtained from their projections. The vertical error bars represent the standard error of 〈A〉 and the horizontal error bar to the left of each point indicates the top 10 percentile range of M/m. The inferred semi-axes ratios for the two molecular ensembles, using r = 1.75, are 5.3:3.0:1 for 1523 nt and 4.2:2.4:1 for 975 nt (see inset at the bottom).




