


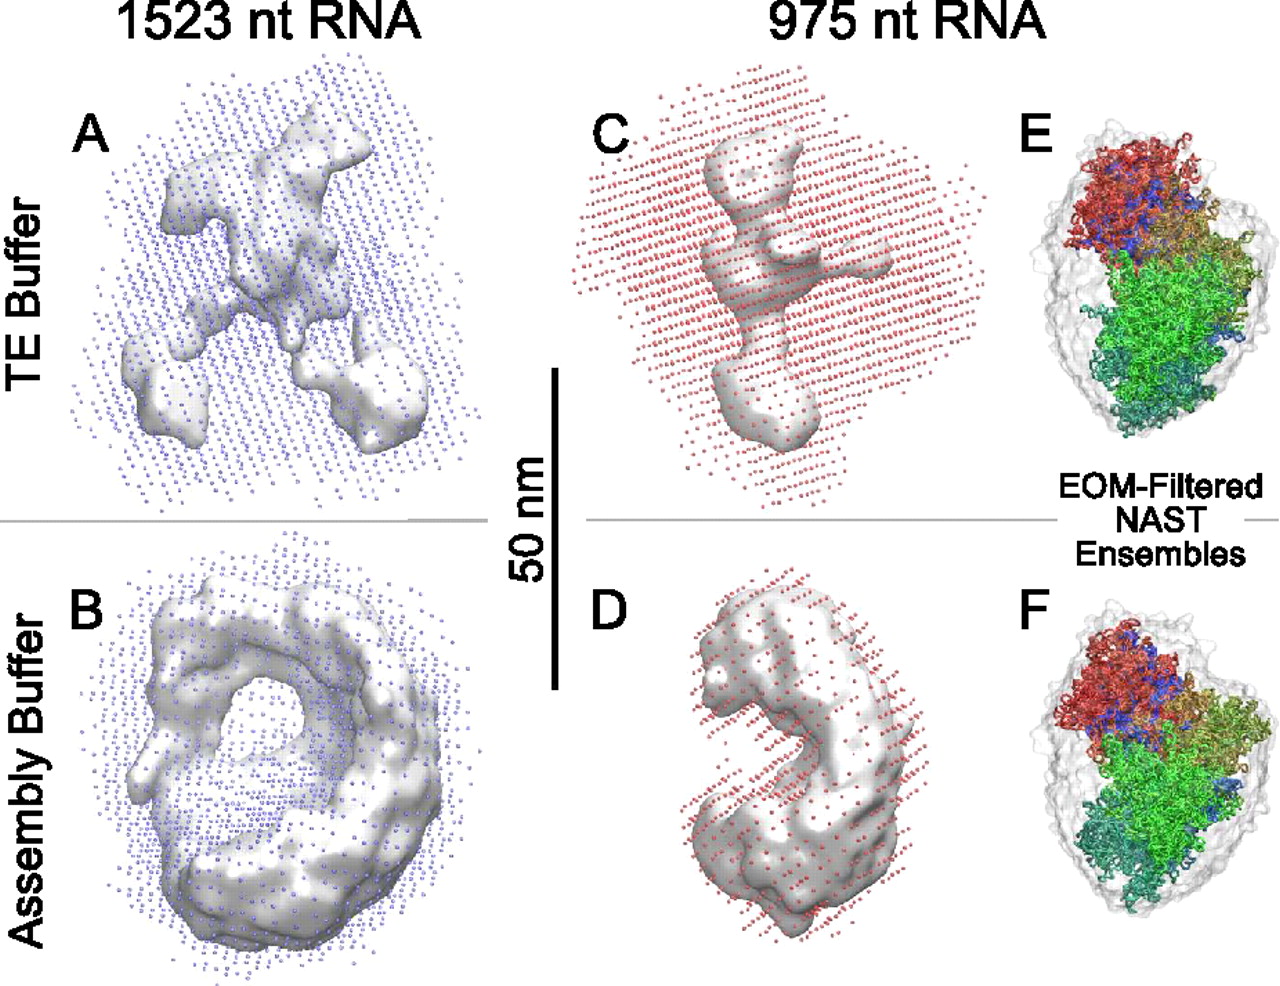
Comparison of total and filtered DAMMIF SAXS reconstructed volumes of 1523-nt and 975-nt RNAs in TE and in vitro assembly buffers. (A,C) (same as Figs. 4A6,B6) The total (dots) and filtered consensus volumes (gray surface) of the two RNAs in 10 mM TE buffer. Notice that in the higher-ionic-strength Mg2+-containing in vitro assembly buffer (B,D), the total volumes are smaller and the consensus volumes occupy a larger fraction of the total volume. This indicates that fewer bead configurations can explain the measured scattering curves, suggesting that the shape diversity in the conformational ensemble of RNA has been reduced in the presence of Mg2+. Each molecule, however, has an overall prolate or bean-like shape in both buffers. (E,F) Aligned RNA configurations (colored tubes) picked using the ensemble optimization method (see Materials and Methods) from 0.4-μsec trajectories of 11 distinct secondary structures for the 975-nt sequence. The volume collectively swept out by these trajectories is shown as a translucent gray surface. Aligned EOM optimized configurations are shown as colored tubes with a red–green–blue gradient in the 5′–3′ direction. Consistent with the DAMMIF results, the EOM optimized ensemble in TE buffer (E) is elongated, while a bent concave shape is seen in the in vitro assembly buffer (F).




