


A dual effect of FUBP1 on SPA lncRNA maturation
- Zheng-Hu Yang1,2,
- Fang Nan3,
- Guang Xu1,
- Huang Wu1,
- Meng-Yuan Wei1,
- Li Yang3,
- Ling-Ling Chen1,2,4,5,6 and
- Hao Wu1
- 1Key Laboratory of RNA Innovation, Science and Engineering, CAS Center for Excellence in Molecular Cell Science, Shanghai Institute of Biochemistry and Cell Biology, University of Chinese Academy of Sciences, Chinese Academy of Sciences, Shanghai 200031, China
- 2School of Life Science and Technology, ShanghaiTech University, Shanghai 201210, China
- 3Center for Molecular Medicine, Children's Hospital of Fudan University and Shanghai Key Laboratory of Medical Epigenetics, International Laboratory of Medical Epigenetics and Metabolism, Ministry of Science and Technology, Institutes of Biomedical Sciences, Fudan University, Shanghai 200032, China
- 4School of Life Science and Biotechnology, Shanghai Jiao Tong University, Shanghai 200240, China
- 5New Cornerstone Science Laboratory, Shenzhen 518054, China
- 6Shanghai Academy of Natural Sciences (SANS), Shanghai 200031, China
- Corresponding author: wuhao2021{at}sibcb.ac.cn
-
Handling editor: Fatima Gebauer
Abstract
SPAs are noncanonical long noncoding RNAs (lncRNAs) that are 5′ small nucleolar RNA (snoRNA) capped and 3′ polyadenylated. Two SPAs are processed from a polycistronic transcript embedded in the human 15q11-q13 region related to Prader–Willi syndrome (PWS). Once produced, SPAs accumulate at their transcription site and sequester splicing factors to form PWS bodies that are involved in alternative splicing regulation. But how the processing of SPAs is regulated has remained obscure. Here, we identified that both far upstream element-binding protein 1 (FUBP1) and myelin expression factor 2 (MYEF2) were enriched in the PWS bodies; loss of either individually impaired SPAs’ expression and dampened the size of PWS bodies in H9 and PA1 cells. Specifically, FUBP1, on the one hand, enhanced the transcription of SPA-embedded polycistronic transcripts by targeting the FUSE-like sequence upstream of the promoter, and on the other hand, was required for SPA1 splicing and maturation by binding the uridine (U)-rich intronic sequences. These findings suggest a comprehensive and distinct regulation of PWS region-derived SPA lncRNAs.
Keywords
INTRODUCTION
The diverse modes of RNA processing yield different species of long noncoding RNAs (lncRNAs) (Wu et al. 2017; Chen and Kim 2024). Although most lncRNAs have similar characteristics as mRNAs (Wu et al. 2017; Mattick et al. 2023), emerging evidence has shown that noncanonically processed lncRNAs also play important roles in different biological processes, such as NEAT1 in scaffolding paraspeckles (Chen and Carmichael 2009; Clemson et al. 2009; Sunwoo et al. 2009), SLERT in modulating RNA polymerase I (Pol I) transcription (Xing et al. 2017; Wu et al. 2021), as well as sno-lncRNAs and SPAs in forming the Prader–Willi syndrome (PWS) bodies (Yin et al. 2012; Wu et al. 2016). However, in-depth analyses of their expression regulation warrant further investigation.
In humans, the chromosome region 15q11-q13 is imprinted, leading to the expression of SNURF-SNRPN and a downstream polycistronic noncoding transcript only from the paternal allele (Nicholls et al. 1998; Yin et al. 2012). Over 70% of the patients with PWS are associated with the paternal deletion of this imprinted region, referred to as the PWS region (Bittel and Butler 2005; Cassidy et al. 2012; Angulo et al. 2015). This polycistronic transcript has been recognized as the precursor of small nucleolar RNA (snoRNAs) (Runte et al. 2001) and the snoRNA-ended lncRNAs. The latter includes five sno-lncRNAs (sno-lncRNA1-5) with snoRNA at both ends and two SPA lncRNAs (SPA1 and SPA2) with a 5′ snoRNA and a 3′ polyadenosine [poly(A)] tail (Fig. 1A; Yin et al. 2012; Wu et al. 2016).
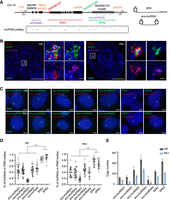
The localization pattern and relative abundance of the PWS region lncRNAs. (A, left) Schematic of the PWS region, including SNURF-SNRPN locus, SPAs and sno-lncRNAs. The exons are marked in black rectangles, the TSS and poly(A)s are marked in orange, and the snoRNA caps for SPAs are marked in red (SPA1) and green (SPA2) circles. The smFISH targeting regions of pre-snrpn, SPAs, and sno-lncRNAs are indicated. Specifically, the pre-snrpn is targeted to 5′ and middle region, SPAs are targeted to 5′, middle region, and 3′, and the sno-lncRNAs are targeted to the whole sequence. Probe sequences are listed in Supplemental Table S1. (Right) RNA structure of SPAs with snoRNA cap and poly(A) tail, and sno-lncRNAs with snoRNAs at both ends. (B) Representative RNA FISH images of SPAs in H9 and PA1 cells. Scale bar, 5 μm (uncropped) and 500 nm (cropped). (C) Representative RNA FISH images of sno-lncRNAs and SPAs in H9 and PA1 cells. Scale bar, 5 μm. pre-snrpn is stained as the marker of PWS bodies. (D) Percentage of the sno-lncRNAs and SPAs localized in the PWS bodies in H9 (left) and PA1 (right) cells. In H9 cells, n = 32 for sno-lncRNA1, n = 34 for sno-lncRNA2, n = 32 for sno-lncRNA3, n = 50 for sno-lncRNA4, n = 30 for sno-lncRNA5, n = 21 for SPA1, and n = 22 for SPA2. In PA1 cells, n = 28 for sno-lncRNA1, n = 28 for sno-lncRNA2, n = 27 for sno-lncRNA3, n = 49 for sno-lncRNA4, n = 30 for sno-lncRNA5, n = 26 for SPA1, and n = 25 for SPA2. (E) Copy number of sno-lncRNAs and SPAs in H9 and PA1 cells.
Although both sno-lncRNAs and SPAs are processed from the same polycistronic transcript that is derived from the PWS region, their production mechanisms are quite different. The processing of sno-lncRNAs is dependent on the snoRNA structures at both ends of the transcript. During exonucleolytic trimming, the snoRNAs recruit binding proteins to form snoRNP complexes, which protect the sequences between the snoRNAs from being cleaved, leading to the accumulation of sno-lncRNAs (Yin et al. 2012). In contrast, the processing of SPAs is attributed to coordination of the weak poly(A) signal of the upstream SNURF-SNRPN gene and the fast Pol II transcription. After the cleavage of the upstream transcript, the exonuclease XRN2 continues to cleave the downstream sequence until it encounters the snoRNP complex, thereby forming the 5′ snoRNP structure (Wu et al. 2016). SPAs have a similar half-life compared to the canonical 7-methyl guanosine (m7G)-capped RNAs (Wu et al. 2016). Specifically, SPA1 is 34,000 nt in length with SNORD107 cap and SPA2 is 16,000 nt with SNORD109A cap, both are box C/D snoRNAs (Balakin et al. 1996). Like NEAT1 that scaffolds paraspeckles, the SPAs are also classified as the architectural (arc) lncRNAs that tend to function as the platform to organize nuclear bodies (Chujo et al. 2016). They enrich at their transcription sites, forming a microscopically visible nuclear body with a volume of 1–2 μm3 together with sno-lncRNAs and their interacting proteins, which is termed PWS body (Wu et al. 2016). These RNAs can recruit splicing factors TDP-43, RBFOX2, and HNRNPM and regulate alternative splicing of some mRNAs encoding proteins involved in neuronal functions (Wu et al. 2016). For these noncanonically processed lncRNAs, how the production of SPAs is regulated has remained unknown.
Far upstream element-binding protein 1 (FUBP1) is a multifunctional protein involved in various cellular processes. It is first identified as a single-stranded DNA-binding protein and binds to the FUSE sequence located ∼1.5 kb upstream of the c-Myc P1 promoter (Duncan et al. 1994). FUBP1 interacts with the basal transcription factor TFIIH at the transcription start site (TSS) to increase its helicase activity (Liu et al. 2001), and facilitates c-Myc transcription (Duncan et al. 1994; Liu et al. 2006). FUBP1 is also an RNA-binding protein involved in the regulation of RNA life cycle (Zhang and Chen 2013; Debaize and Troadec 2019; Zhang et al. 2024). For example, FUBP1 is required for the efficient splicing of long introns. It binds to a cis-regulatory motif (UUU+A/G) upstream of the branch point and stabilizes the U2AF2 and SF1 at the 3′ splicing site (Ebersberger et al. 2023). Moreover, FUBP1 also binds to the untranslated region (UTR) of mRNAs such as GAP43 to regulate its stability (Irwin et al. 1997), or NPM and p27 to regulate their translation (Olanich et al. 2011; Zheng and Miskimins 2011).
Myelin expression factor 2 (MYEF2) is recognized as a transcriptional repressor of the myelin basic protein gene (MBP) (Haas et al. 1995), which is a major component of the myelin sheath. MYEF2 binds to the proximal MBP regulatory region (MB1) element of MBP promoter, thus inhibiting MBP transcription (Haas et al. 1995). The programmable expression of MYEF2 at postnatal stages is involved in the regulation of brain development (Haas et al. 1995). Yet the mode of MYEF2 action is still unclear.
Here, we screened factors enriched in the PWS bodies, showing FUBP1 and MYEF2 were new components. Interestingly, FUBP1 was required for the expression of SPAs via a dual mechanism. On the one hand, FUBP1 promoted the transcription of SPAs-embedded polycistronic transcripts by binding the FUSE-like sequence upstream of the promoter region; on the other hand, it bound to the U-rich intronic sequences in nascent SPA1 transcripts to regulate its splicing, ensuring its exon 5 inclusion to promote SPA1 maturation. Together, these results uncovered a unique regulation of SPA expression, providing a new mechanism for understanding the complexity of PWS region lncRNAs.
RESULTS
SPAs have higher enrichment in the PWS bodies than sno-lncRNAs
PWS region-derived SPAs are shown to be enriched at their transcription sites (Wu et al. 2016), but their exact localization pattern and relative abundance in cells have remained unclear. RNA single-molecule fluorescent in situ hybridization (smFISH) combined with high-resolution imaging by structured illumination microscopy (SIM) in the human pluripotent cell H9 and the human ovarian carcinoma cell PA1 showed that the vast majority of SPAs were localized at their transcription sites, which was evidenced by the co-localization with their precursor RNA pre-snrpn as expected (Fig. 1A–C; Supplemental Fig. S1A). Interestingly, when we assessed the localization of the five sno-lncRNAs derived from the same polycistronic transcript (Yin et al. 2012), although largely at the same loci, we observed diffused signals in the nucleus (Fig. 1C), suggesting a different localization pattern compared to PWS region SPAs. Statistically, ∼40%–50% of sno-lncRNA1/2/4/5 were enriched in the PWS bodies, while only <20% of sno-lncRNA3 was accumulated there (Fig. 1D). In contrast, over 60%–80% of SPAs were enriched there in both H9 and PA1 cells, respectively (Fig. 1D).
Next, we examined the copy numbers of these sno-lncRNAs and SPAs in H9 and PA1 cells via quantitative real-time reverse transcription PCR (RT-qPCR). Based on standard curves generated from varying concentrations of different SPA and sno-lncRNA fragments purified by in vitro transcription (IVT) (Supplemental Fig. S1B,C), ∼100–500 copies of sno-lncRNAs and SPAs were presented in H9 cells, while PA1 cells contained roughly half copies of these lncRNAs in each cell (Fig. 1E). Together, these analyses showed that although both SPAs and sno-lncRNAs were produced from the same polycistronic transcript that derived from PWS region and were relatively abundant, they displayed different localization patterns, with SPAs being more enriched in the PWS bodies compared to the sno-lncRNAs.
SPAs enrich FUBP1, MYEF2, and HNRNPM in PWS bodies
Given that the biogenesis of SPAs is different from that of mRNA-like lncRNAs (Wu et al. 2016), we want to understand how their expression is regulated. One hypothesis is that some protein factors may interact with SPAs thereby being involved in their processing. Thus, we performed SPA1 pull-down coupled with protein mass spectrometry (MS) in PA1 cells to identify factors interacting with SPA1 (Fig. 2A; Supplemental Fig. S2A).
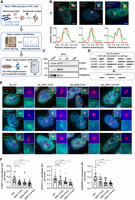
SPAs enrich FUBP1, MYEF2, and HNRNPM in PWS bodies in H9 cells. (A) Schematic of the workflow for identifying the SPA1-interacting proteins. The nuclear extract from PA1 cells is used for the RNA pull-down assay (step 1). The pull-down quality is confirmed by silver staining, and the interacting proteins are identified by mass spectrometry (step 2). The interacting proteins are further validated by imaging and western blotting (step 3). (B) Colocalization of SPA1 with FUBP1 (left), MYEF2 (middle), and HNRNPM (right). (Top) Representative images showing the colocalization. (Bottom) Line scans of the relative fluorescence intensity from the representative images above. Scale bar, 5 μm. (C) Western blotting showing the interaction between SPA1 and FUBP1, MYEF2, or HNRNPM in H9 cells. Proteins are pulled down by biotin-sense (S) SPA1, biotin-antisense (AS) SPA1, and biotin-egfp from H9 cells. (D) Top 20 SPA1-interacting proteins identified from (A). Fourteen of them are associated with transcription or splicing regulating (marked in bold). Among them, FUBP1, MYEF2, and HNRNPM are further validated. (E) The representative images showing that paternal depletion of SPA1, SPA2, or SPA1+2 reduces the enrichment of FUBP1, MYEF2, and HNRNPM in the PWS bodies in H9 cells. Scale bar, 5 μm (uncropped) and 500 nm (cropped). pre-snrpn is stained as the marker of PWS bodies. (F) Percentage of the PWS body localized FUBP1, MYEF2, and HNRNPM evidenced by colocalization with pre-snrpn in H9 cells. For evaluating PWS body localized FUBP1, WT (n = 26), SPA1 P-KO (n = 29), SPA2 P-KO (n = 21), and SPA1+2 P-KO (n = 29) cells are used. For evaluating PWS body localized MYEF2, WT (n = 20), SPA1 P-KO (n = 20), SPA2 P-KO (n = 22), and SPA1+2 P-KO (n = 20) cells are used. For evaluating PWS body localized HNRNPM, WT (n = 21), SPA1 P-KO (n = 24), SPA2 P-KO (n = 25), and SPA1+2 P-KO (n = 22) cells are used.
The 1000 nt biotin-labeled RNA fragments spanning the entire SPA1 sequence were applied for digging out interacting proteins, and the RNA fragments covering the antisense of SPA1 sequence as well as the biotin-labeled egfp were used as controls. Among the top 20 SPA1-interacting candidates (Supplemental Fig. S2B), 14 were reported to regulate RNA transcription or splicing, and were paid attention for further evaluation. We constructed the plasmids expressing these individual 14 proteins fused with the mNeonGreen tag at N-terminus and transfected them, respectively, into the H9 cells to check their subcellular localization patterns. smFISH of SPA1 was performed to indicate the PWS bodies. Of all evaluated proteins, three of them were shown to remarkable co-localize with SPA1, including our previously reported HNRNPM (Fig. 2B; Supplemental Fig. S2C; Wu et al. 2016). In addition, two novel factors, the FUBP1 and MYEF2, were also identified to accumulate there (Fig. 2B). The interaction between SPA1 and FUBP1, MYEF2, or HNRNPM was further confirmed by western blotting (WB) following independent RNA pull-down experiments conducted in H9 cells (Fig. 2C,D). To exclude that the enrichment of FUBP1, MYEF2, and HNRNPM to the PWS bodies was nonspecific due to the high abundance of SPA1 expression, we expressed the mNeonGreen tag fused peptidyl-prolyl cis-trans isomerase G (PPIG) or KH domain-containing RNA-binding protein QKI (QKI), both of which were nuclear localized RNA-binding proteins in H9 cells. The results showed that they did not co-localize with SPA1 (Supplemental Fig. S2D), suggesting that the enrichment of FUBP1, MYEF2, and HNRPNM to the PWS bodies was specific.
We then ask whether the accumulation of these proteins with SPA1 depends on the lncRNAs. We generated the SPA1, SPA2, and SPA1+2 paternal knockout (P-KO) H9 cells (Wu et al. 2016), which no longer expressed these lncRNAs from this paternally imprinted locus, and further examined localization patterns of FUBP1, MYEF2, and HNRNPM in these cell lines. We observed that all three proteins showed significantly reduced enrichment to the pre-snrpn signals, the marker of the PWS bodies, in the SPA1, SPA2, and SPA1+2 P-KO H9 cells (Fig. 2E,F). Similar results were also observed in the SPAs P-KO PA1 cells (Supplemental Fig. S3). Together, FUBP1 and MYEF2 represented two additional factors accumulated in PWS bodies, which was likely mediated by SPAs.
Both FUBP1 and MYEF2 regulate the expression of SPAs in PA1 and H9 cells
Given that both FUBP1 and MYEF2 are involved in gene expression regulation, we ask whether they would affect the expression pattern of SPAs. We knocked down FUBP1 and MYEF2 individually in PA1 cells with two different small hairpin RNAs (shRNAs) (Fig. 3A,B), followed by examining the levels of SPA1, SPA2, and their precursor RNAs via RT-qPCR. As expected, the expression of all these RNAs was reduced (Fig. 3A,B), together with the reduced expression of pre-snrpn and snrpn as they all derived from the same polycistronic transcript (Figs. 1A, 3A,B). To confirm this, we co-cultured the FUBP1 or MYEF2 knockdown PA1 cells with the scramble shRNA treated PA1 cells, and detected the expression of SPAs and pre-snrpn via smFISH in the mixed cells. In line with the above RT-qPCR results, we observed the dampened size of PWS bodies with reduced expression of SPA1, SPA2, and pre-snrpn in both FUBP1 and MYEF2 knockdown PA1 cells compared to the scramble shRNA treated PA1 cells (Fig. 3C–J). These results suggested that both FUBP1 and MYEF2 promoted the expression of the polycistronic transcript transcribed from the PWS region. Of note, knockdown of FUBP1 or MYEF2 also affected expression of SPAs in H9 cells, although to a mild level (Supplemental Fig. S4).
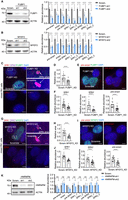
FUBP1 and MYEF2 regulate the expression of SPAs in PA1 cells. (A) Knockdown of FUBP1 impairs the expression of SPAs. (Left) Knockdown efficiency of FUBP1 analyzed by WB. (Right) Expression levels of pre-snrpn, snrpn, pre-SPAs, and SPAs detected by RT-qPCR. (B) Knockdown of MYEF2 impairs the expression of SPAs. (Left) Knockdown efficiency of MYEF2 analyzed by WB. (Right) Expression levels of pre-snrpn, snrpn, pre-SPAs, and SPAs detected by RT-qPCR. (C) Representative images showing the dampened size of PWS bodies (SPAs’ area) and reduced expression of SPAs in the FUBP1 knockdown PA1 cells compared to the scramble PA1 cells. Scale bar, 5 μm (uncropped) and 1 μm (cropped). (D) Knockdown of FUBP1 dampens the size of the PWS bodies in PA1 cells. n = 21 scramble and n = 24 FUBP1 knockdown cells are evaluated. (E) Representative images showing the reduced expression of pre-snrpn in the FUBP1 knockdown PA1 cells compared to the scramble PA1 cells. Scale bar, 5 μm. (F) Knockdown of FUBP1 leads to the reduced expression of SPAs and pre-snrpn in PA1 cells. For evaluating SPA1 expression, n = 27 scramble and n = 26 FUBP1 knockdown cells are used. For evaluating SPA2 expression, n = 18 scramble and n = 17 FUBP1 knockdown cells are used. For evaluating pre-snrpn expression, n = 16 scramble and n = 24 FUBP1 knockdown cells are used. (G) Representative images showing the dampened size of PWS bodies (SPAs’ area) and reduced expression of SPAs in the MYEF2 knockdown PA1 cells compared to the scramble PA1 cells. Scale bar, 5 μm (uncropped) and 1 μm (cropped). (H) Knockdown of MYEF2 dampens the size of the PWS bodies in PA1 cells. n = 20 scramble and n = 21 MYEF2 knockdown cells are evaluated. (I) Representative images showing the reduced expression of pre-snrpn in the MYEF2 knockdown PA1 cells compared to the scramble PA1 cells. Scale bar, 5 μm. (J) Knockdown of MYEF2 leads to the reduced expression of SPAs and pre-snrpn in PA1 cells. For evaluating SPA1 expression, n = 18 scramble and n = 22 MYEF2 knockdown cells are used. For evaluating SPA2 expression, n = 17 scramble and n = 30 MYEF2 knockdown cells are used. For evaluating pre-snrpn expression, n = 20 scramble and n = 23 MYEF2 knockdown cells are used. (K) Knockdown of HNRNPM does not affect the expression of SPAs. (Left) Knockdown efficiency of HNRNPM analyzed by WB. (Right) Expression levels of pre-snrpn, snrpn, pre-SPAs, and SPAs detected by RT-qPCR.
Interestingly, although HNRNPM was also enriched to the PWS bodies and interacted with SPA1 (Fig. 2B,C), it seemed that loss of HNRNPM did not affect the expression of all mature or nascent transcripts derived from this region (Fig. 3K), consistent with its reported role in splicing regulation of mRNAs (Wu et al. 2016).
FUBP1 promotes SPAs’ transcription via a FUSE-like sequence
Because MYEF2 is defined as a transcription repressor, its function in promoting SPAs expression might be indirect. Thus, we focus on investigating how FUBP1 regulates the expression of SPAs. As it is known that FUBP1 acts as the transcription activator of c-Myc by binding the FUSE sequence ∼1500 bp upstream of its P1 promoter (Avigan et al. 1990; Duncan et al. 1994), we ask whether a similar mechanism also occurs for FUBP1 to regulate SPAs transcription. Firstly, we sought to identify the binding sites of FUBP1 within the sequence upstream of the SNURF-SNRPN TSS. To achieve this, we performed a FUBP1 chromatin immunoprecipitation (ChIP) assay, followed by qPCR detection of DNA fragments located within 5500 bp upstream of the SNURF-SNRPN TSS (Fig. 4A). Among the 19 detected fragments (p1–p19), we identified two DNA fragments that exhibited high affinity for FUBP1 binding: fragment p4, located ∼4200 bp upstream of the SNURF-SNRPN TSS, and fragment p19, situated within the SNURF-SNRPN promoter (Fig. 4A). In fragment p4, we found a FUSE-like sequence with 14 bp overlap to FUSE of c-Myc, which is located 4253 bp upstream of the SNURF-SNRPN TSS (Fig. 4B).
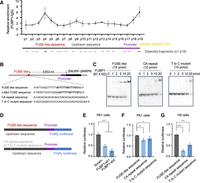
FUBP1 promotes SPAs’ transcription by interacting with a FUSE-like sequence. (A) FUBP1 binds to the DNA fragments that contain the FUSE-like sequence (p4) and the fragments within the promoter sequence (p19) upstream of SNURF-SNRPN TSS, revealed by FUBP1 ChIP-qPCR detection. Locations of the 19 detected fragments are shown at bottom. p4 and p19 fragments are marked in bold. (B) Schematic of the gene organization of SNURF-SNRPN and the upstream FUSE-like sequence. The sequence of FUSE-like sequence, c-Myc FUSE sequence, CA repeat sequence, and T to C mutant sequence are shown below. (C) FUBP1 binds the FUSE-like sequence upstream of the SNURF-SNRPN promoter, revealed by EMSA. (D) Schematic of the luciferase reporter plasmids containing the FUSE-like sequence, CA repeat sequence, or T to C mutant sequence. (E) Knockdown of FUBP1 reduces the transcription of FUSE-like sequence containing reporter plasmids, revealed by the luciferase reporter assay. (F,G) FUSE-like sequence promotes transcription of the reporter plasmids compared to the CA repeat sequence and the T to C mutant sequence in PA1 cells (E) and in H9 cells (F), revealed by the luciferase reporter assay.
Next, we evaluated the interaction between FUBP1 and the FUSE-like sequence. The His-tagged FUBP1 was expressed and purified via the prokaryotic system, incubated with the FUSE-like DNA sequence, and then subjected to electrophoretic mobility shift assay (EMSA). We observed the band shift of FUSE-like sequence starting from incubating with 1 pmol of His-FUBP1 (Fig. 4C). Of note, it is reported that the multiple thymines (Ts) in the FUSE sequence are essential for FUBP1 binding, and some FUSE-like sequences exhibit a preference for GT-rich stretches (Debaize and Troadec 2019). Thus, we generated the CA repeat sequence and T to C mutant FUSE-like sequence as negative controls (NCs) (Fig. 4B). As expected, these controls showed relatively mild interaction with FUBP1 evidenced by the band shift starting from 10 pmol of His-FUBP1 (Fig. 4C). Together, we concluded that FUBP1 interacted with the FUSE-like sequence upstream of the SNURF-SNRPN.
To further confirm that FUBP1 can regulate SPAs expression via binding to the FUSE-like sequence, we cloned the 4.8 kb sequence upstream of the TSS of SNURF-SNRPN, containing the FUSE-like sequence, and constructed it into a plasmid expressing the firefly luciferase reporter (Fig. 4D). The Renilla luciferase reporter was used as the transfection control. By expressing these constructs in the FUBP1 knockdown PA1 cells, we found that loss of FUBP1 reduced the luciferase signals to ∼50% compared to the scrambled PA1 cells (Fig. 4E). This result indicated that FUBP1 played a role in facilitating the transcription of sequences containing FUSE-like elements.
Next, we cloned the CA repeat sequence and the T to C mutant sequence individually into the reporter plasmids instead of the FUSE-like sequence (Fig. 4D). By introducing the reporter plasmids into PA1 cells, we found that the reporter containing the CA repeat sequence or the T to C mutant sequence exhibited an ∼20% lower luciferase signals compared to those reporters containing the FUSE-like sequence, which further supported that the FUSE-like sequence was essential for FUBP1-regulated transcription (Fig. 4F). However, this reduced transcription was relatively mild compared to the FUBP1 knockdown (Fig. 4E,F), suggesting that FUBP1 may also regulate transcription via other modes. Interestingly, introducing the reporter plasmids containing the mutated FUSE-like sequences into H9 cells showed a strikingly significant reduced transcription compared to that in PA1 cells (Fig. 4F,G), suggesting that the function of FUBP1 in transcription regulation may be cell type dependent. Collectively, these results highly suggested that FUBP1 enhanced the polycistronic SNURF-SNRPN transcription at least partially via binding the FUSE-like sequence, and subsequently facilitated the expression of SPAs.
FUBP1 regulates the splicing of SPA1 via the intronic U-rich sequence
Recent studies have shown that the multivalent interaction of FUBP1 with splice site components supports the spliceosome assembly and RNA splicing (Ebersberger et al. 2023). Given the complexity of RNA processing in this PWS region-derived polycistronic transcript, we evaluated whether FUBP1 also regulated the splicing of SPAs. The analysis of FUBP1 iCLIP-seq data (GEO: GSE220184) (Ebersberger et al. 2023) revealed two binding sites of FUBP1 in the intron 4 of SPA1 (referred to as SPA1_I4-BS1 and SPA1_I4-BS2), which were U-rich and at the 3′ terminus (Fig. 5A). EMSA analysis confirmed the interaction of His-tagged FUBP1 with these binding sites containing sequences, but not the NC sequence (Fig. 5B). Next, we found that loss of FUBP1 affected the splicing of the exon 5 in SPA1 as shown by RT-PCR. Indeed, knockdown of FUBP1 promoted the skipping of exon 5 in both PA1 and H9 cells (Fig. 5C,D), strongly supporting the splicing regulation of SPA1 by the FUBP1. Of note, there was no obvious binding sites of FUBP1 on SPA2 (Supplemental Fig. S5), indicating that FUBP1 may not directly regulate the splicing of SPA2.
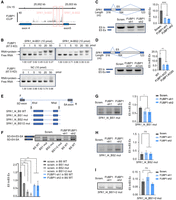
FUBP1 regulates splicing of SPA1 via the U-rich sequence. (A) FUBP1 iCLIP-seq results (GEO: GSE220184) (Ebersberger et al. 2023) showing strong binding to the 3′ of the SPA1 intron 4. The pink boxes refer to the FUBP1 binding sites named SPA1-I4-BS1 and SPA1-I4-BS2. (B) FUBP1 binds the SPA1-I4-BS1 and SPA1-I4-BS2, revealed by EMSA. (C) FUBP1 affects the splicing of SPA1 in PA1 cells. (Upper left) Schematic of SPA1 splicing. The length of SPA1 exons is indicated. (Lower left) Agarose gel image showing that loss of FUBP1 results in SPA1 exon 5 skipping. (D) FUBP1 affects the splicing of SPA1 in H9 cells. (Upper left) Schematic of SPA1 splicing. The length of SPA1 exons is indicated. (Lower left) Agarose gel image showing that loss of FUBP1 results in SPA1 exon 5 skipping. (E) Schematic of the minigene assay design. SPA1_I4_BS_WT, SPA1_I4_BS1 mutation, SPA1_I4_BS2 mutation or SPA1_I4_BS1/2 double mutant is inserted in the plasmids. (F) Expressing the minigene containing the BS1 and BS2 single or double mutation in the scramble PA1 cells or expressing the minigene containing BS_WT in the FUBP1 knockdown PA1 cells results in increased exon 5 skipping of SPA1, revealed by RT-PCR. (G) Knockdown of FUBP1 results in the increased exon 5 skipping of SPA1_I4_BS1 mutant, revealed by RT-PCR. (H) Knockdown of FUBP1 barely affects the splicing of SPA1_I4_BS2 mutant, revealed by RT-PCR. (I) Knockdown of FUBP1 barely affects the splicing of SPA1_I4_BS1 and SPA1_I4_BS2 double mutant, revealed by RT-PCR. (C, D, F–I). Statistics of three biological repeats of the gels are shown.
To better understand how FUBP1 could regulate SPA1 splicing, we amplified the sequence spanning from the 3′ end of intron 3 to the 5′ end of intron 5 of SPA1 and constructed this fragment into the pSPL3 vector (Fig. 5E). At the same time, we made mutations of the SPA1_I4-BS1 and SPA1_I4-BS2 sites individually or together by replacing the 60 bp U-rich binding sequences into CA repeats (Fig. 5E). After introducing these plasmids into PA1 cells, RT-PCR was performed to detect the RNA variants. The results showed that mutating the SPA1_I4-BS1 site promoted the exon 5 skipping that mimicked the FUBP1 knockdown conditions (Fig. 5F). Of note, mutating the SPA1_I4-BS2 site also dampened the RNA expression with a dramatic exon 5 skipping (Fig. 5F). This could be reasoned by the fact that the SPA1_I4-BS2 site was close to the 3′ splicing site of intron 4, loss of which almost completely abolished the exon 5 splicing. In line with this, knockdown of FUBP1 facilitated exon 5 skipping in SPA1_I4-BS1 mutant, while it had no effect on SPA1_I4-BS2 mutation (Fig. 5G,H). In addition, double mutating the SPA1_I4-BS1 and SPA1_I4-BS2 showed enhanced exon 5 exclusion compared to their single mutations (Fig. 5F), but did not display addictive effects when FUBP1 was knockdown (Fig. 5I). This further supported that FUBP1 regulated SPA1 splicing by interacting with SPA1_I4-BS1 and SPA1_I4-BS2.
Together, these results suggest that FUBP1 not only promotes the transcription of the SPA-embedded polycistronic transcripts but is also required for SPA1 splicing and maturation. This stringent mode ensures the proper expression of SPAs that are normally accumulated as nuclear bodies (Fig. 6) with a potential role in splicing regulation (Wu et al. 2016).
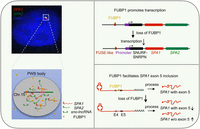
A dual effect of FUBP1 on SPAs’ expression. The model of FUBP1 regulating the expression of SPAs in the PWS bodies. FUBP1 is enriched in the PWS bodies via interacting with SPA1. It promotes the transcription of SPA-embedded polycistronic transcripts and regulates SPA1 splicing. This dual effect of FUBP1 ensures proper expression of SPAs in the PWS bodies, which may have potential roles in splicing regulation.
DISCUSSION
The human chromosome 15-embedded PWS region comprises a polycistronic transcript that is processed into multiple snoRNAs, sno-lncRNAs, and SPAs (Yin et al. 2012; Wu et al. 2016). These snoRNA-related lncRNAs can regulate RNA splicing (Yin et al. 2012; Wu et al. 2016), while their processing regulation has remained largely unclear. In this study, we report that FUBP1 and MYEF2 are enriched in the PWS bodies by interacting with SPA1 (Fig. 2) and promote the level of SPAs by facilitating transcription of the PWS region-derived polycistronic transcript (Figs. 3, 4). Importantly, FUBP1 is also required for SPA1 splicing, a step essential for RNA maturation. This dual effect via a single factor is rare in the regulation of mRNA-like lncRNA processing. Unlike mRNA-like lncRNAs, which are originated from pre-mRNAs, the production of SPAs via polycistronic processing is more complex, offering a potential for the proposed dual effect of the FUBP1-mediated regulation. In addition, the subcellular localization of SPAs at their transcription sites may limit their interactions with other RNA processing machinery factors. Such a dual effect may ensure the efficient use of multifunctional proteins like FUBP1 to help its transcription and maturation. Whether similar factors are involved in the maturation of mRNA-like lncRNAs or other transcription site-localized lncRNAs in a dual-role manner requires additional investigations.
FUBP1 regulates splicing of SPA1 exon 5 by binding the U-rich sequence at the 3′ of SPA1 intron 4 (Fig. 5). This altered splicing of SPA1 in the absence of FUBP1 may be recognized as an incorrectly spliced RNA, and result in the exosome-mediated degradation, further reducing SPA1 expression. Of note, we have not observed a strong binding peak of FUBP1 to the SPA2 intronic sequence, indicating that FUBP1 plays a limited role in SPA2 splicing. However, the large reduction of SPA2 expression in FUBP1-depleted cells (Fig. 3A,B) indicates a tight coupling between SPA1 and SPA2 processing. Moreover, the promotion of SPAs expression by FUBP1 suggests that sufficient levels of SPAs in PWS bodies may be essential for the proper function of PWS bodies in healthy individuals (Sun et al. 2023). For instance, it may ensure SPA levels to sequester sufficient amount of splicing factors, such as TDP-43, RBFOX2, and HNRNPM (Wu et al. 2016), the aberrant localization and expression of which are reported to be associated with neurogenetic disorders, such as amyotrophic lateral sclerosis (ALS), frontotemporal lobar degeneration (FTLD) (Tollervey et al. 2011; Lagier-Tourenne et al. 2012), and autism (Weyn-Vanhentenryck et al. 2014; Damianov et al. 2016).
Interestingly, we find that depleting either FUBP1 or MYEF2 in PA1 cells leads to a greater decrease in SPAs expression compared to that observed in H9 cells (Fig. 3A,B; Supplemental Fig. S3). This is in contrast to the observation that FUSE-like sequence-mediated transcription regulation is more significant in H9 cells than in PA1 cells (Fig. 4F,G). The results suggest an intricate transcriptional regulation of FUBP1 in vivo and align with previous studies showing that FUBP1 regulates c-Myc transcription only in specific cell lines (Avigan et al. 1990; Duncan et al. 1994). In addition, the maternal copy of the PWS gene region is hypermethylated, which may help FUBP1 bind the paternal FUSE-like sequence and thereby facilitate SPAs transcription. Of note, although our ChIP-qPCR and EMSA results have shown that FUBP1 interacts with the FUSE-like sequence upstream of SNURF-SNRPN (Fig. 4A,C), further validation is necessary to confirm the FUBP1-mediated transcriptional regulation in vivo. Besides, how MYEF2 regulates SPAs expression needs further exploration.
Finally, although the SPAs are localized within the critical PWS region, the relationship between these lncRNAs and the pathogenesis of PWS remains unclear. Given that PWS symptoms, such as obesity, intellectual disability and growth hormone deficiency, are likely due to dysfunction in the neuronal and endocrine system (Angulo et al. 2015; Tauber and Hoybye 2021), future investigations are warranted to assess the expression regulation of SPAs and their functions in different brain regions, particularly in the hypothalamus. Additionally, since FUBP1 is expressed throughout the adult brain (Hwang et al. 2018), it will be necessary to understand how FUBP1 regulates SPAs expression in neurons and whether such regulation has any measurable outputs related to PWS phenotypes.
MATERIALS AND METHODS
Cell culture and cell transfection
Human PA1 cells were cultured in Minimum Essential Medium Alpha (Gibco 12571071) supplemented with 10% fetal bovine serum (Gibco 10438-026) and 0.1 mM L-GlutaMAX (Gibco 35050061). Human ES cells H9 were cultured in Dulbecco's Modified Eagle Medium/Nutrient Mixture F-12 (DMEM/F12) (Gibco 11330032) supplemented with 0.1 mM L-GlutaMAX, 0.1 mM nonessential amino acids (NEAA) (Thermo Fisher Scientific 11140050), 0.1 mM 2-mercaptoethanol (Sigma), 4 ng/mL β-FGF (R&D Systems) and 20% knockout serum replacement (Thermo Fisher Scientific 10828028), and maintained in the incubator (Thermo Fisher Scientific) with 5% CO2 at 37°C.
PA1 cell transfection was done by using Lipofectamine 3000 Transfection Reagent (Invitrogen L3000015), according to manufacturer's instructions. Cells were seeded into 6-well plates and cultured as described above. Once the cell confluency reached 70%, transfection was performed. Briefly, 2.5 μg plasmids were diluted into 125 μL Opti-MEM Medium (Thermo Fisher Scientific 11058021) together with 5 μL P3000 reagent. Simultaneously, 3.75 μL Lipofectamine 3000 was also diluted into 125 μL Opti-MEM Medium. They were mixed, vortexed vigorously for 15 sec, and incubated for another 15 min. Next, the mixed reagents were transferred onto cultured PA1 cells.
H9 cell transfection was done by using FuGENE HD Transfection Reagent (Promega E2311), according to manufacturer's instructions. Cells were seeded into 6-well plates coated with Matrigel (Corning) and cultured as described above. Briefly, 2 μg plasmids were diluted in 100 μL Opti-MEM Medium together with 6 μL FuGENE HD Transfection Reagent, gently mixed well, and incubated for 10 min. Next, the mixed reagents were transferred onto cultured H9 cells.
Plasmid construction
To construct the shRNA vectors, shRNA sequences and a scrambled sequence were individually cloned into pLKO.1-TRC vector cut by the AgeI and EcoRI to obtain all shRNA plasmids. Lentiviral particles were produced in HEK293FT cells.
To construct the mNeonGreen fused plasmids for RNA pull down proteins, full-length FUBP3, RBMX, HNRNPR, KHSRP, FUBP1, HNRNPM, HNRNPA1, HNRNPA2B1, MYEF2, HNRNPD, HNRNPL, ELAVL1, PTBP1, and HNRNPC were individually amplified from PA1 cDNAs, and inserted into pmNeonGreen-C1 vector using the multiple fragment one-step clone method by pEASY-Basic Seamless Cloning and Assembly Kit (TransGen Biotech CU201-03).
To construct the protein purification plasmids, FUBP1 sequence was cloned from cDNA of PA1 cells and inserted into pET-28a. To construct the luciferase reporter assay associated plasmids, the sequence (4.8 kb upstream of SNURF-SNRPN TSS) was cloned from gDNA of PA1 cells and inserted into pGL3-Basic Vector. To construct the minigene assay associated plasmids, intron 3 to intron 5 of SPA1 was cloned into pSPL3 cut by the XhoI and NheI. All the primers for vector constructions are listed in Supplemental Table S2, and all the restriction enzymes were purchased from New England Biolabs (NEB).
Protein purification
Expression plasmids for His-tagged FUBP1 in pET-28a were individually transformed into E. coli expression strain Rosetta 2 (DE3) pLysS Chemically Competent Cell (WeiDi EC1016). After transformation, a single colony was inoculated in 5 mL LB media supplemented with 100 mg/L kanamycin at 220 rpm, 37°C. Then, the culture was diluted into 1000 mL LB medium supplemented with 100 mg/L kanamycin. Absorbance was monitored at a wavelength of 600 nm, and upon reaching an optical density (OD600) of 0.6–0.8, IPTG was added to LB medium at a final concentration of 0.5 mM for the induction of protein expression. After overnight incubation at 220 rpm, 16°C, cell pellets were harvested by centrifugation (5000 rpm, 10 min, 4°C), resuspended in lysis buffer (20 mM Tris pH 8.0, 500 mM NaCl, 0.5 mM PMSF, 5% glycerol) with 1 mg/mL lysozyme rotated at 4°C for 30 min, and fragmented by a high-pressure homogenizer at 4°C. After centrifugation at 10,000 rpm for 30 min at 4°C, the supernatant cell lysates were filtered through a 0.45 filter and then incubated with Ni Sepharose (Cytiva 17-5318-01) for 2 h at 4°C. The Sepharose beads were washed with washing buffer (20 mM Tris pH 8.0, 500 mM NaCl, 20 mM imidazole 0.5 mM PMSF, 5% glycerol), and bound proteins were eluted with elution buffer (20 mM Tris pH 7.5–8.0, 500 mM NaCl, 200 mM imidazole 0.5 mM PMSF, 5% glycerol) twice. After that, the proteins were subjected for further purification via AKTA with the HiLoad 16/600 Superdex 200 pg column (Cytiva 28989335) and concentrated with Amicon Ultra-4 Centrifugal Filter (Millipore). Proteins were flash-frozen with liquid nitrogen and stored at −80°C until use.
Quantitative real-time reverse transcription PCR (RT–qPCR)
Total RNAs were isolated from cells using TRIzol Reagent (Ambion 15596018), according to manufacturer's instructions, and followed by treatment with DNase I (Invitrogen 89836) to remove possible DNA contamination. Next, take 1 μg RNA as a template, and do reverse transcription using the PrimeScript RT Reagent Kit (Takara RR037B) in 20 μL volume to make cDNA. Realtime-PCR solution was made with SYBR Green Realtime PCR Master Mix (TOYOBO QPS-201C) and run in StepOnePlus Real-Time PCR System (Applied Biosystems). Normalization was done with values obtained with ACTB mRNA. Sequences of primers used are given in Supplemental Table S2.
Western blot
Cells were collected after treatment and resuspended in SDS loading buffer (2% SDS, 10% glycerol, 0.05% bromophenol blue, 5% 2-Mercaptoethanol, 50 mM Tris, pH 6.8). The samples were boiled at 95°C metal baths for 10 min, followed by ice cooling for 2 min. After centrifugation at 12,000g for 3 min, supernatants containing soluble proteins were separated on SDS-PAGE gels. SDS-PAGE gels were prepared using 30% acrylamide (29:1) (Sangon B546017) mixed with ultrapure water and resolving gel buffer (0.1% SDS, 0.375 M Tris, pH 8.8) to obtain 12% resolving gel, or stacking gel buffer (0.1% SDS, 0.125 M Tris, pH 6.8) to obtain 8% stacking gel. Ten percent of ammonium persulfate (Sangon a100486) and tetramethylethylendiamine (Sigma T9281) were added to catalyze the polymerization reaction. Gel electrophoresis was performed at 85 V for 25 min, and then at 120 V for 60 min. After gel separation, proteins were transferred onto the 0.2 µm PVDF membrane (Millipore ISEQ00010) at 250 mA at 4°C for 90 min. Then membranes were blocked for 1 h at room temperature with 5% skim milk in PBS with 0.05% Tween 20 (PBST), incubated with primary antibody: rabbit anti-FUBP1 (Abcam ab181111) at 1:1000 dilution, rabbit anti-MYEF2 (Abcam ab170946) at 1:2000, mouse anti-HNRNPM (Santa Cruz sc-20002) at 1:1000 or anti-β-Actin−Peroxidase (Sigma A3854) at 1:5000 dilution in PBST with 1% BSA overnight at 4°C. Then, membranes were washed three times for 10 min with PBST and incubated with HRP-conjugated AffiniPure Goat Anti-Rabbit secondary antibody (ABclonal AS014) or Goat Anti-Mouse secondary antibody (Proteintech SA00001-1) at 1:2000 dilution for 1 h at room temperature with 5% skim milk in PBST. After another three washes with PBST, photos were taken with Pierce ECL WB substrate (Thermo Fisher Scientific 32106) by the chemiluminescence imaging system from Sagecreation.
In vitro RNA transcription and purification
RNA probes for RNA pull-down: DNA templates were obtained by PCR amplification from cDNA of PA1 cells with SP6 and T7 promoter addition at the 5′ end. IVT was performed by RiboMax Large Scale RNA Production System (Promega P1300), according to manufacturer's protocol. Briefly, 1 μg PCR-amplified T7-DNA fragments or SP6-DNA fragments were incubated with 2 μL T7 or SP6 RNA polymerase enzyme in 20 μL reaction buffer for 4 h at 37°C, followed by DNase I treatment for 30 min at 37°C to remove DNA templates. Transcription reactions were doped with Bio-16-UTP (Invitrogen AM8452) to get biotin-labeled RNA. Transcribed RNAs were resolved on denaturing urea polyacrylamide gel and visualized by ethidium bromide staining. Corresponding bands on denaturing urea polyacrylamide gel were excised and dissolved with TE buffer. After excising and resolving the ethidium bromide-stained gels, we applied the ethanol precipitation step to further purify the RNAs. In detail, we added 2.5 volumes of the 100% ethanol and 1/10 volume of 4M LiCl into the samples, mixed well, and centrifugated at 12,000g for 15 min. The RNA pellet was further washed with 75% ethanol for two times and resolved with ultrapure water.
RNAs for in vitro binding assay: DNA templates were synthesized by Biosune company and annealed by heating at 95°C for 10 min, then slowly cooled down to room temperature. IVT was performed by RiboMax Large Scale RNA Production System according to the manufacturer's protocol. Primers are listed in Supplemental Table S2.
Electrophoretic mobility shift assay
The DNA fragments were synthesized by Biosune. Proteins were prepared as described above. Ten picomoles of DNAs and increasing amounts of proteins were used in each EMSA reaction. Protein–DNA binding was carried out with the indicated amount of purified protein and DNA in binding buffer (10 mM HEPES pH 7.5, 50 mM KCl, 1 mM MgCl2, 1 mM DTT [DL-Dithiothreitol]). A DNA-only group was used as blank control. Binding reactions were incubated at room temperature for 25 min, then immediately loaded onto a 6% nondenaturing polyacrylamide 0.5 × TBE gel. The gel was run for 15 min at 120 V and was imaged by EMSA Kit (Thermo Fisher Scientific) according to the manufacturer's protocol.
The RNAs were purified by IVT. The purified RNAs were annealed by heating at 65°C for 5 min, then slowly cooled down to room temperature. Ten picomoles of RNAs were used for each EMSA reaction. Protein–RNA binding was carried out with the indicated amount of purified protein and RNA in binding buffer at room temperature for 20 min, then immediately loaded onto a 2% agarose gel. The gel was run for 15 min at 120 V and visualized by ethidium bromide staining.
Measurement of SPAs copy number
Since the SPA1 and SPA2 were too long to perform full-length IVT, the 5′ of SPA1, 5′ of SPA2 and sno-lncRNAs were amplified from the gDNA of PA1 cells. Then the SPAs DNA templates were used for IVT and further purified by PAGE gel. To measure SPAs and sno-lncRNAs copy numbers per cell, total RNAs were extracted from 1 × 10⁶ PA1 cells and H9 cells by classic TRIzol extraction method. Then the RNAs from cells and the purified RNAs by IVT were reversely transcribed into cDNAs. A serial dilution of purified SPAs and sno-lncRNAs fragments in vitro was used for RT-qPCR to generate a standard curve, and cDNA from RNA in cells was simultaneously used for RT-qPCR. The copy number of SPAs and sno-lncRNAs were quantitated from the standard curve.
RNA pull-down
Biotinylated RNA pull-down was performed as described (Wu et al. 2016). All biotin-labeled RNAs were described as above. Four micrograms of biotinylated RNA was heated for 5 min at 65°C in PA buffer (10 mM Tris HCl pH 7.5, 10 mM MgCl2, 100 mM NH4Cl) and slowly cooled down to room temperature. 1 × 10⁷ H9 cells were resuspended in 2 mL PBS, 2 mL nuclear isolation buffer (1.28 M sucrose, 40 mM Tris-HCl pH 7.5, 20 mM MgCl2, 4% Triton X-100) and 6 mL DEPC-water on ice for 15 min. After pelleting nuclei by centrifugation at 4°C 1000 rpm for 5 min, nuclear pellet was resuspended in 1 mL binding buffer (100 mM HEPES pH 7.0, 50 mM KCl, 10% glycerol, 1 mM EDTA, 1 mM DTT, 0.5% Triton X-100) supplemented with tRNA (0.1 mg/mL), heparin (0.5 mg/mL) and RNasin (1 unit). The nuclei were sonicated and centrifuged at 4°C 13,000 rpm for 10 min. The supernatant was pre-cleared with 50 µL of washed Streptavidin Dynabeads (Invitrogen 11205D) for 30 min at RT. Folded RNA was mixed with pre-cleared lysates and incubated for 30 min at RT, and then 50 µL of washed beads were added to each binding reaction and further incubated at RT for 15 min. Beads were washed five times with the binding buffer, and boiled in 1× sample buffer for 10 min. The retrieved proteins were subjected to SDS-PAGE and further visualized by silver staining or WB.
Chromatin immunoprecipitation (ChIP)
PA1 cells with 80% cell confluency were cross-linked by 1% formaldehyde for 10 min at room temperature. Cross-linking was quenched by the addition of glycine to a final concentration of 0.25 M followed by incubation at room temperature for 5 min. After washing cells with cold DPBS three times, the PA1 cells were scratched and centrifuged at 1000 rpm for 5 min, the cell pellet was resuspended in 1 mL lysis buffer (50 mM Tris-HCl pH 8.0, 150 mM NaCl, 5 mM EDTA, 1% Triton X-100, 0.1% sodium deoxycholate) followed by sonication with S220 Focused-ultrasonicators (Covaris) to achieve 100–700 bp DNA fragments. After centrifugation at 16,000g for 10 min at 4°C, the supernatant was pre-cleared with 15 μL Dynabeads Protein G (Invitrogen) with 100 μg BSA and 50 μg ssDNA. Then the precleared lysates were incubated overnight at 4°C with 2 μg antibody. The beads were washed with 600 μL lysis buffer, 600 μL high salt wash buffer (1% Triton X-100, 0.1% sodium deoxycholate, 50 mM Tris-HCl at pH8.0, 0.5 M NaCl, 5 mM EDTA), 600 μL LiCl immune complex wash buffer (0.25 M LiCl, 0.5% Igepal, 0.5% sodium deoxycholate, 10 mM Tris-HCl pH 8.0, 1 mM EDTA) sequentially, followed by two washes with 600 μL TE buffer (10 mM Tris-HCl pH 8.0, 1 mM EDTA) at 4°C. The complex was eluted by adding 400 μL freshly prepared elution buffer (1% SDS, 0.1 M NaHCO3) with rotation at room temperature for 15 min. Then the reverse cross-linking was carried out by adding 16 μL 5 M NaCl and incubated at 65°C for 12 h, and then supplemented with 4 μL 0.5 M EDTA and 5 μL proteinase K (20 mg/mL) at 55°C for 10 h. DNAs were further purified by ChIP DNA Clean & Concentrator (Zymo Research D5205), and subjected to qPCR experiments with primers listed in Supplemental Table S2.
RNA FISH
The cells were previously coated on coverslips for at least 12 h. If there was only RNA for imaging, 3.6% paraformaldehyde (PFA) with 10% acetic acid was used to fix the cells for 10 min at room temperature. If both RNA and protein needed to be imaged, 4% PFA was used as fixation buffer. Cells were permeabilized in DPBS (Invitrogen 14190235) containing 0.5% Triton X-100 (ABCONE X10010) and 5 mM ribonucleoside vanadyl complex (NEB S1402S) for 10 min at 4°C, washed in DPBS for 3 × 5 min and rinsed once in wash buffer A prior to hybridization. Hybridization was carried out using 1 μL single molecule probes diluted into 10 μL hybridization buffer (Biosearch Technologies SMF-HB1-10) containing 10% formamide in a moist chamber at 37°C for 16 h. After hybridization, we gently transferred the cover glass, cells side up, to a fresh 6-well plate containing 1 mL of wash buffer A (Biosearch Technologies SMF-WA1-60) and washed the cells at 37°C for 30 min, then aspirated the wash buffer A, incubated with DAPI for 2 min at room temperature if necessary. Next, a second wash was performed at 37°C for 30 min by wash buffer A and 1 mL of wash buffer B was added and incubated at room temperature for 2–5 min. Finally, the samples were mounted in VECTASHIELD Antifade Mounting Medium (Vector Labs). smFISH probes are listed in Supplemental Table S1.
Immunofluorescence
The cells were previously coated on coverslips for at least 12 h. Four percent of PFA was used to fixed cells for 10 min at room temperature. Cells were permeabilized in PBS containing 0.5% Triton X-100 and 5 mM vanadyl ribonucleoside complex for 10 min at 4°C, then washed in DPBS 3 × 5 min, and blocked with 1% BSA for 30 min at room temperature. After that, cells were incubated with primary antibody for 1 h at room temperature. After washing with 1× DPBS three times, cells were incubated with fluorescent secondary antibodies (Jackson 115-545-166) were 1:1000 diluted in 1% BSA and incubated for 1 h at room temperature. Samples were washed three times by DPBS and then mounted in VECTASHIELD Antifade Mounting Medium (Vector Labs).
Widefield microscope
All widefield microscopy images were performed on a Delta Vision Elite imaging system equipped with a 60×/1.42 NA Plan Apo oil-immersion objective. Raw data of all presented figures were deconvoluted by softWoRx 6.5 using the enhanced ratio method.
Structured illumination microscopy (SIM)
All SIM experiments were performed on a DeltaVision OMX V4 system (GE HealthCare) equipped with a 60×/1.42 NA Plan Apo oil-immersion objective (Olympus) and six laser beams (405, 445, 488, 514, 568 and 642 nm; 100 mW) or a DeltaVision OMX SR system (GE HealthCare) equipped with a 60×/1.42 NA Plan Apo oil-immersion objective (Olympus) and four laser beams (405, 488, 568 and 642 nm; 100 mW). The microscope was routinely calibrated with a special image registration slide and the algorithm was provided by GE HealthCare. To obtain optimal images, immersion oil with refractive indices of 1.518 was used at room temperature. SIM image stacks were captured with a z-distance of 0.125 µm and with five phases, three angles, and 15 raw images per plane. The raw data were reconstructed with channel-specific OTFs, and a Wiener filter was set to optimum value by using softWoRx 6.5 package (GE HealthCare). Images were registered with alignment parameters obtained from calibration measurements with 100 nm diameter TetraSpeck Microspheres with four colors (molecular probes).
Image analysis
The proportion of SPAs and sno-lncRNAs in PWS bodies was determined using widefield microscopy images. Images were measured by Imaris using the surface building system. The proportion of the PWS body-localized lncRNAs was calculated by dividing the enriched lncRNA signals in the pre-snrpn territory (the marker of PWS bodies) to the total nuclear signals.
The analysis of the proportion of FUBP1, MYEF2, and HNRNPM colocalized with pre-snrpn was performed with widefield microscopy images. Images were measured by Imaris using the surface building system. We defined a surface to represent the pre-snrpn signal, and the intensity of the protein within this surface was referred to as I1. Next, we defined another surface to calculate the intensity of the protein across the entire nucleus and referred to as I2. The ratio I1/I2 indicates the proportion of the protein localized with pre-snrpn.
Analyses of the relative area and abundance of SPAs and pre-snrpn were performed with widefield microscopy images. Images were measured by Fiji/ImageJ.
Statistical analysis
The statistics in this study were presented as mean ± SD. Error bars represented SD in triplicate experiments if not mentioned otherwise. All P-values were calculated using a two-tailed unpaired Student's t-test; (*) P < 0.05, (**) P < 0.01, (***) P < 0.001, (****) P < 0.0001, (n.s.) not significant.
SUPPLEMENTAL MATERIAL
Supplemental material is available for this article.
ACKNOWLEDGMENTS
We thank the Chen lab members for critical discussion. This work was supported by the NSFC (32301079), the National Key R&D Program of China (2024YFC3405902), and the Shanghai Science and Technology Program (23ZR1470000) to H.W.; the Strategic Priority Research Program of the Chinese Academy of Science (XDB0570000) and the National Key R&D Program of China (2021YFA1100203) to L.-L.C. H.W. acknowledges the support from the Youth Innovation Promotion Association, CAS. L.-L.C. acknowledges the support from the Xplorer Prize and the New Cornerstone Science Foundation (NCI202232). L.-L.C. is a SANS Senior Investigator.
Footnotes
-
Article is online at http://www.rnajournal.org/cgi/doi/10.1261/rna.080341.124.
- Received November 27, 2024.
- Accepted March 17, 2025.
This article is distributed exclusively by the RNA Society for the first 12 months after the full-issue publication date (see http://rnajournal.cshlp.org/site/misc/terms.xhtml). After 12 months, it is available under a Creative Commons License (Attribution-NonCommercial 4.0 International), as described at http://creativecommons.org/licenses/by-nc/4.0/.




