


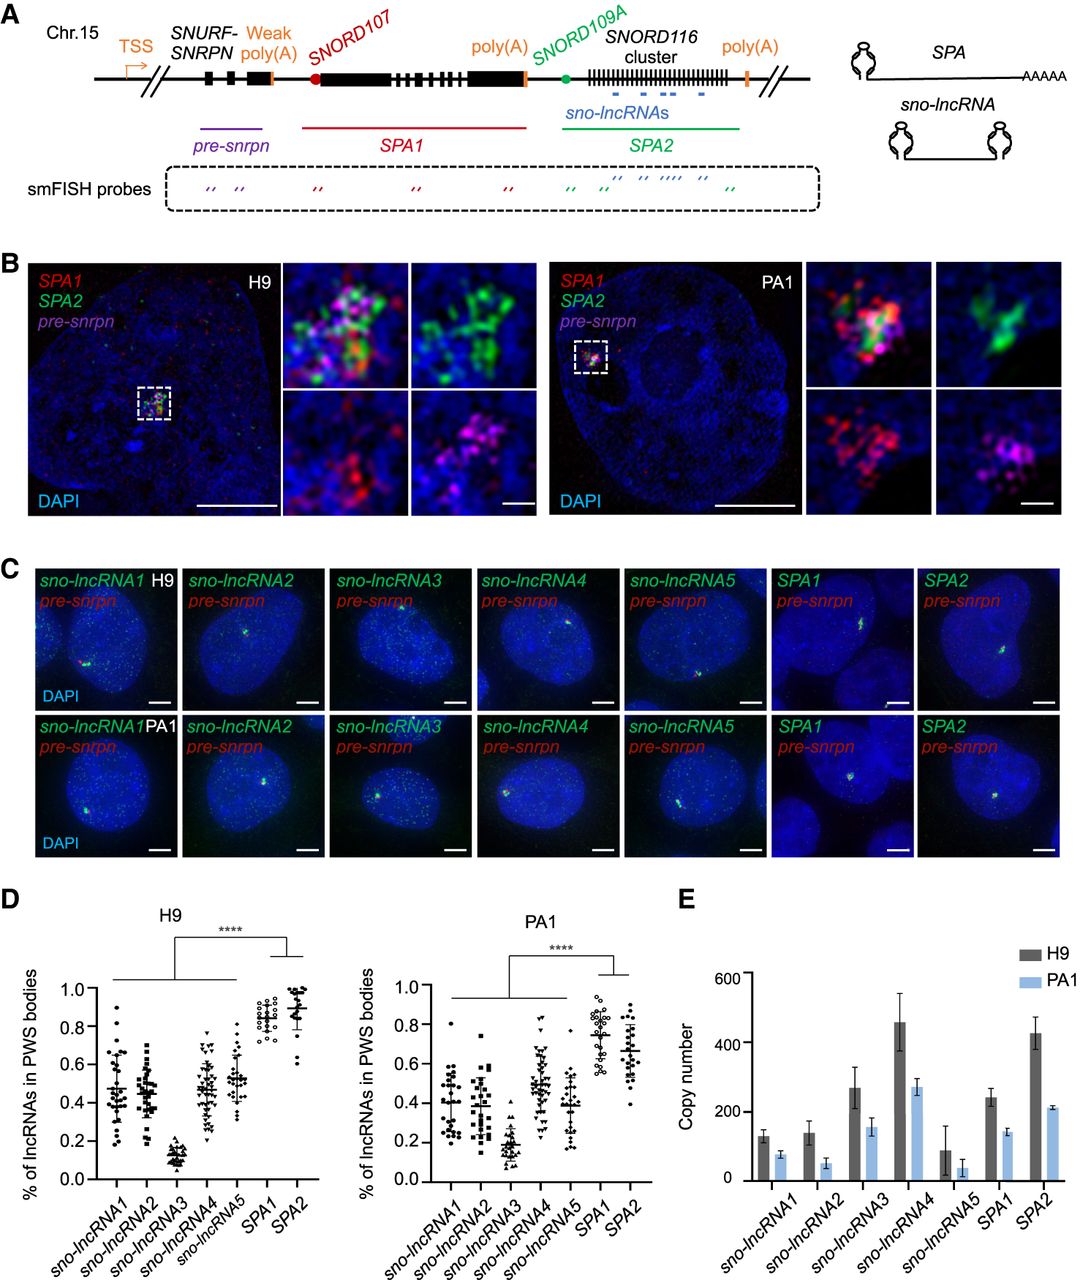
The localization pattern and relative abundance of the PWS region lncRNAs. (A, left) Schematic of the PWS region, including SNURF-SNRPN locus, SPAs and sno-lncRNAs. The exons are marked in black rectangles, the TSS and poly(A)s are marked in orange, and the snoRNA caps for SPAs are marked in red (SPA1) and green (SPA2) circles. The smFISH targeting regions of pre-snrpn, SPAs, and sno-lncRNAs are indicated. Specifically, the pre-snrpn is targeted to 5′ and middle region, SPAs are targeted to 5′, middle region, and 3′, and the sno-lncRNAs are targeted to the whole sequence. Probe sequences are listed in Supplemental Table S1. (Right) RNA structure of SPAs with snoRNA cap and poly(A) tail, and sno-lncRNAs with snoRNAs at both ends. (B) Representative RNA FISH images of SPAs in H9 and PA1 cells. Scale bar, 5 μm (uncropped) and 500 nm (cropped). (C) Representative RNA FISH images of sno-lncRNAs and SPAs in H9 and PA1 cells. Scale bar, 5 μm. pre-snrpn is stained as the marker of PWS bodies. (D) Percentage of the sno-lncRNAs and SPAs localized in the PWS bodies in H9 (left) and PA1 (right) cells. In H9 cells, n = 32 for sno-lncRNA1, n = 34 for sno-lncRNA2, n = 32 for sno-lncRNA3, n = 50 for sno-lncRNA4, n = 30 for sno-lncRNA5, n = 21 for SPA1, and n = 22 for SPA2. In PA1 cells, n = 28 for sno-lncRNA1, n = 28 for sno-lncRNA2, n = 27 for sno-lncRNA3, n = 49 for sno-lncRNA4, n = 30 for sno-lncRNA5, n = 26 for SPA1, and n = 25 for SPA2. (E) Copy number of sno-lncRNAs and SPAs in H9 and PA1 cells.




