


Context-dependent phosphorylation of CSDE1 drives interactions with ribosomes
- Annagiulia Ciocia1,
- Tanit Guitart1,
- Neus Mestre-Farràs1,
- Adrià Nogales1,4,
- Ivan Milenkovic1,
- Olga Coll1,
- Rebeca Medina1,
- Cristina Chiva1,2,
- Eduard Sabidò1,2,
- Eva Maria Novoa1,2,3 and
- Fátima Gebauer1,2
- 1Centre for Genomic Regulation (CRG), The Barcelona Institute of Science and Technology, Dr Aiguader 88, Barcelona 08003, Spain
- 2Universitat Pompeu Fabra (UPF), 08002 Barcelona, Spain
- 3ICREA, Barcelona 08010, Spain
- Corresponding author: fatima.gebauer{at}crg.eu
-
Handling editor: Javier Caceres
Abstract
The RNA-binding protein CSDE1 is a key regulator of mRNA stability and translation in a broad spectrum of biological processes. We have previously shown that CSDE1 functions as an oncoprotein promoting invasion and metastasis in melanoma, whereas it behaves as a tumor suppressor promoting cellular senescence in squamous cell carcinoma. The reasons underlying these context-specific behaviors are unknown. To identify melanoma-specific vulnerabilities, we have compared CSDE1 protein isoforms and post-translational modifications in melanoma cells, keratinocytes, and melanocytic cells of different tumorigenic potential. By combining long-read Nanopore sequencing with two-dimensional gel electrophoresis and transcriptome analysis, we identify one major isoform expressed in melanoma cells and patient samples. This isoform is phosphorylated early during cellular transformation, correlating with changes in its subcellular localization. We provide extensive interactome analysis of mammalian CSDE1, showing increased interactions with ribosomes in melanoma cells compared to healthy melanocytes. Importantly, interactions of CSDE1 with the ribosome are promoted by CSDE1 phosphorylation. Our data uncover a specific feature of melanoma cells that could be harnessed for therapeutic intervention.
Keywords
INTRODUCTION
RNA-binding proteins (RBPs) are master regulators of gene expression that control the fate of RNA along transcription, maturation, modification, intracellular localization, translation, and decay (Gerstberger et al. 2014; Gebauer et al. 2021). RBPs and protein partners are usually assembled in RNA ribonucleoprotein particles (RNPs) characterized by a high functional dynamism, as shown by the changing composition of proteins present on RNA along its life cycle and in response to external stimuli (Choi et al. 2024; Street et al. 2024). These changes allow adjustment of gene expression in time and space, in a highly context-dependent manner. RBP function can be regulated by a variety of post-translational modifications (PTMs) including phosphorylation, acetylation, and methylation, among others (Velázquez-Cruz et al. 2021). These PTMs often target regions directly involved in protein–protein or protein–RNA interactions, thereby affecting target recognition, RNP assembly, and RBP intracellular distribution or stability (Castello et al. 2016; Velázquez-Cruz et al. 2021). Considering the fundamental role of RBPs in remodeling gene expression, it comes as no surprise that RBP dysfunctions are linked to human disease (Gebauer et al. 2021).
Cold shock domain containing E1 (CSDE1), also known as upstream of N-Ras (UNR), is a highly conserved RBP whose dysregulation contributes to a variety of diseases, from cancer to neurodevelopmental disorders and cardiovascular pathologies (Guo et al. 2020; Ciocia et al. 2024). In cancer, CSDE1 displays context-specific functions. In melanoma, a highly aggressive tumor that arises from uncontrolled proliferation of skin melanocytes, CSDE1 functions as an oncoprotein. Mechanistically, CSDE1 promotes the translation of mRNAs encoding the epithelial-to-mesenchymal transition (EMT) factors VIM and RAC1 (Wurth et al. 2016), attenuates miRNA-mediated silencing of the TGF-β signaling regulator PMEPA1 (Kakumani et al. 2021), and contributes to immune escape of melanoma initiating cells by stabilizing the levels of PTPN2 mRNA, which encodes a STAT1 phosphatase (Lv et al. 2023). Similar to melanoma, CSDE1 performs tumor-promoting roles in some of the most prevalent cancer types including colorectal, breast, thyroid, and lung cancer (Chen et al. 2018; Martinez-Useros et al. 2019; Xie and Guo 2020; Yu et al. 2022; Ciocia et al. 2024). In sharp contrast, CSDE1 behaves as a tumor suppressor in squamous cell carcinoma (SCC) and neuroendocrine tumors (Fishbein et al. 2017; Avolio et al. 2022). In SCC, a tumor that originates from transformation of skin keratinocytes, CSDE1 promotes oncogene-induced senescence by repressing the translation of YBX1 mRNA and stabilizing transcripts encoding for senescence-associated secretory phenotype (SASP) factors (Avolio et al. 2022). The distinguishing features of CSDE1 that allow it to function as an oncogene or a tumor suppressor are poorly understood. In this work, we aimed to identify such features by analyzing CSDE1 in benign versus malignant contexts.
The human CSDE1 locus is highly complex, producing more than 50 transcript isoforms arising by alternative polyadenylation, splicing or promoter usage (https://www.ensembl.org), which can be potentially translated into five different protein isoforms containing a diversity of PTMs (Ciocia et al. 2024). However, the impact of CSDE1 alternative processing or modification in the onset and development of disease has not been previously addressed. We reasoned that different CSDE1 isoforms and/or PTMs, here collectively referred to as “proteoforms,” could be responsible for the disparities in CSDE1 behavior in cancer. To test this hypothesis, we used Nanopore sequencing, two-dimensional gel electrophoresis (2D-gel) and mass spectrometry–based proteomics to characterize CSDE1 proteoforms in keratinocytes, melanocytes, and melanoma cells. We found that cells of melanocytic origin express CSDE1 isoform 2, and that this isoform is phosphorylated in a manner that correlates with aggressiveness. We further identified the CSDE1 protein interactome in cells with different tumorigenic properties, and found enhanced interactions of CSDE1 with the ribosome in the melanoma context. These interactions are not mediated by translated mRNA and are promoted by CSDE1 phosphorylation. These results suggest that direct interactions of CSDE1 with the ribosome may shape the melanoma proteome, and highlight a novel vulnerability that may facilitate the design of therapeutic strategies to selectively target melanoma cells.
RESULTS
Identification of CSDE1 isoforms in keratinocytes and melanoma cells
To explore whether different CSDE1 isoforms were expressed in contexts where CSDE1 performed oncogene or tumor suppressor roles, we first performed western blot analysis of human melanoma SK-Mel-147 cells and primary mouse keratinocytes (PMKs). We used an affinity-purified polyclonal α-CSDE1 antibody developed in house, referred to as “PAN,” to potentially recognize all CSDE1 protein variants (Wurth et al. 2016). Two main isoforms were detected in both cell types, albeit with notable differences (Fig. 1A). In PMK, the two CSDE1 isoforms were expressed at comparable levels, while in melanoma cells the largest protein was significantly less abundant, and both proteins migrated faster than the equivalent species in PMK. The identity of these proteins as CSDE1 was confirmed by depletion (Supplemental Fig. S1A). To identify which CSDE1 isoforms corresponded to these bands, we used long-read Nanopore sequencing of cDNA obtained from poly(A)-enriched RNA in both cellular systems (with two biological replicates each). The CSDE1 gene contains 21 exons in both human and mouse, according to RefSeq annotation. Nanopore sequencing identified three transcripts generated by alternative splicing of exons 3 and 6, encoding distinct CSDE1 protein isoforms (Fig. 1B). Transcript variant 1 lacks exon 3 while it contains exon 6, and encodes a CSDE1 isoform containing nine intact cold shock domains (CSDs; isoform 1). Transcript variant 2 lacks both exons 3 and 6, and encodes a CSDE1 isoform with a partial deletion of CSD2 (isoform 2). Transcript variant 3 contains exon 3 but lacks exon 6; inclusion of exon 3 provides an alternative in-frame initiation codon yielding an N-terminally extended CSDE1 isoform that lacks part of CSD2 (isoform 3). Coverage of the transcript variants for mouse and human is shown in Supplemental Figure S1B and C, respectively. Interestingly, Nanopore data analysis showed that the relative proportion of these transcripts differed in keratinocytes and melanoma cells (Fig. 1C). Variant 3 was only expressed in keratinocytes in very low proportion, while variants 1 and 2 were expressed in both cell types although with distinct abundance, which highly correlated with those of the proteins detected by western blot (compare Fig. 1A and 1C). Facultative inclusion of exon 6, the major alternative splicing event detected in both systems, was confirmed by semiquantitative RT-PCR (Supplemental Fig. S1D). To confirm the identity of CSDE1 isoforms at the protein level, we generated an antibody against the peptide encoded by exon 6 and performed western blot of keratinocytes and melanoma cell extracts. The antibody indeed detected the largest CSDE1 protein variant (isoform 1) and, as expected, the signal disappeared upon depletion of the protein (Fig. 1D). From these data, we conclude that mouse keratinocytes express both CSDE1 isoforms 1 and 2, while human melanoma cells express mainly isoform 2.
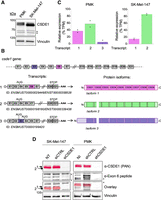
Identification of CSDE1 isoforms in PMK and melanoma cells. (A) Western blot analysis of CSDE1. Vinculin is shown as loading control. Asterisks denote nonspecific bands. (B) Schematic representation of Csde1 transcript variants identified by Nanopore sequencing (left) and corresponding encoded proteins (right). (E) Exon. Facultative exons are shown in color. CSD, cold shock domain. (C) Percentage of transcript expression as calculated from Nanopore data analysis (n = 2). TPM, transcripts per million. (D) Validation of CSDE1 isoform 1 by western blot with a specific antibody recognizing the exon 6–encoded peptide. The same membranes were stained with αCSDE1 “PAN” antibody and false colored to facilitate overlap visualization. Numbers on the left indicate CSDE1 isoforms, and asterisks denote nonspecific bands.
CSDE1 isoform expression in patient samples
We next examined the pattern of CSDE1 isoforms in patient samples. We analyzed the levels of CSDE1 transcripts using published RNA-seq data sets including melanocytes from healthy individuals, nevi, primary and metastatic melanoma from affected patients, some of which had been treated with MAPK inhibitors (Hugo et al. 2016; Kunz et al. 2018; Tang et al. 2020). The results showed that global CSDE1 mRNA levels dramatically increased in benign nevi and remained elevated in melanoma samples, suggesting transcriptional upregulation of CSDE1 during early cell transformation (Fig. 2A). Analysis of individual transcript isoforms in each sample group showed a more heterogeneous landscape in melanocytes with predominance of variant 2, which strongly increased in nevi and melanoma samples covering most of the detected reads (Fig. 2B). There was no difference after stratification of patients according to their genetic signatures. Samples characterized by a MITF signature, enriched in N-Ras mutations and resistant to BRAF/MEK inhibitors (labeled as “1”) show a similar overexpression of CSDE1 isoform 2 as samples characterized by an AXL signature, associated to wild-type BRAF profiles and resistant to PD-1 treatment (labeled as “2”). These analyses indicate that CSDE1 exon 6 is mostly excluded during melanoma carcinogenesis and confirm that isoform 2 is the predominant CSDE1 variant expressed in cells of melanocytic origin.
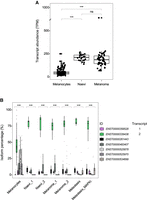
Analysis of CSDE1 transcript expression in melanoma patient samples. (A) Total CSDE1 mRNA levels in melanocytes, nevi, and melanoma samples. Transcript abundance is expressed in TPM (transcripts per million). Significance was assessed by t-test with Bonferroni correction (ns, not significant, ***P ≤ 0.001). (B) CSDE1 isoform expression stratifying samples according to two transcriptomic signatures (see main text for details). MAPKi, samples from patients treated with MAPK inhibitors. Transcript identities are indicated on the right. Significance was assessed with ANOVA (***P ≤ 0.001).
Regarding SCC, global levels of CSDE1 mRNA decreased in human cutaneous SCC compared to matched normal skin samples, as expected for a tumor suppressor, although the patient cohort was too small to reach significance (Supplemental Fig. S2A; Srivastava et al. 2022). The transcript encoding isoform 2 was predominantly expressed across conditions both in human and mouse samples, although that encoding isoform 1 was more highly expressed compared to melanoma, especially in mouse keratinocytes (Supplemental Fig. S2B; Chitsazzadeh et al. 2016; Srivastava et al. 2022). These data indicate that CSDE1 isoform expression is not a key difference between tumor promoting and suppressing contexts.
CSDE1 isoforms 1 and 2 show similar intrinsic tumorigenic potential
We next wondered whether CSDE1 isoforms show different tumorigenic potential. To this end, we followed a replacement strategy where we depleted endogenous CSDE1 from metastatic melanoma cells and overexpressed shRNA-resistant versions of isoforms 1 and 2, fused to GFP (Fig. 3A). Endogenous CSDE1 was efficiently depleted, and exogenous isoforms were expressed at similar levels (Fig. 3B). Both isoforms were predominantly expressed in the cytoplasm (Supplemental Fig. S3A). We then tested the capacity of these cells to resist anoikis and to grow as spheroids, two tumoral traits supported by CSDE1 (Wurth et al. 2016; Mestre-Farràs et al. 2022). We found that, indeed, depletion of CSDE1 decreased the anoikis resistance and 3D growth capacities of SK-Mel-147 cells (Fig. 3C, gray box plots). However, both isoforms were able to restore these capacities with no significant difference between the two protein variants (Fig. 3C, magenta and green box plots). Similar results were obtained for anoikis resistance of UACC-62 cells (Supplemental Fig. S3B,C). These data indicate that the context-specific roles of CSDE1 in cancer are not explained by differential expression of particular isoforms. This is further supported by the predominance of isoform 2 in healthy melanocytes and benign nevi (Fig. 2B), and in normal skin and SCC (Supplemental Fig. S2). We thus speculate that additional factors, such as context-induced PTMs and subsequent interactions with protein partners, could impinge on CSDE1 functions to promote melanoma progression.
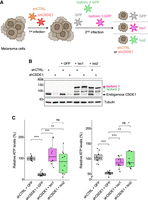
CSDE1 isoforms have similar intrinsic capacity to promote metastatic traits. (A) Scheme of the experimental workflow used to replace endogenous CSDE1 with its individual isoforms. (B) Representative western blot showing expression of endogenous and exogenous CSDE1 isoforms. Tubulin is shown as loading control. (C) Effects of CSDE1 isoform expression on anoikis resistance (left) and spheroid growth (right) in SK-Mel-147 cells. Boxplots show the results of two biological replicates, each with five technical replicates. Values are normalized to the average of the shCTRL + GFP samples. Significance was assessed by t-test (*P ≤ 0.05, **P ≤ 0.01).
CSDE1 isoform 2 is phosphorylated in melanoma cells
To gain insight into the proteoform landscape of CSDE1 (i.e., PTMs on individual isoforms), we performed two-dimensional (2D)-gel electrophoresis of melanoma cell and keratinocyte extracts. In 2D-gels, proteins are separated first according to their isoelectric point and then according to their molecular weight, resulting in resolution of each isoform into individual species containing distinct PTM landscapes and visualized as single dots. 2D-gel analysis showed substantial differences between CSDE1 proteoform patterns in melanoma versus keratinocytes (Fig. 4A, see graphical representation in Fig. 4B). To shed light on the underlying differences, we next focused on phosphorylation, as melanoma is the second most mutated cancer at phosphorylation sites in RBPs (England et al. 2022), and considering its relevance in regulating RBP activity and oncogenic traits (Singh et al. 2017). To test whether CSDE1 was phosphorylated in melanoma and/or keratinocytes, we treated cell extracts with lambda phosphatase without (PP) or with (PP + I) phosphatase inhibitors to ensure that the observed differences were due to dephosphorylation. We followed the efficiency of phosphatase treatment by monitoring the dephosphorylation of the C-terminal domain of RNA polymerase II using western blot (Fig. 4C). We found that, unlike keratinocytes, the proteoform pattern of CSDE1 in melanoma cells changed upon phosphatase treatment (Fig. 4D, see quantification at the bottom). These results indicate that CSDE1 is phosphorylated in melanoma cells.
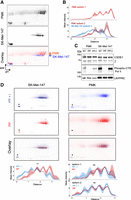
CSDE1 is phosphorylated in melanoma. (A) Analysis of CSDE1 proteoforms in PMK and SK-Mel-147 cells using 2D-gel separation followed by immunoblotting with αCSDE1 “PAN” antibody. Overlay of false colored membranes is shown at the bottom. Asterisks denote nonspecific bands that are used as landmarks to overlay different membranes. (B) Graphical representation of results in A. Plots represent density curves of overlaid blot intensities (n = 3). The solid line shows the mean signal intensity, and the shaded area represents the full range (minimum to maximum) across replicates. (C) Western blot to monitor phosphatase treatment efficiency. Phosphorylation levels of the RNA Polymerase II CTD Ser2 are shown as control of efficient dephosphorylation. LRPPRC is shown as loading control. (NT) Not treated, (PP) lambda phosphatase-treated, (PP + I) phosphatase-treated plus phosphatase inhibitors. (D) CSDE1 proteoforms upon treatment with phosphatase with and without phosphatase inhibitors in SK-Mel-147 cells (left) and PMK (right). Density plots are shown at the bottom. Differences between profiles (n = 3 for SK-Mel-147; n = 2 for PMK) were assessed using repeated measures ANOVA (***P ≤ 0.001; ns = not significant).
We next analyzed CSDE1 proteoforms in primary melanocytes, immortalized melanocytic cells (Mel-ST), and a panel of metastatic melanoma cell lines. As expected, isoform 2 was the major isoform expressed in all instances (Fig. 5A). Interestingly, CSDE1 proteoforms showed a shift in isoelectric point already in Mel-ST cells relative to primary melanocytes, and this change was maintained in all metastatic melanoma cell lines analyzed, suggesting that modification of CSDE1 takes place early during transformation (Fig. 5B, see graphical representation at the bottom). To test whether this shift was due to phosphorylation, we compared the pattern of SK-Mel-147 melanoma cells after phosphatase treatment with that of untreated melanocytes. We found that treatment of melanoma cell extracts with phosphatase yielded a CSDE1 proteoform pattern indistinguishable from that of untreated melanocytes (Fig. 5C, see quantification at the bottom). These results identify CSDE1 phosphorylation as a critical difference between melanocytes and immortalized/tumoral cells, and raise the possibility that this modification promotes CSDE1 oncogenic functions.
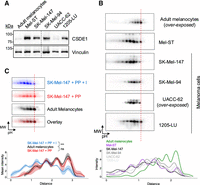
Analysis of CSDE1 phosphorylation in melanoma cell lines. (A) Western blot of CSDE1 in melanocytes, immortalized Mel-ST cells, and a panel of metastatic melanoma cell lines. Vinculin is shown as loading control. (B) 2D-gel analysis of CSDE1 proteoforms of the cell lines in A. The vertical dashed line is traced through the most basic CSDE1 proteoform in order to facilitate visualization. Density plots are shown at the bottom. (C) CSDE1 phosphorylation correlates with malignancy. Dephosphorylated melanoma CSDE1 fully overlays with untreated melanocytes. A vertical dashed line is drawn to facilitate visualization. Membranes have been false colored to facilitate comparison. Density plots and quantification are shown at the bottom (n = 3). Statistical significance was assessed using mixed ANOVA (***P ≤ 0.001; ns = not significant).
Enhanced interactions of CSDE1 with the ribosome in melanoma cells
CSDE1 is considered an adaptor that facilitates the formation of diverse regulatory complexes on mRNA (Guo et al. 2020; Ciocia et al. 2024). To understand whether differential complex formation could explain the oncogenic functions of CSDE1, we identified the CSDE1 protein interactome in primary adult melanocytes, immortalized Mel-ST cells, and metastatic SK-Mel-147 cells. We used immunoprecipitation (IP) of CSDE1 followed by identification of associated proteins using mass spectrometry (LC-MS/MS), carrying IgG as negative control and performing in parallel RNase I treatment, in order to distinguish direct versus RNA-mediated interactions (three replicates per condition).
CSDE1 interactors were identified by significant analysis of interactome (SAINT) (Teo et al. 2014) comparing samples not treated with RNase I over the IgG controls with a Bayesian false discovery rate (BFDR) < 0.05. We detected 57, 142, and 125 CSDE1 interactors in melanocytes, Mel-ST, and SK-Mel-147 cells, respectively (Fig. 6A; Supplemental Table S1). Of these, three, 20, and 18 interactors were enriched over the respective RNase I-treated samples, indicating RNA-dependent interactions (Supplemental Table S1). Notably, the majority of CSDE1 interactors are RBPs, which constitute 76% of all CSDE1 protein partners (Supplemental Table S1). Strikingly, there was a very modest overlap between adult melanocytes and the other two cell lines, and only five proteins were found to interact with CSDE1 in all conditions: IGF2BP3, HSPA9, ZNF787, MVP, and STRAP, a known CSDE1 interactor (Fig. 6A; Supplemental Table S1; Moore et al. 2018). These results suggest fundamentally different functions of CSDE1 in healthy melanocytes versus transformed cells. Interactors found exclusively in melanocytes were enriched in Gene Ontology (GO) annotations associated with regulation of the cell cycle, while Mel-ST unique interactors were enriched in cytoskeleton-related terms (Fig. 6B). Importantly, interactors found in SK-Mel-147 cells, whether unique or common with Mel-ST, were enriched for ribosome and translation-related terms (Fig. 6B). Indeed 58% of the proteins common to SK-Mel-147 and Mel-ST cells were ribosomal proteins (RPs) that engage in interactions with CSDE1 independently on translated mRNA, as the interactions were resistant to RNase I digestion (Fig. 6A; Supplemental Table S1). In addition, ribosome-associated proteins (RAPs) constituted 33% of this common pool, making a total of 91% of common interactors directly related to the ribosome (Supplemental Table S1; Simsek et al. 2017; Bartsch et al. 2023; Susanto et al. 2024).
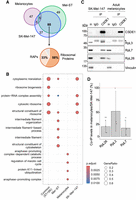
CSDE1 interacts with ribosomes in melanoma cells. (A) Venn diagram showing the overlap of CSDE1 interactors identified in cells of melanocytic origin (n = 3 per cell type). RAPs, ribosome associated proteins. (B) GO term categories of CSDE1 interactors. (C) Validation of ribosome interactions by independent IP followed by western blot. Vinculin is shown as loading control, and the asterisk denotes signal from IgG. (D) Quantification of coimmunoprecipitations in C. Ribosomal protein (RP) values are corrected for CSDE1 IP efficiency and vinculin-normalized RP input, and referred to the values obtained in SK-Mel-147 cells (n = 3). Error bars represent standard deviation. Significance was assessed by Student's t-test (*P ≤ 0.05, **P ≤ 0.01).
Moreover, RPs and RAPs represented the totality of the SK-Mel-147-unique set and 85% of the Mel-ST-unique group, while this proportion dropped to 30% in the melanocyte-unique group. These results suggest dramatically enhanced interactions of CSDE1 with the ribosome in melanoma cells compared to healthy melanocytes. The results were validated in independent IP experiments (Fig. 6C, see quantification of triplicate experiments in Fig. 6D).
Localization of CSDE1 to membranes correlates with cell malignancy
As localization of RBPs may affect their functions, we analyzed whether CSDE1 is differentially localized in melanocytes, Mel-ST and SK-Mel-147 melanoma cells. Cell fractionation indicated a primarily cytosolic localization of CSDE1 in all cell types, with a weak localization to membranes in Mel-ST that increased in melanoma cells (Fig. 7A,B, see controls of correct fractionation in Supplemental Fig. S4). To understand which membranous organelles CSDE1 colocalizes with in melanoma cells, we performed immunofluorescence using two different α-CSDE1 antibodies (Abcam ab201688 and our “PAN” antibody) and markers of major membranous compartments including the endoplasmic reticulum (ER), the Golgi apparatus, and endosomal vesicles. Independently of the α-CSDE1 antibody used, we found extensive colocalization of CSDE1 with the ER marker HSP47, partial colocalization with the endosomal compartment marker CD63, and no colocalization with the Golgi marker Giantin, as shown by cross-correlation (CCF) and Manders coefficients (Fig. 7C,D; Manders et al. 1992; Van Steensel et al. 1996). Together with the results above, these data suggest that CSDE1 may interact with ribosomes residing on the ER.
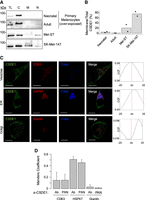
CSDE1 localizes with membrane compartments in melanoma cells. (A) Fractionation of CSDE1 in melanocytes (neonatal or adult), immortalized Mel-ST cells, and metastatic melanoma cells. (TL) Total lysate, (C) cytosol, (M) membranes, (N) nucleus. (B) Quantification of CSDE1 levels in membranes (n = 2). CSDE1 amounts in the membrane and total fractions were corrected by an internal control (HSP47 levels) and expressed as percentage of total CSDE1. (C) CSDE1 colocalization with membrane compartments assessed by confocal microscopy. Typical images obtained with the Abcam (ab201688) αCSDE1 antibody are shown. Scale bar, 10 µm. The Van Steensel cross-correlation coefficient (CCF) is shown on the right. (D) The Manders coefficient for colocalization of CSDE1 and the indicated markers using both the Abcam (ab201688) and “PAN” αCSDE1 antibodies. Bars represent the average of five cells, and error bars represent standard deviation.
Phosphorylation promotes binding of CSDE1 to the ribosome
To understand the functional consequences of CSDE1 phosphorylation, we tested its relevance on interactions with the ribosome. We performed IP of CSDE1 from SK-Mel-147 cell extracts, either after treatment with phosphatase (PP) or with phosphatase plus inhibitors (PP + I) and analyzed the levels of associated ribosomal proteins as well as STRAP. Interestingly, while the binding of STRAP was unaffected by CSDE1 dephosphorylation, the association with ribosomal proteins decreased substantially (Fig. 8A, see quantification of triplicate experiments in Fig. 8B).
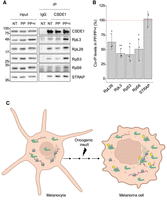
CSDE1 phosphorylation promotes interactions with the ribosome. (A) Co-IP of CSDE1 with ribosomal proteins in SK-Mel-147 lysates treated with phosphatase (PP) or with phosphatase in presence of inhibitors (PP + I). IgG was used as negative control. (NT) Not treated. (B) Quantification of RP coimmunoprecipitation. Values were corrected for CSDE1 IP efficiency and plotted relative to the levels in the PP + I condition (dashed line). Bar graphs represent the average of three independent experiments, and error bars indicate standard deviation. Significance was assessed by Student's t-test (*P ≤ 0.05, **P ≤ 0.01). (C) Model resulting from this work. CSDE1 isoform 2 (green) is expressed at low levels in normal melanocytes. Upon cell transformation, CSDE1 levels dramatically increase, concomitant with phosphorylation (yellow spheres), resulting in enhanced interactions with the ribosome and association to the ER (black arrows).
Taken together, our results agree with a model in which CSDE1 isoform 2 is expressed at low levels in normal melanocytes. Following oncogenic transformation, CSDE1 is upregulated and phosphorylated, leading to increased interactions with the ribosome, possibly at the ER, influencing the metastatic capacity of melanoma cells (Fig. 8C).
DISCUSSION
CSDE1 is an important modulator of mRNA stability and translation in crucial biological processes such as embryonic development, stem cell differentiation, neural cell migration, EMT, cellular senescence, and apoptosis, among others (Dormoy-Raclet et al. 2007; Elatmani et al. 2011; Kobayashi et al. 2013; Wurth et al. 2016; Ju Lee et al. 2017; Saltel et al. 2017). Related to these functions, CSDE1 alterations are associated to human disease, from cardiovascular and neurodevelopmental disorders to cancer (Guo et al. 2020; Ciocia et al. 2024). Here we provide the first analysis of CSDE1 proteoform expression in a biological system. Coupled with interactome determination, we identify CSDE1 phosphorylation as a modification that promotes interactions with the ribosome and may lay at the basis of context-specific behaviors of CSDE1 in cancer.
CSDE1 isoforms 1 and 2 are expressed in PMK and melanoma cells, with a predominance of the latter in melanoma. Upregulation of CSDE1 mRNA in nevi is explained by the predominant expression of variant 2, without any relevant expression of the other variants, excluding CSDE1 isoform switch during melanoma formation and progression. The two CSDE1 isoforms identified in this study differ in the length of the cold shock domain 2 (CSD2), resulting from alternative inclusion of exon 6 in their corresponding transcripts. CSD2 is a noncanonical cold shock domain that cannot directly bind RNA as it lacks RNP-motifs. However, changes in CSD2 could promote structural rearrangements affecting CSDE1 interaction with RNA targets or protein partners, potentially resulting in differential functions of the two isoforms (Hollmann et al. 2020). We find, nevertheless, that the two protein variants have similar intrinsic capacities to promote tumoral traits, such as resistance to anoikis and spheroid growth.
What could explain, then, the capacity of CSDE1 to act as a tumor suppressor or as an oncogene? We found that the CSDE1 proteoforms in benign (PMK, melanocytes) versus malignant (melanoma) contexts are different, with phosphorylation representing a critical distinction. Phosphorylation may in principle modulate the formation of specific complexes on mRNA and, thus, dictate regulatory outcomes. It is noteworthy that CSDE1 binds to a highly overlapping set of transcripts in melanoma cells and PMK, yet with distinct functional outcomes (Wurth et al. 2016; Avolio et al. 2022; Ciocia et al. 2024). For instance, CSDE1 binding to RAC1 mRNA increases its translation in melanoma cells, while it has no effect in PMK. Similarly, CSDE1 stabilizes SASP factor mRNAs in PMK, but binding to these mRNAs has no consequence in melanoma (Wurth et al. 2016; Avolio et al. 2022). These results indicate that RNA-binding per se is not sufficient to explain the functions of CSDE1, and that additional features such as the formation of specific regulatory protein complexes might be important. In this respect, the vast majority (76%) of CSDE1 interactors are other RBPs, suggesting a high potential of CSDE1 as an RNP adaptor. There is a large difference between interactors detected in melanocytes and those in immortalized or malignant cells, with a cell type–specific enrichment in GO terms that suggest remodeling of CSDE1 functions during melanoma progression, from cell cycle regulation in healthy melanocytes to intermediate filament organization and translational control in melanoma. Reprogramming of CSDE1 functions is further supported by the restricted overlap of proteins in melanocytes compared to the other two cell types. Only five proteins—most of them RBPs—are found in all conditions, including STRAP, HSPA9, ZNF787, MVP, and IGF2BP3. STRAP is a well-known CSDE1 interactor that confirms the validity of our proteomics data (Hunt et al. 1999; Booy et al. 2018; Moore et al. 2018; Turner et al. 2022; Chen et al. 2025). HSPA9, also known as mortalin, is a protein chaperone that promotes tumor growth and metastasis (Albakova et al. 2022). MVP is a major component of vault RNPs, involved in protection against a variety of cellular stresses and in multidrug resistance (Maniatis et al. 2025). ZNF787 is a poorly characterized transcription factor, while IGF2BP3 is an extensively studied m6A reader involved in tumor initiation and progression (Zhu et al. 2023). These interactors suggest that CSDE1 contributes to cancer progression by multiple mechanisms. A central one, however, is translational control as a large proportion of CSDE1 interactors in melanoma cells are ribosomal proteins, and binding to these is enhanced by phosphorylation. How mechanistically CSDE1 controls ribosome function (e.g., to promote translation elongation of RAC1 mRNA) remains an open question. It is noteworthy that no translation elongation factor is found among CSDE1 interactors. Although interactions with elongation factors could be transient or mRNA-specific, making their detection difficult, our results suggest alternative mechanisms that await further elucidation.
Phosphorylation has been shown to control not only RBP-protein interactions, but RBP intracellular localization, stability, or condensation properties (Velázquez-Cruz et al. 2021). We noticed that phosphorylation correlates with increased localization of CSDE1 to membrane compartments including the ER and endosomal or lysosomal vesicles. This raises the intriguing possibility that CSDE1 interacts with ribosomes on the ER, influencing the synthesis of membrane and secretory proteins with consequences for metastasis.
CSDE1 is a complex gene potentially subject to multiple forms of regulation (Anderson and Catnaigh 2015). CSDE1 undergoes a strong overexpression at the mRNA level in benign nevi, suggesting transcriptional upregulation in agreement with a recent report showing epigenetic activation of the CSDE1 locus by SMYD3-mediated trimethylation (Lv et al. 2023). Epigenetic mechanisms alone, however, do not suffice to explain the tumor-promoting activities of CSDE1, because this protein is already highly expressed in nevi and immortalized, nonmetastatic Mel-ST cells, as we have shown in this work. Our results suggest that phosphorylation of CSDE1 might represent a contributing factor occurring early during the transformation process and is important for translation reprogramming and metastasis. The relationship between CSDE1 phosphorylation, intracellular distribution, translational control, and metastasis warrants further investigation in melanoma and other widespread cancer types in which CSDE1 functions as an oncogene and will be central topics of our future research.
MATERIALS AND METHODS
Plasmids and cloning
pTRIPZ lentiviral constructs expressing a doxycycline-inducible nontargeting (shCTRL #RHS4743) or CSDE1 short-hairpin (shCSDE1 #RHS4696-200681476) were obtained from Horizon Discovery. Sh-resistant versions of CSDE1 isoform 1 or 2 containing the sequence 5′-GAGATGACGTCGAGTTTGA-3′ in the shRNA targeting region (Wurth et al. 2016) were cloned in pWPI-EmGFP.
Cell culture
Melanoma SK-Mel-147, SK-Mel-94, UACC-62, 1205-LU cells, and 293-T cells were provided by Maria S. Soengas (CNIO). Cells were authenticated using the GenePrint 10 System. Melanoma cells were cultured in DMEM-glutamax (Gibco), with 10% heat-inactivated fetal bovine serum (FBS; Gibco) and 1% penicillin–streptomycin (Gibco). Mel-ST cells (from Corine Bertolotto, INSERM) were grown in 7% FBS. Human primary neonatal melanocytes (from Maria S. Soengas, CNIO) were cultured in 254CF medium (Gibco) with 0.2 mM CaCl2, human melanocyte growth supplement (Gibco), and 0.5% penicillin–streptomycin. Human primary adult melanocytes (ATCC, #PCS-200-013) were grown in dermal cell basal medium (ATCC) with adult melanocyte growth kit (ATCC) and 0.1% penicillin–streptomycin. Primary mouse keratinocytes (PMK) were isolated from the skin of newborn C57BL/6J mice and maintained as previously described (Avolio et al. 2022). 293T-based Phoenix Ecotropic (E) packaging cells were cultured in DMEM as previously reported (Ritschka et al. 2017). Cells were tested for Mycoplasma infection.
Total RNA extraction and poly(A) RNA selection
Maxwell kit (Promega) was used to extract RNA according to the manufacturer's instructions. Total RNA was incubated with Turbo DNA-free kit (Invitrogen) adding RNase OUT (Invitrogen) and cleaned up with AMPure XP beads (Agencourt) according to the manufacturer's specifications. Poly(A) selection was performed using Oligo(dT)25 Dynabeads (Invitrogen) as previously described (Milenkovic et al. 2023).
Nanopore direct cDNA sequencing
cDNA synthesis, end-prep processing, barcoding, and adapter ligation were performed as described in Milenkovic et al. (2024). Fifty nanograms of cDNA was sequenced on a MinION R9.4.1 (flow cell type #FLO-MIN106, sequencing kit #SQK-DCS109, barcoding expansion kit #EXP-NBD104). Data were analyzed with Nextflow Master of Pores 3 (Cozzuto et al. 2020) with Guppy 3.6.1 for sequencing basecalling and demultiplexing, minimap2 2.14 for mapping to the GRCm38 and GRCh38 genomes, and IsoQuant 3.0 for isoform quantification (Prjibelski et al. 2023). Only nonambiguous CSDE1 reads were kept, and isoform misassignments were manually corrected.
Bioinformatic analysis of patient and mouse samples
Previously published RNA-seq data from melanocytes and melanoma patient samples (Hugo et al. 2016; Kunz et al. 2018; Tang et al. 2020), as well as from SCC patients and mouse samples (Chitsazzadeh et al. 2016; Srivastava et al. 2022), were analyzed with the nf-core/rnaseq pipeline v3.8.1 with star_rsem option and GRCh38 genome for human samples or GRCm39 genome for mouse samples (https://doi.org/10.5281/zenodo.6579838). TPM (transcripts per million) and isoform percentage were taken from RSEM output (Li and Dewey 2011).
Semiquantitative PCR
RNA was retrotranscribed and cDNA amplified by PCR using primers flanking mouse and human CSDE1 exon 6 (Exon5_FW: ATGATGTTGAATTTGAAGTATCATC, Exon7_RV: TTTTATCTCCAGTTTCCAGC).
Viral infections
PMKs were infected with retroviral particles produced in Phoenix E cells after calcium phosphate transfection with either pLMP-IRES-GFP-shCTRL or pLMP-IRES-GFP-shCSDE1, as previously described in Avolio et al. (2022).
Lentiviral particles were produced in 293T cells as previously described in Mestre-Farràs et al. (2022). For CSDE1 expression, SK-Mel-147 cells already infected with shCTRL or shCSDE1 were incubated with viral supernatants overnight twice. Selection was carried out with 1 µg/mL of puromycin. CSDE1 isoform replacement in UACC-62 cells was performed similarly, except that cells were first infected with CSDE1-EmGFP expressing constructs and sorted by FACS to select GFP-positive cells. For GFP sorting, either PMK or UACC-62 cells were trypsinized and resuspended in media containing DAPI at 1 μg/mL. Sorting was performed at the CRG/UPF FACS Unit.
CSDE1 transient depletion
Reverse transfection of SK-Mel-147 cells was performed with siRNA pools (siTOOLs Biotech, #7812-csde1) at a final concentration of 3 nM according to the manufacturer's instructions. Cells were collected for analysis after 3 days.
Anoikis resistance and 3D growth assays
One thousand cells were seeded in flat ultralow attachment plates (Corning) in media containing 1% FBS for anoikis resistance, or in round ultralow attachment plates (Corning) in complete media for 3D growth assays. At day 0 (input) and after 7 days, cell survival was quantified using CellTiter-Glo (Promega) according to the manufacturer's instructions. The signal was quantified in a Berthold LB 960 luminometer and normalized for input (values at time zero). Additionally, spheroids were visualized with bright field microscopy.
Cell protein extracts
Protein extracts were obtained by cell lysis and homogenization in RIPA buffer as described in Mestre-Farràs et al. (2022) or with HNTG buffer as in Wurth et al (2016). Cell extracts for Lambda Protein Phosphatase treatment were prepared in lysis buffer (50 mM HEPES pH 7.4, 100 mM NaCl, 2 mM DTT, 1% NP-40, and 1 mM MnCl2, supplemented with 1× PIC), and cells were sonicated using a bioruptor (Diagenode) for three cycles of 30 sec, level high at 4°C prior to centrifugation.
Cell fractionation
Fractionation was based on sequential detergent extraction on ice (Jagannathan et al. 2011). In brief, cells were incubated with 1 mL of permeabilization buffer for 5 min to collect the cytosolic fraction and then incubated with 1 mL of lysis buffer for 5 min to collect the membrane fraction. The remaining cell content was scraped in RIPA buffer to collect the insoluble/nuclear fraction.
Lambda protein phosphatase treatment
Protein samples were incubated with the phosphatase inhibitors NaF (20 mM) and sodium pyrophosphate (25 mM) for 10 min on ice, or not incubated. Samples were treated with Lambda phosphatase (New England Biolabs) using 400 enzyme units for 50 µL reaction in PMP NEB buffer and 10 mM MnCl2 at 30°C for 30 min.
Western blot
Proteins were resolved by SDS-PAGE in Laemmli buffer (25 mM Tris-base, 250 mM glycine, and 1% SDS) and transferred to nitrocellulose or PVDF membranes (Amersham). Primary antibodies were incubated overnight at 4°C and secondary antibodies for 1 h at room temperature (see Supplemental Table S2 for antibody details).
Immunofluorescence
SK-Mel-147 cells grown on coverslips were fixed with PBS-4% paraformaldehyde (ChemCruz) and permeabilized with PBS-0.1% Triton X-100. Slides were incubated with primary antibody at 4°C overnight, with secondary antibody for 1 h (Supplemental Table S2) and with DAPI (5 µg/mL) for 10 min. Coverslips were mounted in Fluoromount-G (SouthernBiotech). Confocal imaging was performed with a Leica TCS SP5 II CW-STED inverted confocal microscope (Leica) using a 100× Oil/numerical aperture 1.4 objective lens. Z-stack pictures that represent the whole cell were obtained using LAS AF Leica software (20–40 slices per cell) and processed using Image J. Colocalization was assessed with the Manders coefficient (Manders et al. 1992) and the Van Steensel cross-correlation coefficient (CCF) (Van Steensel et al. 1996), calculated using the JaCoP plug-in (Bolte and Cordelières 2006). Five cells were analyzed per condition.
Two-dimensional (2D)-gel electrophoresis
Protein extracts in RIPA were precleaned with 2D Clean-Up Kit (GE Healthcare) and precipitated according to the manufacturer's specifications. Protein pellets were resuspended in sample loading solution (7 M urea, 2 M thiourea, 4% CHAPS, 20 mM DTT, 0.5% immobilized pH gradient [IPG] buffer pH 4–7, GE Healthcare and 0.002% bromophenol blue), and loaded in the focusing tray of a PROTEAN i12 IEF System (Bio-Rad). IPG strips (pH 4–7, Bio-Rad) were rehydrated for 12 h at 20°C and 50 V, followed by isoelectric focusing (IEF) at 4000 V, incubated in equilibration buffer (100 mM Tris-HCl pH 8, 6 M urea, 30% glycerol, 2% SDS, and 0.002% bromophenol blue) supplemented with 5 mg/mL DTT for 15 min and then in equilibration buffer supplemented with 22 mg/mL iodoacetamide (Sigma-Aldrich) for 15 min. Strips were rinsed in Laemmli buffer, and proteins resolved by SDS-PAGE. 2D-gel profiles were quantified with the Fiji tool “Plot profile.” The area under the curve of the four main peaks was calculated, and significant differences were determined using ANOVA as indicated in the figure legends.
Immunoprecipitation (IP)
Cell extracts prepared in HNTG buffer were precleared by empty Protein-A Dynabeads (Invitrogen) incubation for 30 min at 4°C. α-CSDE1 antibody made in-house (“PAN” antibody, Wurth et al. 2016) or rabbit IgG were coupled to beads for 30 min at RT. Precleared extracts were then recovered and incubated in IPP150 buffer (20 mM HEPES pH 7.9, 150 mM NaCl, 1.5 mM MgCl2, 0.5 mM DTT, and 0.05% NP-40, 1× PIC) overnight with antibody-coupled beads at 4°C. Proteins were eluted with SDS loading buffer.
CSDE1 protein interactome identification
CSDE1 IPs were performed using 700 μg of SK-Mel-147 and Mel-ST extracts, or 2000 μg of adult melanocyte extracts, with 10 µg antibody and 50 µL Dynabeads. Following IP, half of the beads were incubated with RNase I (Ambion AM2294) in IPP150 buffer at 25°C for 15 min. Beads were resuspended in 6 M urea in 200 mM ammonium bicarbonate (ABC) for protein denaturation. Proteins were reduced adding 10 mM DTT in 200 mM ABC and incubated for 1 h at 37°C, alkylated with iodoacetamide (20 mM IAM, at RT for 30 min in the dark), digested with trypsin at 37°C, and acidified to 10% formic acid. Samples were desalted using an Ultra MicroSpin column (The Nest Group Inc.), evaporated, and resuspended in MilliQ water. Peptide mixture was analyzed by LC-MSMS using a 1 h gradient in LTQ Orbitrap XL (for SK-Mel-147 and Mel-ST cells) or Orbitrap Lumos (for melanocytes). For analysis, Proteome Discoverer software with the search algorithm Mascot v2.6 against SwissProt Human database was used. Peptides with an FDR lower than 1% were retained. Protein–protein interactions were assessed using SAINTexpress (Teo et al. 2014). To detect RNA-dependent interactions, a beta-binominal test was conducted. RBPs were assessed based on RBPbase (Gebauer et al. 2021). Gene Ontology terms of differential interactors were retrieved with clusterProfiler (Liao et al. 2014).
DATA DEPOSITION
Nanopore sequencing data are available in GEO under ID: GSE292019. The mass spectrometry proteomics data have been deposited to the ProteomeXchange Consortium via the PRIDE partner repository with the data set identifier PXD062774. Data from melanocytes of healthy patients were downloaded from the dbGaP website under phs001979.v1.p1. Data from patients with nevi, primary melanoma, metastatic melanoma, and cutaneous squamous cell carcinoma with paired normal controls were downloaded from the Sequence Read Archive (SRA) under accession numbers GSE112509, GSE78220, and GSE191334. Data from mouse tissues were downloaded from SRA under accession number GSE84194.
SUPPLEMENTAL MATERIAL
Supplemental material is available for this article.
ACKNOWLEDGMENTS
We thank Maria S. Soengas (CNIO, Spain) and Corine Bertolotto (C3M, France) for cell lines. We acknowledge Anna Ribó for technical assistance. We are grateful to the CRG Core Technologies Programme for their support. This publication is based on research supported by the Melanoma Research Alliance award (https://doi.org/10.48050/pc.gr.143718) (Established Investigator Award 826530) to F.G., the Spanish Ministry of Science and Innovation (MCIN) (grants PID2021-127948NB-I00 to F.G. and PID2021-128193NB-I00 to E.M.N. funded by MCIN/AEI/10.13039/501100011033/FEDER, UE), the European Union's Horizon Europe (ERC Starting Grant 101042103 to E.M.N.), and the Departament de Recerca i Universitats de la Generalitat de Catalunya via the Catalan Agency for Research and Universities under AGAUR grants 2021-SGR2021-01215 to F.G. and 2021-SGR2021-01301 to E.M.N. A.C. was supported by PRE2019-087927 FPI contract from MCIN cofunded by MCIN/AEI/10.13039/501100011033 and FSE+. I.M. was supported by INPhINIT, “la Caixa” Doctoral Fellowship Programme (ID 100010434, fellowship code LCF/BQ/DI18/11660028). This project has received funding from the European Union's Horizon 2020 research and innovation program under the Marie Sklodowska-Curie grant agreement no. 713673. We also acknowledge support of MCIN through the Centro de Excelencia Severo Ochoa (CEX2020-001049-S, MCIN/AEI/10.13039/501100011033) and the Generalitat de Catalunya through the CERCA program.
Footnotes
-
Article is online at http://www.rnajournal.org/cgi/doi/10.1261/rna.080604.125.
-
Freely available online through the RNA Open Access option.
- Received May 18, 2025.
- Accepted August 11, 2025.
This article, published in RNA, is available under a Creative Commons License (Attribution-NonCommercial 4.0 International), as described at http://creativecommons.org/licenses/by-nc/4.0/.
REFERENCES
MEET THE FIRST AUTHOR

Meet the First Author(s) is an editorial feature within RNA, in which the first author(s) of research-based papers in each issue have the opportunity to introduce themselves and their work to readers of RNA and the RNA research community. Annagiulia Ciocia is the first author of this paper, “Context-dependent phosphorylation of CSDE1 drives interactions with ribosomes.” After earning a bachelor's degree in Biological Sciences and a Master's degree in Genetics and Molecular Biology from the University of Rome “La Sapienza,” Annagiulia has pursued her PhD in Biomedicine in the laboratory of Fátima Gebauer, located at the Centre for Genomic Regulation (CRG) and associated with the “Universitat Pompeu Fabra” (UPF) in Barcelona, Spain. The main interests of the lab are the mechanisms responsible for mRNA translation regulation and the role of RNA-binding proteins (RBPs) in this process. The central focus of Annagiulia's research has been the characterization of the RBP CSDE1 in cancer.
What are the major results described in your paper, and how do they impact this branch of the field?
In our paper, we aimed to characterize the different protein isoforms, post-translational modifications (PTMs) and protein interactomes of the RBP CSDE1, which we previously identified as a central regulator of cancer invasiveness and metastasis in cutaneous melanoma, yet as a tumor suppressor in squamous cell carcinoma. These aspects of CSDE1 biology had not been previously addressed, and we thought they could throw light into the context-specific behaviors of CSDE1 in cancer. We found that CSDE1 is phosphorylated in a context-dependent manner, and that phosphorylation correlates with increased interactions with ribosomal proteins. Future studies focused on the identification of specific CSDE1 phosphorylated residues that are relevant for ribosome interactions and/or tumor progression will provide mechanistic details that could be exploited in the development of new therapies for the treatment of metastatic melanoma.
What led you to study RNA or this aspect of RNA science?
Since I was in elementary school, everything related to natural sciences has always been my favorite subject of study, but it was not until high school that I understood that Biology was the topic that attracted me the most. The turning point came during the studies for the bachelor's degree, when I was attending my first molecular biology course: I still remember the increasing enchantment and astonishment I was feeling while learning more and more molecular mechanisms underlying what we call Life. Later, I met miRNAs, circRNAs and lncRNAs: Their “molecular dance” with bound protein partners was love at first sight! Then, after reading the book The Immortal Life of Henrietta Lacks by Rebecca Skloot, I understood that cancer represented the perfect scenario for me to study in detail this “dance” between RBPs and RNAs.
During the course of these experiments, were there any surprising results or particular difficulties that altered your thinking and subsequent focus?
I clearly remember the day I discussed with Fátima the first results of the phosphatase treatment on melanoma cell extracts: We were both so excited about the change happening upon treatment that all my lab colleagues wondered why we were screaming so loudly. It was an epic and joyful moment for me and a turning point for our research, which then progressively focused on the analysis of CSDE1 phosphorylation in melanoma.
If you were able to give one piece of advice to your younger self, what would that be?
I would encourage my younger self to believe more in herself and her skills as a scientist and to worry less about any single experiment that didn't work as expected.
What are your subsequent near- or long-term career plans?
Considering the global health impact and the fascinating molecular complexity of the disease, I am planning to continue my studies in cancer biology, with a particular focus on the interplay between RNAs and proteins and the molecular pathways in which they participate. Contributing to research that may one day enable treatments for currently incurable diseases, including cancer, would be deeply meaningful and rewarding to me, as it combines my interest in understanding basic biological processes with my desire to help advance future improvements in human health.




