


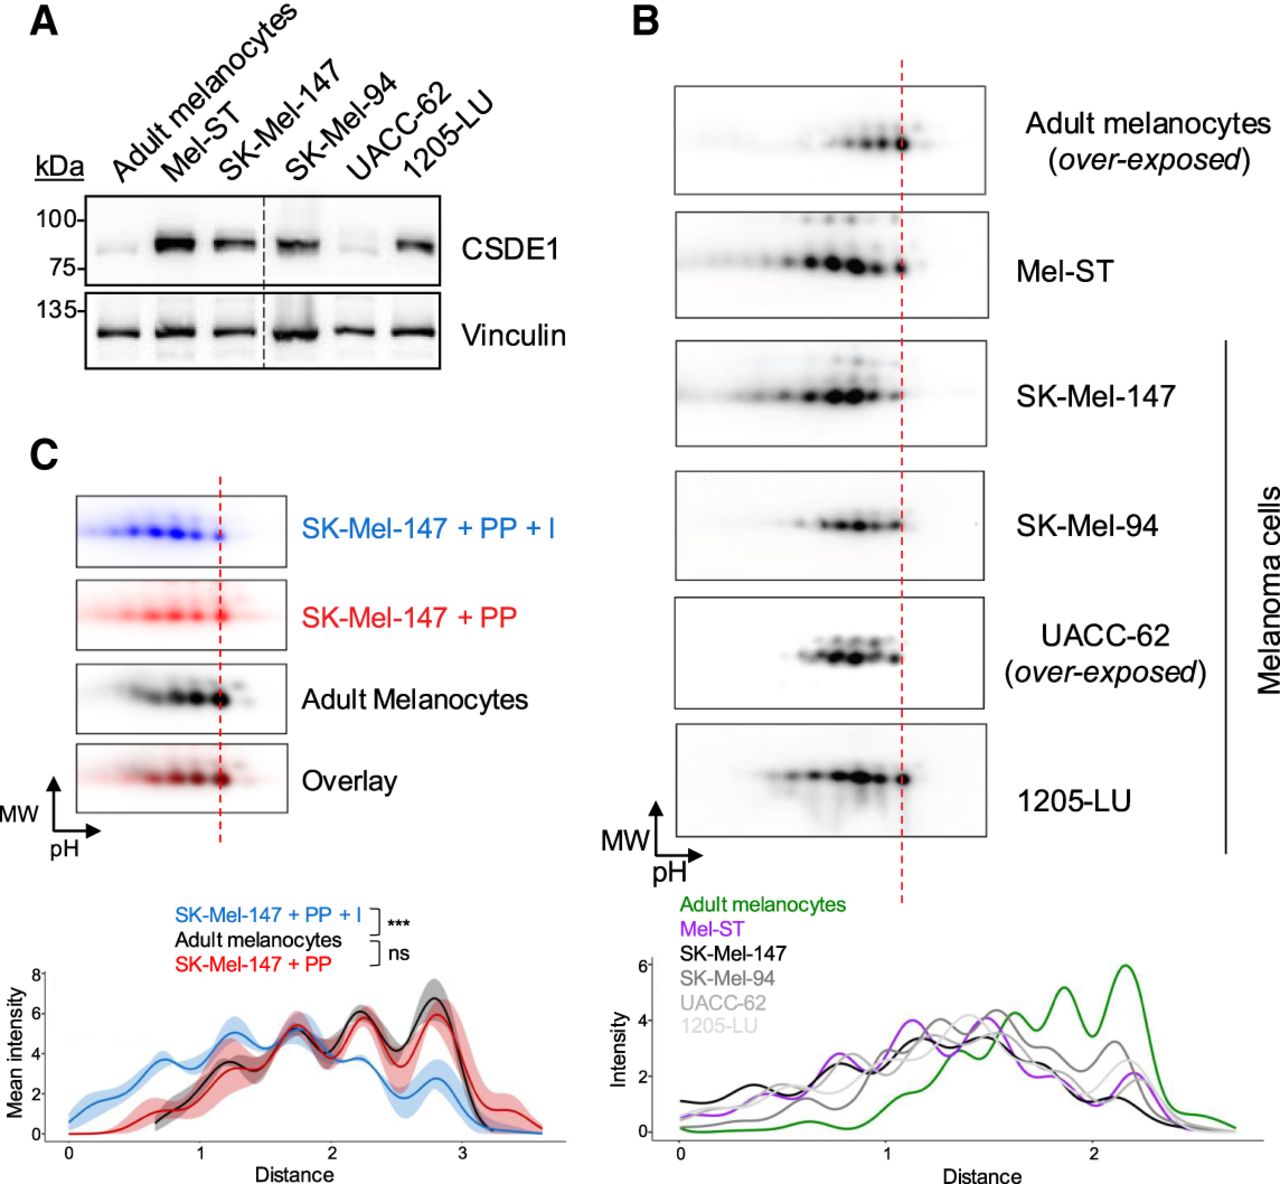
Analysis of CSDE1 phosphorylation in melanoma cell lines. (A) Western blot of CSDE1 in melanocytes, immortalized Mel-ST cells, and a panel of metastatic melanoma cell lines. Vinculin is shown as loading control. (B) 2D-gel analysis of CSDE1 proteoforms of the cell lines in A. The vertical dashed line is traced through the most basic CSDE1 proteoform in order to facilitate visualization. Density plots are shown at the bottom. (C) CSDE1 phosphorylation correlates with malignancy. Dephosphorylated melanoma CSDE1 fully overlays with untreated melanocytes. A vertical dashed line is drawn to facilitate visualization. Membranes have been false colored to facilitate comparison. Density plots and quantification are shown at the bottom (n = 3). Statistical significance was assessed using mixed ANOVA (***P ≤ 0.001; ns = not significant).




