


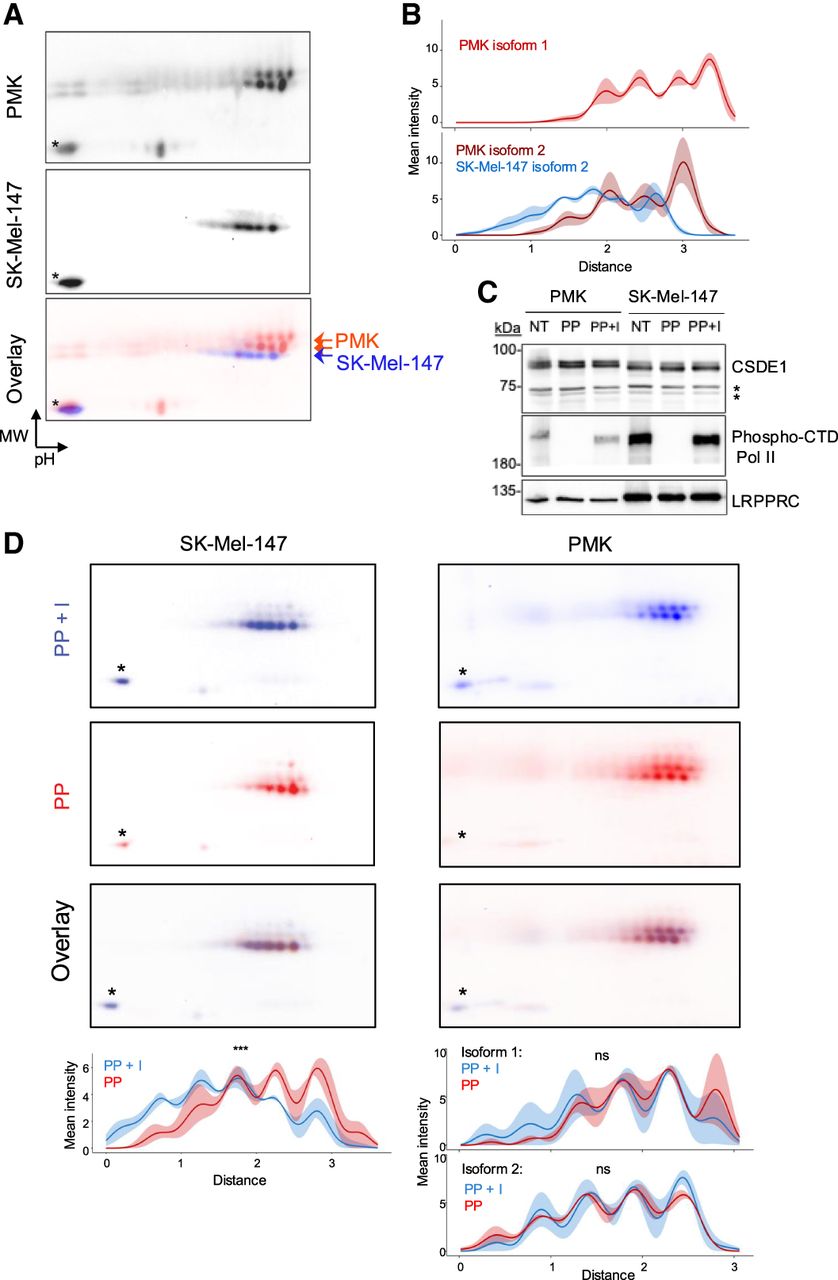
CSDE1 is phosphorylated in melanoma. (A) Analysis of CSDE1 proteoforms in PMK and SK-Mel-147 cells using 2D-gel separation followed by immunoblotting with αCSDE1 “PAN” antibody. Overlay of false colored membranes is shown at the bottom. Asterisks denote nonspecific bands that are used as landmarks to overlay different membranes. (B) Graphical representation of results in A. Plots represent density curves of overlaid blot intensities (n = 3). The solid line shows the mean signal intensity, and the shaded area represents the full range (minimum to maximum) across replicates. (C) Western blot to monitor phosphatase treatment efficiency. Phosphorylation levels of the RNA Polymerase II CTD Ser2 are shown as control of efficient dephosphorylation. LRPPRC is shown as loading control. (NT) Not treated, (PP) lambda phosphatase-treated, (PP + I) phosphatase-treated plus phosphatase inhibitors. (D) CSDE1 proteoforms upon treatment with phosphatase with and without phosphatase inhibitors in SK-Mel-147 cells (left) and PMK (right). Density plots are shown at the bottom. Differences between profiles (n = 3 for SK-Mel-147; n = 2 for PMK) were assessed using repeated measures ANOVA (***P ≤ 0.001; ns = not significant).




