


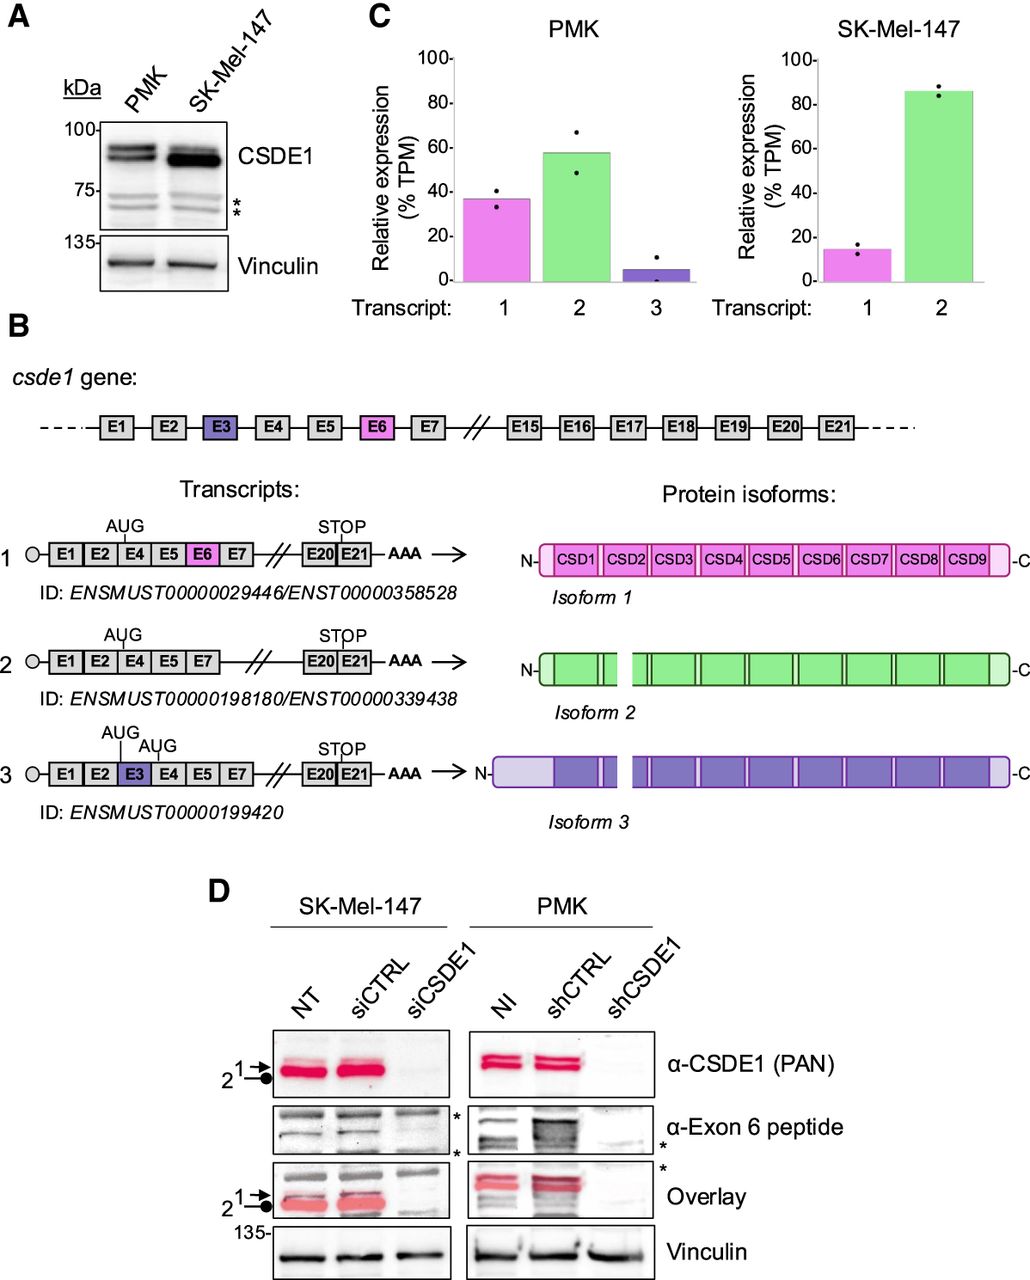
Identification of CSDE1 isoforms in PMK and melanoma cells. (A) Western blot analysis of CSDE1. Vinculin is shown as loading control. Asterisks denote nonspecific bands. (B) Schematic representation of Csde1 transcript variants identified by Nanopore sequencing (left) and corresponding encoded proteins (right). (E) Exon. Facultative exons are shown in color. CSD, cold shock domain. (C) Percentage of transcript expression as calculated from Nanopore data analysis (n = 2). TPM, transcripts per million. (D) Validation of CSDE1 isoform 1 by western blot with a specific antibody recognizing the exon 6–encoded peptide. The same membranes were stained with αCSDE1 “PAN” antibody and false colored to facilitate overlap visualization. Numbers on the left indicate CSDE1 isoforms, and asterisks denote nonspecific bands.




