


Study of the RNA splicing kinetics via in vivo 5-EU labeling
- Anastasiia K. Bolikhova1,2,10,
- Andrey I. Buyan3,4,10,
- Sofia S. Mariasina2,4,5,
- Alexander Y. Rudenko2,
- Daria S. Chekh6,
- Alexander M. Mazur7,
- Egor B. Prokhortchouk7,
- Olga A. Dontsova1,2,4,8 and
- Petr V. Sergiev1,2,4,9
- 1Center of Life Sciences, Skolkovo Institute of Science and Technology, Skolkovo 121205, Russia
- 2A.N. Belozersky Institute of Physico-Chemical Biology, Lomonosov Moscow State University, Moscow 119991, Russia
- 3Institute of Protein Research, Russian Academy of Sciences, Pushchino 142290, Russia
- 4Department of Chemistry, Lomonosov Moscow State University, Moscow 119991, Russia
- 5Faculty of Fundamental Medicine, Lomonosov Moscow State University, Moscow 119991, Russia
- 6Faculty of Biology, Lomonosov Moscow State University, Moscow 119991, Russia
- 7Institute of Bioengineering, Research Center of Biotechnology of the Russian Academy of Sciences, Moscow 119071, Russia
- 8Department of Functioning of Living Systems, Shemyakin-Ovchinnikov Institute of Bioorganic Chemistry, Moscow 117997, Russia
- 9Institute of Functional Genomics, Lomonosov Moscow State University, Moscow 119991, Russia
- Corresponding author: petya{at}genebee.msu.ru
-
↵10 These authors contributed equally to this work.
-
Handling editor: Maria Carmo-Fonseca
Abstract
Splicing is an important step of gene expression in all eukaryotes. Splice sites might be used with different efficiency, giving rise to alternative splicing products. At the same time, splice sites might be used at a variable rate. We used 5-ethynyl uridine labeling to sequence a nascent transcriptome of HeLa cells and deduced the rate of splicing for each donor and acceptor splice site. The following correlation analysis showed a correspondence of primary transcript features with the rate of splicing. Some dependencies we revealed were anticipated, such as a splicing rate decrease with a decreased complementarity of the donor splice site to U1 and acceptor sites to U2 snRNAs. Other dependencies were more surprising, like a negative influence of a distance to the 5′ end on the rate of the acceptor splicing site utilization, or the differences in splicing rate between long, short, and RBM17-dependent introns. We also observed a deceleration of last intron splicing with an increase of the distance to the poly(A) site, which might be explained by the cooperativity of the splicing and polyadenylation. Additional analysis of splicing kinetics of SF3B4 knockdown cells suggested the impairment of a U2 snRNA recognition step. As a result, we deconvoluted the effects of several examined features on the splicing rate into a single regression model. The data obtained here are useful for further studies in the field, as they provide general splicing rate dependencies as well as help to justify the existence of slowly removed splice sites.
Keywords
INTRODUCTION
Genes of eukaryotes are interrupted by introns (Berget et al. 1977), which are removed from precursor RNA transcripts in a process called splicing (Sharp 1988). Initially, introns were likely to be formed due to the spread of mobile type II ribozymes (Koonin 2006) and hence posed a burden eukaryotes have to cope with. Later, however, eukaryotic cells learned to make use of splicing as a source of additional proteome diversity and regulation of gene expression (Nilsen and Graveley 2010; Irimia and Blencowe 2012; Braunschweig et al. 2013; Lee and Rio 2015). Introns are excised from the primary RNA transcript by a spliceosome, a specialized ribonucleoprotein complex formed dynamically around a catalytic core of five small nuclear RNAs (snRNAs) (Brody and Abelson 1985; Nilsen 2003; Shi 2017). The spliceosome recognizes conserved motifs of the 5′ splice site (5′SS), 3′SS, and branch site (BS) (Braun et al. 2018). Mechanistically, the splicing proceeds via two sequential transesterification reactions. First, the 2′-hydroxyl of adenosine at the BS attacks the phosphodiester bond at the 5′SS boundary, and then the 3′-hydroxyl of the 5′ exon attacks the phosphodiester bond at the 3′SS boundary, leading to the exon joining and intron release (Will and Luhrmann 2011).
Splicing affects almost every further step of RNA functioning in a cell, including localization (Zeng and Hamada 2020), translation (Nott et al. 2004), and degradation (Maquat 1995; Hentze and Kulozik 1999; Zheng 2016). Moreover, many mRNAs have alternative splicing isoforms (Nilsen and Graveley 2010; Irimia and Blencowe 2012; Lee and Rio 2015; Zheng 2016) for combinatorial increase in proteome diversity (Schmucker et al. 2000) and regulation of gene expression (Bell et al. 1988). Alternative splicing plays an important regulatory role in differentiation of cell identity (Baralle and Giudice 2017; Weyn-Vanhentenryck et al. 2018) and death (Mosley and Keri 2006). The ratio of alternative RNA isoforms is regulated by the structure of pre-mRNA (McManus and Graveley 2011; Kalinina et al. 2021) binding of various RNA-binding proteins (RBPs) (Busch and Hertel 2012; Horn et al. 2023), and even RNA polymerase II transcription rate (Muniz et al. 2021).
An additional increase in splicing complexity originates from the coexistence of two types of introns, both of which are excised by specialized spliceosomes. The major spliceosome contains U1, U2, U4, U5, and U6 snRNPs and excises the majority of introns, defined predominantly by GT–AG splice sites (SS) and, in 0.8%–3% of cases, by GC–AG SS. The latter introns are usually slower and often involved in alternative splicing. Finally, there is a vanishingly small fraction of noncanonical U2-type introns with AT–AC dinucleotides (Sheth et al. 2006). The minor spliceosome includes U11, U12, U4atac, U5, and U6atac snRNPs and excise U12-introns found at a frequency of <0.4% in humans (Tarn and Steitz 1996; Turunen et al. 2013). U12-introns are defined by the same boundaries as U2-introns, but have a different dinucleotide composition, with more than 20% given to AT–AC intron ends (Moyer et al. 2020). Excision of introns by the minor spliceosome is known to be slower than that of the major one (El Marabti et al. 2021). Minor introns are evenly intermixed with the major ones (Levine and Durbin 2001), contributing to posttranscriptional regulation of gene expression (Younis et al. 2013; Baumgartner et al. 2019). Minor and major spliceosomes can either cooperate, enhancing the splicing of the neighboring introns, or compete for the same intronic region, leading to the fluctuation of the alternative isoform ratio (Olthof et al. 2020; Akinyi and Frilander 2021).
While the most important outcomes of splicing are efficient removal of introns and generation of splicing isoforms depending on the current needs of a cell, an open question is whether the speed of intron removal is a subject of regulatory adjustment. What might be the purpose of a potential difference in splicing kinetics, and what are the means to adjust the speed of this process? Although several experiments addressing these questions were previously published (Alpert et al. 2017; Wachutka et al. 2019; Drexler et al. 2020), they are sparse. Thus, we aimed to extend the knowledge on splicing kinetics using a labeling procedure orthogonal to previously published ones based on 4-thiouridine incorporation, and performed an extended analysis of the results.
In this work, we used pulse labeling of nascent RNA in HeLa cell culture by 5-ethynyl uridine (EU), followed by biotin addition via click chemistry, affinity purification and high-throughput sequencing. The pulse times 10–20 min exceed typical timing of the individual splicing reactions, at the same time being much smaller than typical mRNA degradation half-life, so the conditions correspond to stationary kinetics. Comparison of the intron retention measure Θ in the nascent RNA obtained 10 or 20 min after labeling with the one obtained 24 h later, allowed us to calculate SpRs for each SS. We completely and thoroughly analyzed the dependency of SpR on various characteristics of the intron and the surrounding exons. The difference of SpR in various RNA types was shown, and the mutual influence of minor and major spliceosomes was demonstrated. Based on the results of the analysis, we constructed a model reflecting the influence of various factors on the SpR.
RESULTS
EU-RNA-seq is effective in deducing RNA splicing rates
Nascent RNA transcripts undergoing splicing comprise a very small share of total cellular RNA. To observe a higher share of intermediates, we performed a pulse labeling of nascent RNA in HeLa cell culture by 5-EU followed by nascent RNA purification and high-throughput sequencing. We harvested cells and purified nascent RNA following 10, 20 min, and 24 h past EU addition (Fig. 1A–C). Each experiment was done in three biological replicates. Additionally, we performed standard poly(A) + RNA-seq to determine the steady-state level of intronic excision and compared it with 24 h, as well as conducted the same experiment using HeLa SF3B4 knockdown cells to estimate the effect of the protein depletion on splicing kinetics.
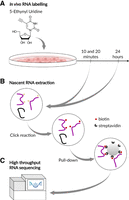
EU-RNA-seq experiment design. (A) Addition of 5-EU to the culture media followed by incubation for 10 min, 20 min, or 24 h. (B) EU labeled RNA purification using click reaction with biotin and streptavidin beads. (C) High-throughput sequencing of the cDNA library obtained from biotinylated RNA.
First, reads were trimmed and mapped to the human genome GRCh38, as described in Materials and Methods. As a result, we obtained around 20 million uniquely mapped reads for the 10 min kinetic point and 30 million reads for 20 min and steady state, with an expected drop for 24 h as the ribosomal RNA accumulates (Supplemental Fig. S1A,B). Next, FRASER (v.1.10.0) R package (see Materials and Methods) was used to estimate Θ for each SS followed by SpR calculation for 57,381 SS (Supplemental Table 1). Θ reflects the fraction of reads spanning the SS exon–intron junction among all the reads that span its exonic part, that is the Θ value of 0 corresponds to fully spliced SS, while 1 indicates fully unspliced SS (Supplemental Fig. S2A,B).
Principal component analyses based on gene-level counts and Θ resulted in the first components distinguishing 10- and 20-min kinetic points from steady state and 24 h, and the second components distinguishing 10 and 20 min as expected (Supplemental Fig. S1C). Moreover, SpR calculated using a 24 h kinetic point and steady state were highly correlated with Pearson's r = 0.996, as most Θ in both samples were near-zero (Supplemental Fig. S1D). Considering 10- and 20-min time points, their SpR estimates were correlated as well, potentially because a 10 min gap was insufficient to reliably detect the overall splicing changes (Pearson's r = 0.84, Supplemental Fig. S1D). However, the fraction of reads mapped to exons was slightly higher for a 20 min kinetic point with a one-sided Wilcoxon signed-rank test P-value < 10−241 for 17,346 genes (Supplemental Fig. S1E). Because of the high similarity between SpR determined using 10- and 20-min time points, we selected the estimates obtained from the latter kinetic point for further analysis as they are based on higher read numbers, with the results obtained for 10 min used as an additional control, which can be found in Supplemental Table 1.
To check the consistency with previously published results (Wachutka et al. 2019), we compared the SpR determined here, and estimated SS half-lives obtained previously. While the cell line, labeling method and calculation pipeline were different, we observed a good correspondence between the data (Supplemental Fig. S1F).
Correlation of general transcript properties with splicing rate
Transcripts are generated at different rates according to their transcription level. First of all, we assessed a potential correlation between transcript abundance and SpR (Fig. 2A). We observed a nonlinear SpR dependence on the RNA expression measured in transcripts per million (TPM), suggesting transcripts from highest expression deciles having SS with increased SpR. More efficient splicing of highly expressed genes was observed previously (Ding and Elowitz 2019) and might be explained by the higher evolutionary pressure to process abundant transcripts faster for the sake of faster cycling of splicing components. Mechanistically, such an increase in SpR for highly transcribed loci might stem from the formation of nuclear speckles, which increases the local concentration of splicing factors and accelerates splicing. In 2024, Bhat et al. showed that speckle proximity score is cell-type-specific and correlates with RNAP II density (Bhat et al. 2024). Furthermore, using fluorescent reporters, they demonstrated a nonlinear dependency of RNA SpR on gene transcription level similar to what we observed (Supplemental Fig. S3A). To delve deeper into the functional features of transcripts with a high and low SpR, we performed gene set enrichment analysis (GSEA) (Subramanian et al. 2007) ordering genes by the SpR of the corresponding SS (Fig. 2B). As expected, RNAs containing SS with the highest SpR were enriched by numerous functions related to cell metabolism, including mitochondrial functioning and translation. Transcripts containing SS with the lowest SpR turned out to be involved in signaling cascades where splicing variations may serve to fine tune the cell response to different stimuli (Lopez‐Urrutia et al. 2017; Pokhilko et al. 2021; Sánchez-Escabias et al. 2022).
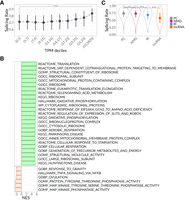
Dependency of the SpR on the general features of the transcript. (A) SpR association with the expression levels binned into TPM deciles, aligned rank transform (ART) ANOVA P-value < 10−15. Dots correspond to medians with lower and upper error bars showing 25% and 75% quantiles. Dashed line represents the overall median tendency. (B) Significant pathways from SpR-based GSEA ordered by normalized enrichment score (NES). Color corresponds to NES < or > 0. (C) SpR for different RNA types, ART ANOVA P-value < 10−15. The significance of the Tukey test between groups is depicted as (*) for P < 0.05, (**) for P < 0.01, and (***) for P < 10−4, (ns) nonsignificant.
Considering different RNA classes, the comparison of the SpR across the most abundant transcript types demonstrated a significant difference with 53,063 SS from protein coding mRNAs (PCs) demonstrating the highest SpR (Fig. 2C). Other transcript types included the targets of nonsense-mediated decay (NMD, 1807 SS), transcripts containing retained introns (RI, 2153 SS), and long noncoding RNAs (lncRNAs, 284 SS). The two latter groups demonstrated significantly lower SpR compared to PCs, which is consistent with the observations made previously (Wachutka et al. 2019).
Correlation of splicing rate with a splice site position within a pre-mRNA
Posttranscriptional processing events are interconnected and coordinated (67). We estimated a dependency of SpR on mutual arrangement of transcript elements (Fig. 3A). The cap at the 5′-end of a transcript is known to facilitate the 5′SS recognition (Lewis et al. 1996). Accordingly, we assessed SpR dependency on the distance to the transcription start site (TSS) and observed that the SpR of the first donor site is highest if located at the shortest distance to TSS (Fig. 3B, right subpanel). Acceptor SS, on the contrary, demonstrated a positive tendency, with their SpR values increasing while moving away from TSS, which can be explained by slower splicing of very short introns (see below). However, considering the SpR dependency on the distance to TSS for all introns, not necessarily the first ones, both rates were on average decreasing (Fig. 3B, left subpanel). It might reflect a tendency that first introns could have more time for cotranscriptional splicing relative to more distant ones (Wachutka et al. 2019). Another possible explanation for the higher number of spliced reads at the beginning of the transcript might be the absence of RNA fragmentation; in this case, incorporation of EU at the end of a transcript would be sufficient to precipitate the entire molecule whose 5′-terminal region has more time for being spliced (Wachutka et al. 2019). In addition to these two hypotheses, we propose that the increase in the number of reads near the TSS may stem from higher expression levels of the short transcripts (Supplemental Fig. S3B). Under this assumption, the number of both split and non-split reads will be biased toward TSS, which we can see in Supplemental Figure S3C. However, this effect can be eliminated if we consider the relative SS position instead of the absolute one (Supplemental Fig. S3D), with the SpR demonstrating the same tendency to decrease as we move from TSS, suggesting cotranscriptional splicing (Supplemental Fig. S3E). The exception is slower splicing of donor sites closest to the TSS which might be explained by a general transcription slowdown for the first introns (see discussion below).
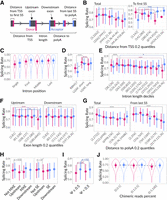
Dependency of the SpR on the SS position relative to other transcript elements. (A) Scheme representing how various donor and acceptor SS characteristics were determined. (B) Dependency of the SpR on the distance from TSS for all (left panel) and 5′-most SS (right panel). Considering all SS, ART ANOVA P-value < 10−15 for distance from TSS and 4 × 10⁻⁸ for SS type (*) distance interaction terms. In the case of 5′-most SS, ART ANOVA P-value = 10−4 for distance and 4 × 10⁻¹² for SS type (*) distance interaction term. Dots correspond to medians with lower and upper error bars showing 25% and 75% quantiles. Dashed line represents the overall median tendency. Color corresponds to donor and acceptor SS. (C) SpR for SS with different relative locations in the transcript. ART ANOVA P-value < 10−15 for both SS position and SS type (*) SS position interaction terms, one-sided Wilcoxon rank sum test P-value < 10−32 for single versus other SS and < 10−25 for acceptor versus donor SS in the first intron. (D) Dependency of the SpR on the intron length (≤ or > 134 nt) and RBM17-dependency. ART ANOVA P-value = 2 × 10⁻¹² and < 10−15 for splicing mechanism and SS type (*) mechanism interaction terms, respectively. (E) Dependency of the SpR on the intron length. ART ANOVA P-value < 10−15 for both intron length and SS type (*) intron length interaction terms. (F) Dependency of the SpR on the adjacent exon's lengths. Regarding the upstream exon length, ART ANOVA P-value < 10−15 and < 10−13 for exon length and SS type (*) exon length interaction terms, respectively. For the downstream exons, ART ANOVA P-value = 10−11 for exon length only. (G) Dependency of the SS SpR on the distance to poly(A) site for all (left panel) and 3′-most introns (right panel). ART ANOVA P-value < 10−15 for both distance and SS type (*) distance interaction terms in the case of all SS, whereas for SS corresponding to the last introns, these values are <10−15 and 0.038, respectively. (H) SpR for constitutive exons and exons annotated as alternatively spliced. Left panel corresponds to mutual exon exclusion events, whereas the right panel corresponds to exon skipping. The significance estimates shown on top correspond to one-sided Wilcoxon rank sum test P-values. (I) SpR for donor and acceptor SS located upstream and downstream from the SE, respectively. (X-axis) Percent spliced in calculated with rMATS. P-values were calculated using a one-sided Wilcoxon rank sum test. (J) SpR for SS with different percent of chimeric reads. ART ANOVA P-value = 4 × 10⁻⁸ for chimeric reads fraction and 9 × 10⁻⁴ for SS type (*) chimeric reads fraction interaction terms, one-sided Wilcoxon rank sum test P-value = 10−5 for the first bin (0%–0.1%) versus the others. The significance of the Tukey test between groups is depicted as (*) for P-value < 0.05, (**) for P < 0.01, and (***) for P < 10−4, (ns) nonsignificant.
There are two proposed mechanisms through which SS are recognized. During intron definition the spliceosome recognizes the intron directly, while in the case of exon definition the spliceosomal complexes are assembled cooperatively across the exon (Schneider et al. 2010; Li et al. 2019). In higher eukaryotes, exons are on average shorter and introns are longer, making cross-exon cooperation possible between U2 snRNP bound to a preceding acceptor site and U1 snRNP bound to the following donor site, with various splicing enhancer sequences located within exonic regions (Berget 1995; Braun et al. 2018). At the same time, in yeast, the intron definition mechanism is predominant where U1 snRNP binding to the donor site occurs cooperatively with downstream acceptor/branch site recognition by U2 snRNP (Xu et al. 2004; Shao et al. 2012). Drosophila uses both mechanisms depending on the length of particular exons and introns (Pai et al. 2017). We checked a dependency of SpR on the existence of neighboring introns and the length of flanking exons and introns (Fig. 3C–F). Excision of a sole intron in a transcript appeared to be the slowest (Fig. 3C), corroborating the cooperativity of splicing. An unusually high SpR was observed for acceptor, but not for donor sites in the very first intron. Such a discrepancy between the SpRs of donor and acceptor sites of the first intron was observed previously (Wachutka et al. 2019), although it was caused by a decrease in the donor SpR. Consistent with that article, we assume that a slower transcription rate of the first introns (Danko et al. 2013) may decrease donor sites SpR, and we also propose the general acceleration of acceptors splicing, as 5′SS have more time to attract U1 snRNP and form a commitment (Early) complex.
Considering the influence of the intron length on SpR, we first decided to compare long introns (>134 nt) that are thought to be recognized through exon definition (Lim and Burge 2001) with short ones likely being involved in intron definition, as well as a special group of introns with a truncated poly-pyrimidine tract shown to require RBM17 for splicing instead of U2AF proteins (Fukumura et al. 2021, 2023). Surprisingly, RBM17-dependent introns showed a dramatic decrease in SpR compared to those recognized by U2AF2–U2AF1 (Fig. 3D). This can be explained by the time needed for RBM17 to compete out U2AF2 from the truncated poly-pyrimidine tract. Increase in the intron length (Fig. 3D,E) trivially leads to the decrease in the donor site SpR, likely because a donor site would not be able to splice as long as an intron being transcribed. A nontrivial result, however, is a dependency of an acceptor site SpR, which tends to increase with the length of the intron being lower than the donor SpR for short introns and higher otherwise (Fig. 3D,E). As discussed earlier, long transcription times between the synthesis of donor and acceptor sites is probably beneficial for completion of U1 snRNP binding to a donor site before the acceptor site synthesis for a quick recognition of the 3′SS, once it is transcribed. Slower splicing of the smallest introns observed in Figure 3E might be explained by either the presence of RBM17-dependent introns or the general steric constraints. These results are in agreement with several previous observations regarding a quicker splicing of acceptor sites in long introns (Wachutka et al. 2019) and suboptimal SpRs of the very small introns (Pai et al. 2017), while in contrast to yet another study (Windhager et al. 2012).
Assessment of the influence of flanking exon lengths on SpR (Fig. 3F) revealed that short upstream exons are beneficial for fast usage of the donor site. For the acceptor SS, a similar tendency, albeit at smaller magnitude, can be seen considering downstream exon length. However, no such tendency can be observed for a subset of short introns (≤134 nt) (Supplemental Fig. S3F). These observations fit well a model of the prevalent exon definition in mammalian splicing of long introns and intron definition for short introns recognition, with both processes possibly being handled by the same splicing machinery (Li et al. 2019).
Next, we estimated the effect of the SS distance to poly(A) on their SpR. We found that SpR steadily drops with the distance increasing up to tens of kilobases, after which it begins to increase slightly (Fig. 3G, left subpanel). This drop can be better seen if we leave only the SS corresponding to the last introns (Fig. 3G, right subpanel). The latter reflects the SpR dependency on 3′-UTR length, with the introns located just before longer untranslated regions being spliced at a lower rate. This observation might stem from the possibility of a poly(A) tail to stimulate splicing of the last introns, especially those with a weak 3′SS (Huang et al. 2023). Another explanation includes telescripting that may prevent premature polyadenylation of long 3′ UTR if the last intron is spliced slowly enough (Berg et al. 2012). Taken together, these results support the idea of 3′SS activation being a timer for transcription proceeding before a polyadenylation signal is recognized (Mora Gallardo et al. 2021).
One of the crucial aspects in splicing regulation is the choice between alternative SS. We considered two types of alternative splicing events: mutually exclusive exons (MXE) and skipped exons (SE), and checked whether alternatively spliced introns are generally slower than the constitutive ones (Fig. 3H). We used Kassiopeia and ExonSkipDB databases to extract introns that are supposed to be alternatively spliced under certain conditions or in particular cells (Hatje and Kollmar 2014; Kim et al. 2019). The results clearly demonstrate that the donor SS located upstream to MXE and SE have a significantly lower SpR, which may provide enough time for the spliceosome to select a particular SS. While these observations were made based on the external annotations, we went further and analyzed our WT steady-state data with rMATS (v.4.1.2) to obtain percent spliced in (PSI) estimations for SE (Supplemental Fig. S4A,B; Supplemental Table 1). The comparison of the SpRs of SS located upstream and downstream from mostly excluded (PSI ≤ 0.5) and included (PSI > 0.5) exons demonstrated significantly lower SpR for upstream donor sites if the following exon was skipped (Fig. 3I). However, this result may be a trivial consequence of intron elongation with a new intronic region consisting of the skipped exon and two adjacent introns. Additionally, using the ALTssDB database (Carranza et al. 2022), we demonstrated that the alternative 5′SS and 3′SS are used at a lower rate compared to their preferred competitors (Supplemental Fig. S4C).
Finally, trans-splicing might be considered an extreme case of alternative splicing. To find a potential correlation between the frequency of trans-splicing events and SpR, we estimated the fraction of chimeric reads spanning each SS. As expected, an elevated chimeric read fraction demonstrated anticorrelation with SpR, likely because slower introns have higher chances of being spliced with a different RNA molecule (Fig. 3J).
Properties of a splice site that contribute to splicing rate
What are the determinants that make a SS faster or slower? First, we considered the dinucleotide sequences of the donor and acceptor sites and classified them by the type of the recognizing spliceosome. While most of GC-, GT-donors, and AG-acceptors from our data are recognized by the major spliceosome, some of them together with AT-donors and AC-acceptors are targets of the minor spliceosome (Supplemental Fig. S4D; Moyer et al. 2020). As expected (Patel et al. 2002; Wachutka et al. 2019), SS recognized by the minor spliceosome have significantly lower SpR compared to those recognized by the major spliceosome (Fig. 4A). At the same time, GC-, GT-donors, and AG-acceptors tend to be faster than AT-donors and AC-acceptors (Supplemental Fig. S4E).
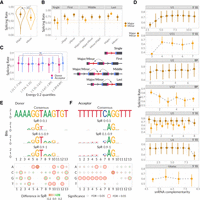
SS properties influencing SpR. (A) SpR for SS recognized by major (brown) and minor (orange) spliceosomes. Dots correspond to medians with lower and upper error bars showing 25% and 75% quantiles. One-sided Wilcoxon rank sum test P-value < 10−17 for major versus minor spliceosome. (B, top) SS SpR dependency on the presence of the neighbor splice junctions. (Bottom) Scheme representing the SS categories depicted in the top subpanel. Color scheme is the same as in (A). One-sided Wilcoxon rank sum test P-value < 10−124 and 0.03 for single versus nonsingle SS recognized by major and minor spliceosomes, respectively. (C) Dependency of the SpR on the secondary structure energies in kcal/mol. Dashed line represents the overall median tendency. ART ANOVA P-value = 0.03 for energy and < 10−14 for SS type (*) energy interaction term. (D) Dependency of the donor and acceptor SS SpR on the complementarity to various snRNAs, color scheme is the same as in (A). The only two significant ART ANOVA P-values included = 0.005 for U1 complementarity and 2 × 10⁻⁴ for U2 complementarity. (E, F, top) Donor (E) and acceptor (F) consensus sequences and logos for SS with SpR corresponding to different SpR bins: slow (0–0.1), medium (0.1–0.9), and fast (0.9–1). (Bottom) Heatmap representing the effects of single nucleotide substitutions on the SpR. Fill color corresponds to the difference in SpR medians between SS containing consensus and nonconsensus nucleotides; line color and size correspond to Wilcoxon rank sum test FDR < 0.05. The significance of the Tukey test between groups is depicted as (*) P-value < 0.05, (**) for P < 0.01, and (***) for P < 10−4, (ns) nonsignificant.
This and other studies (Kim et al. 2019; Mertes et al. 2021) demonstrated a cooperativity in the excision of multiple introns from the same transcript. While the minor spliceosome works slower than the major one, we checked whether they might cooperate to provide faster intron excision. Combining the information about the SS surrounding introns and the spliceosomes that recognize them, we estimated the cooperativity of major and minor complexes. Both spliceosomes turned out to be involved in cross-exon recognition resulting in a higher SpR when additional junctions are located nearby, even if the current junction is processed by another spliceosome (Fig. 4B; Supplemental Fig. S4F). This result corroborates earlier data on the cooperation between major and minor spliceosomes (Verbeeren et al. 2010; Niemelä et al. 2015; Olthof et al. 2020; Akinyi and Frilander 2021).
RNA molecules are known to form various secondary structures that may influence numerous processing steps, including splicing (Varani et al. 1999; Buratti and Baralle 2004; Pervouchine et al. 2012; Kalinina et al. 2021), as well as alter their functions and stability (Georgakopoulos-Soares et al. 2022). To address how the secondary structure formation affects splicing, we studied SpR dependency on the energies of the predicted structures formed by the sequences surrounding SS. While in general an influence of secondary structure on SpR appears to be low, the results shown in Figure 4C suggest opposite tendencies for donor and acceptor sites, with the former having SpR decreasing as the energy increases. However, this stimulatory role of the donor site's secondary structure might potentially be an artifact explained by sequence bias of an efficient SS, due to the necessity to interact with snRNAs or RBPs (Hansen et al. 2002; Buratti and Baralle 2004; Jolma et al. 2020).
SS recognition by snRNAs is central to the functioning of the spliceosome. Canonical introns bind U1, U2, U5, and U6 snRNAs, while introns recognized by the minor spliceosome bind U11, U12, U5, and U6atac snRNAs via complementary interactions (Turunen et al. 2013; Akinyi and Frilander 2021). We checked how the number of paired bases formed between snRNAs and pre-mRNA affect SpR (see Materials and Methods). As a result, we observed a moderate SpR increase with increasing U1 complementarity for the donor SS recognized by major spliceosomes, including canonical GT-donor SS (Fig. 4D; Supplemental Fig. S4G). The same tendency was observed for U2 complementarity to AG-acceptors. However, an influence of minor introns complementarity to U11, U12, and U6atac was hard to estimate due to a smaller sample size. Overall, these tendencies suggest higher SpRs for donor and acceptor SS with an increased complementarity to U1 and U2 snRNAs, which was also confirmed using a MaxEnt (Yeo and Burge 2004) measure of SS recognition (Supplemental Fig. S4H).
To address how the identity of each SS nucleotide influences splicing kinetics, we examined nucleotide sequences surrounding donor and acceptor SS. First, sequence logos were obtained for the SS having low (0–0.1), medium (0.1–0.9), and high (0.9–1) SpR (Fig. 4E,F, top subpanel). As expected, we observed an absence of variability for G and AG nucleotides of donor and acceptor sites, respectively. In a fraction of slowly used donor sites, we observed a visible proportion of GC dinucleotides, while GT dinucleotides dominated in quickly spliced donors. Surprisingly, acceptor sites turned out to be more conservative with almost all the significant substitutions leading to SpR decrease, especially those emerging inside the polypyrimidine tract, while donor sites had numerous positions where changing the consensus nucleotides caused SpR increase (Fig. 4E,F, bottom subpanel). This observation additionally supports the regulatory role of the donor site that can be specifically designed to either improve or impair splicing.
RNA-binding proteins influencing splicing rate
RBPs can recognize primary, secondary, and tertiary structural motifs within RNA (Jolma et al. 2020; Van Nostrand et al. 2020) and may exert a positive or negative influence on splicing (Busch and Hertel 2012; Howard et al. 2018). To identify RBPs that are associated with changes in SpR, we used eCLIP data from ENCODE available for 165 proteins from K562 (136 RBPs) and HepG2 (104 RBPs) cell lines, as well as downloaded binding motifs of 152 RBPs from ATtRACT (see Materials and Methods) (Giudice et al. 2016; Van Nostrand et al. 2016, 2020). Thus, we were able to identify RBP-binding sites proximal to SS and deduce RBP's influence on the SpR. This resulted in 42 proteins, observed in at least two of the three above-mentioned data sets, that bind at donor or acceptor sites and have a significant influence on SpR (Fig. 5A). Generally, a good correlation of the results based on RBP sites in K562 and HepG2 cells can be seen. Surprisingly, binding of major splicing factors including U2AF1, U2AF2, and PRPF8 proteins determined by cross-linking (Van Nostrand et al. 2016, 2020) demonstrated an apparent negative influence on SpR. However, if binding sites of the factors were predicted using motifs from ATtRACT (Giudice et al. 2016), we could observe an expected acceleration of splicing, for example, if acceptor sites are recognized by U2AF2.
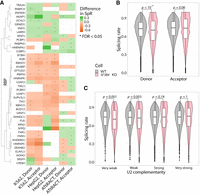
Influence of RBPs and enzymatic modification of RNA on SpRs. (A) The association between different RBPs and the SpR of the SS they recognize according to eCLIP (first four columns) and ATtRACT (last two columns). Color corresponds to the difference between median SpR of the RBP-bound SS and the sites that are not recognized by the protein. Asterisks correspond to Wilcoxon rank sum test FDR < 0.05. Hierarchical clusterization was performed with the average-linkage method (UPGMA) using cosine distances. (B) Violin and box plots demonstrating the SpRs of donor and acceptor SS in WT and SF3B4 knockdown cells. Color represents the cell line. P-values were calculated using a one-sided Wilcoxon signed-rank test. (C) Violin and box plots demonstrating the SpRs of the acceptor SS with very weak (0–1), weak (2–3), strong (4–5), or very strong (6–7) complementarity to U2 snRNA in WT and SF3B4 knockdown cells. Color represents the cell line. P-values were calculated using a one-sided Wilcoxon signed-rank test.
A possible explanation of this contradiction is that eCLIP has higher chances to cross-link major splicing factors bound to slowly removed introns where they dwell longer, on average. To confirm this suggestion and to improve our analysis of the RBP effect on SpR, we repeated the EU-RNA-seq experiment and the following analysis using SF3B4 knockdown cells (see Materials and Methods). SF3B4 is a constitutive component of U2 snRNP, which demonstrated apparently stronger binding to the slowly spliced sites (Fig. 5A), thus being a good candidate to consider for the above-provided explanation for this apparent discrepancy. As expected, depletion of the U2 snRNP component led to a decrease in SpR compared to WT (Fig. 5B; Cretu et al. 2021). Interestingly, this decrease was observed for donor sites only, which can be explained by the impaired branchpoint recognition step as the 5′SS are forced to wait until splicing proceeds. Moreover, splicing delay was also observed for the acceptor SS with weak U2 complementarity, which additionally supports the detrimental effect of SF3B4 knockdown on BS recognition (Fig. 5C).
A CDF-quantile regression model for contribution of different factors to splicing rate
With numerous features of SS being discussed in the current article, we tried to fit the CDF-quantile regression model from the cdfquantreg (v.1.3.1) package (see Materials and Methods). Using the zero and one inflated quantile Kumaraswamy regression model, we were able to accurately fit our SpR estimations ranging from 0 to 1 separately for donor and acceptor sites, using 19 features in total (13 numerical and six categorical), as shown in Figure 6A. Eventually, we examined the resulting coefficients and their significance to identify the factor's linear contribution to SpR and which of them affect it the most. As a result, transcript expression, neighboring exons and intron lengths turned out to be among the top affecting factors, with the latter having the opposite effect on donor and acceptor SpR. Considering categorical variables, particular RNA classes (lncRNA and RI) and spliceosome type contributed the most to the SS SpR, decreasing its value consistently with the previous findings. Overall, there were 13 factors established to significantly affect SpR according to our regression model, with all of them being discussed in the article. The estimates of SpR predicted on the basis of the regression model fit well the experimentally deduced rates (Fig. 6B).
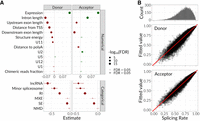
Regression model reflecting an influence of all transcript and SS features on the rate of splicing. (A) CDF-quantile regression model fitting for SS SpRs. (Left) Coefficients and significance for different numerical (top) and categorical (bottom) variables. Dots correspond to medians with lower and upper error bars showing 25% and 75% quantiles. Color corresponds to the coefficient being < or > 0. Size corresponds to −log10(FDR), and transparency corresponds to FDR being < or > 0.05. (B) The distribution of SS SpRs (top) and scatter plots demonstrating the correlations between fitted and real SpR for donor (middle) and acceptor (bottom) SS. Red line corresponds to y = x.
DISCUSSION
In this work, we aimed to determine SpRs for each donor and acceptor SS used in HeLa cells. Unlike numerous transcriptome-wide studies of splicing efficiency, determinations of SpRs are relatively sparse (Paulsen et al. 2014; Oesterreich et al. 2016; Schwalb et al. 2016; Pai et al. 2017; Wachutka et al. 2019; Drexler et al. 2020; Furlan et al. 2020). To this end, we applied nascent RNA labeling with 5-EU, one of the methods recently developed for nascent RNA labeling (Szabo et al. 2020; Chen and Good 2022). In our study, we reproduced several findings previously observed for other data sets on different species and cell types, as well as determined a number of new features that correlate with SpR. How can such data be useful? First of all, it is important to understand the potential obstacles that might slow down constitutive splicing or mechanisms that might be used for intentional splicing delay. Second, it is important to identify potential cases in which slow splicing might be beneficial for the cell. Since we determined correlations between the observed SpR and several numerical and categorical SS characteristics, we may only speculate about the causative link between the determined features and SpR.
Obvious SS features that determine the SpR are interactions with snRNAs and related, but not redundant, matching to a consensus SS sequence. Decreased pairing of the donor SS with U1 and the acceptor site with U2 snRNAs was found to significantly affect SpR. It is likely that splicing is strongly decelerated only if several important interactions of pre-mRNA with the spliceosome are lacking. Next, secondary structures may potentially sequester SS or enhance splicing via long-range interactions (Pervouchine et al. 2012; Kalinina et al. 2021). In this study, we revealed subtle and opposite correlations of SpR with local secondary structure folding energy for donor and acceptor sites. This effect might reflect a bias in GC content of the SS in adjacent introns and exons. Homo sapiens introns are known to be divided into two classes with different GC-level, shorter GC-rich, and longer GC-poor introns (Amit et al. 2012). Higher GC-content and accordingly a propensity to form stronger secondary structures is a characteristic of shorter introns, which have donor sites with higher and acceptor sites with lower SpR. Binding of RBPs might obviously speed up or delay splicing (Fig. 5A); however, in this case, interpretation of causes and consequences might not be obvious. Some proteins, which are known to be constitutive components of the splicing machinery, were found to be cross-linked to the sites that are spliced slowly. Likely in these cases, increased cross-linking efficiency might be a consequence of a delayed splicing. Moreover, some RBPs that bind RNA in the vicinity of SS might not be involved in splicing at all, regulating transcription, translation, stability, and localization of their targets instead (Van Nostrand et al. 2020). As such, we observed an elevated SpR of the targets of RBPs generally involved in translation regulation (PABPC4, LARP4, and G3BP1), which might be caused by a higher SpR of intensively translated mRNAs. Finally, even motif-based approaches are tricky, because numerous RBPs can share binding sites and compete for their targets. Taken together, the analysis of the RBPs effect on SpR using eCLIP or ATtRACT cannot be easily interpreted, and direct splicing kinetic measurements under RBP depletion are needed, as we have shown for SF3B4 knockdown. In this case, our idea appeared to be correct, namely that slow splicing of particular introns results in apparent higher association of basal splicing factors, due to higher dwelling times of the factors on an intron before its excision. At the same time, knockdown of SF3B4 resulted in a general deceleration of splicing. This deceleration was higher for introns with suboptimal BS pairing with U2 snRNA. It is likely that SF3B4, a component of U2 snRNP, normally compensates for inefficient BS-U2 snRNA recognition.
How does SpR correlate with an arrangement of introns and exons within the same primary transcript? Due to the transcription-mediated splicing delay, long introns expectedly cause a decrease in SpR of preceding donor sites. However, in agreement with other studies (Wachutka et al. 2019), acceptor sites after long introns are recognized more quickly. It might be explained by a completion of donor site recognition and probable recruitment of other spliceosome components before the synthesis of an acceptor site by the polymerase. Other explanations are also possible, such as a favorable conformation of the spliceosome for longer introns, enzymatic modification, long-range secondary structures, etc. The presence of neighboring introns favors a quicker splicing due to the cross-exon interaction (Berget 1995; Braun et al. 2018) with smaller exons increasing SpR. Such cross-exon cooperation is needed for long introns and is not significant for short introns, which are recognized across an intron. While introns excised by the minor spliceosome are removed significantly slower compared to those spliced by the major one, cross-exon cooperation is observed between both types of spliceosomes. Less obvious dependencies were observed for the excision of introns neighboring the 5′-end and poly(A) sites of a transcript. Donor site recognition is favored by a closer distance to the 5′-end, which might be explained by the interaction of the nuclear cap-binding complex with U1 snRNP (Lewis et al. 1996). At the same time, acceptor site recognition is delayed if the site is located close to the 5′-end. It might be due to a short intron length, which is unfavorable for acceptor site recognition, or due to other reasons. Splicing of the last intron is decelerated for the transcripts with a longer distance between the intron and poly(A) site. Here, at least two nonexclusive explanations are possible. One is that cleavage and polyadenylation machinery binding speed up the splicing of the preceding intron (Martinson 2011; Huang et al. 2023), so longer distances between the last acceptor sites and polyadenylation sites are unfavorable for this cooperative interaction. Another explanation switches the cause and the consequence. It is known that donor site interaction with U1 snRNP suppresses downstream polyadenylation (Gunderson et al. 1998; Berg et al. 2012; Langemeier et al. 2013; So et al. 2019). If a particular mRNA requires a long 3′ UTR, slow utilization of the last acceptor site might be required to suppress potential poly(A) sites in the 3′ UTR to give RNAP II sufficient time for transcription.
Cause and consequences are also unclear for the observed slow excision of introns from pre-lncRNAs. On one hand, lncRNAs might not be under strict evolutionary pressure for quick splicing that might explain an accelerated splicing of the highly expressed genes and genes for the housekeeping proteins which we and others (Ding and Elowitz 2019) observed. On the other hand, many lncRNAs might function cotranscriptionally, for example, as enhancer RNAs (Syed and Hon 2021) and their unspliced form might be the one required for their function. Alternative splicing is a clear case where deceleration of intron removal should be beneficial. Otherwise, a strong bias for utilization of the first alternative SS which would be transcribed earlier might be envisioned. In this work, we observed that alternative splicing events are associated with decreased SpR. Using the data on the splicing isoform ratio deduced from the steady-state transcriptome of our samples, we observed that uneven usage of alternative SS correlates well with the corresponding SpR, that is, the alternative splicing is generally under a kinetic control. A generally unwanted consequence of splicing deceleration might be an increase in trans-splicing ratio. If an SS is long-lived it would have more chances to be spliced with an unrelated transcript, which is exactly what we observed.
In conclusion, we identified many correlations between the features of the primary transcript and SpR of particular SS. It allowed us to create a regression model of all these factors where we could directly compare their relative influence on the rate of splicing. A correlative study like this one gives rise to hypotheses regarding potential causative links between slow splicing and transcript properties, which might be addressed experimentally in studies that follow.
MATERIALS AND METHODS
Cell culture
We used human cervical adenocarcinoma cell line HeLa S3. Cells were cultured at 37°C, 5% CO2 in DMEM/F12 (Gibco 11320033), containing 10% FBS (Gibco 16000044), 100 U/mL of penicillin, and 100 µg/mL of streptomycin (Gibco 15140122) with 1% glutaMAX (Gibco 35050061) included. Harvesting was performed by scraping when reaching 70%–80% confluence.
SF3B4 knockdown
Based on Hela S3 cells, >80% knockdown of the SF3B4 gene was obtained (sense siRNA: GCAGUACCUCUGUAACCGU, antisense siRNA: ACGGUUACAGAGGUACUGC). A working siRNA duplex for operation was prepared by dissolving sense and antisense siRNA in mQ water with 48 µM NaOAc, to a final concentration each of 10 µM. The resulting mixture was heated for 5 min at 95°C and then cooled slowly (0.1°C each 6 sec) to room temperature. The final duplex was transfected into cells using Lipofectamine RNAiMAX (Invitrogen 13778075), according to the manufacturer's recommendations, so that 1 mL of medium contained 300,000 cells and 3 nM duplex. To obtain the maximum effect, transfection was carried out twice with a difference of 2 days; 24 h after the second transfection, cells with knockdown were used simultaneously with intact Hela S3 for EU-RNA labeling. After RNA isolation, the knockdown efficiency was determined with RT-qPCR (forward primer: CCTCCATTCGGATCTCCCATGG, reverse primer: GTCCACGCATACCATGCGGA).
In vivo EU labeling
HeLa S3 cells were resuspended before labeling at a concentration of 1 million/mL. EU was added to the culture media to the concentration of 0.5 mM (200 mM EU in DMSO stock solution stored at −20°C). Cells were incubated with the EU for 10/20 min (kinetic points) or 24 h (control samples). After incubation, cells were harvested, separated from the medium and immediately resuspended in 300 µL of QIAzol lysis reagent (QIAGEN 79306) per 1 million cells. RNA samples were extracted following the manufacturer's instructions for QIAzol reagent.
Labeled RNA extraction
Nascent RNA labeled with EU was purified using Click-iT Nascent RNA Capture Kit (Invitrogen C10365), following the protocol described (Palozola et al. 2021), with minor adjustments. In brief, RNA was biotinylated using the click reaction. Each reaction was carried out in 20 µL, which contained 4 mg of total RNA and 1 mM biotin azide; other reagents were calculated accordingly. After 30 min of incubation, 0.5 µL of UltraPure Glycogen (Invitrogen 10814010), 20 µL of 7.5 M ammonium acetate, and 280 µL of chilled 100% ethanol were added to each reaction. The mixture was incubated overnight at –70°C for RNA precipitation. After centrifugation (13,000 g 4°C for 20 min) and washing (two times with 280 μL of 75% ethanol with centrifugation at 10,000 × g 4°C for 10 min), RNA was resuspended in Milli-Q water. One thousand nanograms of biotinylated RNA was added to prewashed streptavidin beads (5 µL beads per 1000 ng RNA). The beads were washed very thoroughly: five times with washing buffer one and five times with washing buffer two to remove unlabeled RNA. Beads were left for at least 5 min in 50 µL of washing buffer at 4°C with gentle vortexing at each washing step. RNA captured on the beads was immediately used for cDNA synthesis.
Poly(A) RNA sample preparation
To obtain control samples, HeLa S3 cells were grown to a concentration of approximately 1 million/mL (about 40% confluence). Then, cells were harvested and immediately dissolved in 300 μL QIAzol lysis reagent (QIAGEN 79306) per 1 million cells.
Library preparation
NEBNext Ultra II RNA Library Prep Kit for Illumina (NEB E7770) was used for library preparation. Beads were mixed with First Strand buffer, Random Primer, and water according to protocol and incubated at 94°C for 12 min to get longer RNA fragments. All other steps were performed according to the protocol.
RNA-seq processing
Demultiplexed fastq files from Illumina were deposited into the Sequence Read Archive (SRA) database under accession number PRJNA1030001. Next, reads were processed using TrimGalore (v.0.6.6) to remove adapters and low-quality bases, followed by filtering them by the minimal length of 20 nucleotides (nt) (Krueger et al. 2023). After a quality check performed using FastQC (v.0.11.9), we generated human genome GRCh38 indices with STAR (v.2.7.10) ‐‐runMode genomeGenerate using gencode comprehensive annotation (v.42) and mapped processed reads with ‐‐twopassMode parameter set to Basic and other options set as in the ENCODE standard long RNA-seq pipeline (see STAR manual) (Dobin et al. 2013; Frankish et al. 2021). Additionally, STAR-Fusion default parameters were added to identify chimeric reads that included ‐‐chimSegmentMin 12, ‐‐chimJunctionOverhangMin 8, ‐‐chimOutJunctionFormat 1, ‐‐alignSJstitchMismatchNmax 5 -1 5 5, ‐‐chimMultimapScoreRange 3, ‐‐chimMultimapNmax 20, ‐‐chimScoreJunctionNonGTAG -4, ‐‐chimNonchimScoreDropMin 10, and ‐‐alignInsertionFlush Right.
To estimate the fraction of exon-spanning reads, gene counting was performed using featureCounts from the Rsubread package (v.2.12.0) (Liao et al. 2019). First, we left only uniquely mapped reads with samtools (v.1.3.1) -q 255 and filtered out those that mapped to the genes of small and repeated RNAs (i.e., rRNAs, miRNAs, snoRNAs, snRNAs, scaRNAs, scRNAs, tRNAs, and vaultRNAs), according to gencode comprehensive (v.42), RNA atlas small RNA annotation, UCSC RepeatMasker, sno/miRNA, and tRNA tracks (Karolchik 2004; Danecek et al. 2021; Lorenzi et al. 2021). For this, we used bedtools (v.2.30.0) intersected with -split, -v, and -f 0.9 (minimal fraction of read being overlapped by small RNA) options (Quinlan and Hall 2010). Second, gene-level and exon-level coverages were calculated with featureCounts allowMultiOverlap = T and GTF.featureType = “gene” or GTF.featureType = “exon”, respectively, using the same gencode comprehensive annotation as in the mapping step. Finally, genes having nonzero total number of reads in every sample and at least three counts per million mapped reads (cpm) in any sample were left for each time point separately, followed by the exonic reads fraction calculation.
All the plots presented in the paper were built with R package ggplot2 (v.3.4.0). Principal component analysis was performed based on the gene-level exonic read counts for 21,914 genes that pass the expression filter of at least 3 cpm in three or more samples, using fviz_pca_ind from the R package factoextra (v.1.0.7).
Splicing kinetics estimation
To estimate splicing kinetics on the level of individual SS, the fraction of nonspliced reads among all the reads crossing the site was calculated for each SS separately using the R package FRASER (v.1.10.0) (Mertes et al. 2021). For this, bam files containing uniquely mapped reads were imported in R using FraserDataSet function followed by read counting performed by countRNAData with keepNonStandardChromosomes = FALSE, filter = FALSE, and BSgenome.Hsapiens.UCSC.hg38 genome (v.1.4.4). Next, Θ values, which reflect the fraction of nonspliced reads crossing SS, were calculated for each SS with the calculatePSIValues function used by default. Finally, SpR for 10 and 20 min was calculated as 1 – (Θ10/20min – Θ24h) to estimate how closely the SS splicing state for the time point reaches the 24 h state. Additionally, we corrected SpR by multiplying it by 1 – Θ24h to account for the intron retention events (Supplemental Fig. S2A,B). Thus, the resulting formula for SpR that takes values between 0 and 1 can be rewritten as 1 – Θ10/20min + Θ10/20min * Θ24h – Θ224h. In addition to the SpR estimates, we calculated their standard errors based on three biological replicates using error propagation as SE2SpR = ((Θ24h – 1)2 * σ2Θ,10/20min + (Θ10/20min – 2Θ24h)2 * σ2Θ,24h)/3. Only 57,381 SS from 33,850 junctions that had at least 10 cpm (i.e., 10 spliced reads for the smallest data set) in one or more WT kinetic point samples and a nonzero number of spliced reads across all WT 24 h replicates (i.e., junction is definitely functional) were used in further analysis, resulting in 28,589 GT-, GC-, or AT-donor and 28,792 AG- or AC-acceptor sites. This expression filter results in 88% of SS being covered by ≥100 reads in total for all samples.
Assigning splice sites to isoforms
For further SS annotation and analysis, each SS was assigned to the most expressed transcript it intersects with. In particular, Salmon (v.1.9.0) quant was used with the −l U option to estimate average TPM for each transcript (Patro et al. 2017). Next, we intersected each SS with the exon start or end coordinates according to gencode comprehensive annotation using bedtools intersect with -s option. Finally, the isoform with the highest mean TPM value across 10- and 20-min kinetic points and steady state, as well as the corresponding exon, was assigned to each SS, enabling the estimation of the intron and exon lengths, relative position, distance to transcription start and polyadenylation sites, expression, and other characteristics.
Obtaining splice sites sequences
To annotate SS with their sequences, BSgenome.Hsapiens.UCSC.hg38 was used together with the getSeq function from BSgenome (v.1.66.1), thus enabling us to identify the SS type and the nucleotide sequence surrounding the site, as well as to create logos and calculate snRNA complementarity. The latest was done by summarizing the number of complementary pairs (AT, GC, GT) between certain regions of the snRNA and SS. Thus, the snRNA sequence 3′-GTCCATTCATA-5′ was used for U1 complementarity estimation with the [−3, 7] region of the donor SS (considering G in GT-donor SS to be 0, e.g., AAGGTATGGGT). Other snRNAs included: 3′-TCATTTTC-5′ and [−8, −1] for U5, 3′-AGACATAGC-5′ and [1, 9] for U6, 3′-GGGAAAA-5′ and [3, 9] for U11, 3′-AGAGGAAAG-5′ and [1, 9] for U6atac. To calculate the complementarity to U2 and U12 snRNAs, branch point locations and sequences were determined using predictBranchpoints from the branchpointer R package (v.1.24.0) with the BSgenome.Hsapiens.UCSC.hg38 genome, and the acceptor SS coordinates extended by 200 nt upstream (Signal et al. 2018). As a result, branchpointer identified 24,114 branch points out of 28,792 acceptor SS (84%), and the nucleotide sequences of the identified branch points from −5 to 2 (except for the 0-positioned A) were used together with the 3′-ATGATGT-5′ and 3′-GGAATGA-5′ snRNA sequences for U2 and U12 complementarity estimation, respectively. Sequence logos were generated using the R package ggseqlogo (v.0.1) (Wagih 2017). Additionally, we used MaxEntScan to obtain scores for donor and acceptor SS using their sequences of 9 and 23 nts, respectively (Yeo and Burge 2004).
Since SS dinucleotide composition is not enough to determine the spliceosome type it is recognized by, we used intron annotation from the Intron Annotation and Orthology Database (IAOD) (Moyer et al. 2020) to intersect it with donor and acceptor SS, using bedtools intersect -s and eventually divided SS into those recognized by major and minor spliceosomes.
Annotating splice sites
Secondary structure and energy predictions were obtained based on the 50-nt sequences surrounding the SS using CentroidFold (v.0.0.16) with -g 4 weight and -e “McCaskill” engine as in CentroidFold web server defaults (Sato et al. 2009).
Chimeric read fractions were calculated using bedtools intersect to relate the chimeric reads break points to the SS, leaving only the reads which had both break ends intersected. The fractions were then estimated for each SS separately as the total number of reads obtained on the previous step for 10- and 20-min kinetic points, and steady state divided by the sum of these reads and the normally spliced reads from all the junctions formed by this SS.
To identify SS that could be subjected to alternative splicing (MXE, and exon skipping, SE), we used the external databases Kassiopeia (Hatje and Kollmar 2014) and ExonSkipDB (Kim et al. 2019). In particular, the MXE and SE events hg19 coordinates obtained from the databases were liftovered to hg38 and intersected with the gencode annotation used in this study using bedtools intersect, with -s -f 0.9 -r options defining the minimal strand-specific reciprocal overlap fraction to be 0.9. To annotate SS with 5′ and 3′ alternative splicing events, we used ALTssDB (Carranza et al. 2022), leaving only alternative SS that were covered by at least 10% of reads. Next, these SS and their preferred competitors were intersected with SS annotation used in the current study with bedtools intersect -s, resulting in 178 SS annotated as preferred and 26 SS annotated as alternative sites.
Additionally, we performed alternative splicing events analysis with rMATS (v.4.1.2) (Wang et al. 2024) using steady-state WT samples, gencode comprehensive annotation (v.42), ‐‐readLength set to 100, and ‐‐variable-read-length enabled.
Statistical analysis of splicing rate dependencies
To estimate the significance of the differences in SpR depending on the specific characteristic, we used the ART followed by anova from the R package ARTool (v.0.11.1) (Elkin et al. 2021). The zero/one inflated quantile Kumaraswamy regression model was fitted using cdfquantregH of the R package cdfquantreg (v.1.3.1) (Shou and Smithson 2019). All the independent variables were used to predict the first shape model parameter (location), zero and one components were based on 27,560 values for donor SS, and 23,400 values for acceptor SS included: complementarity to the particular snRNA, spliceosome type, alternative splicing events, secondary structure energy, chimeric reads fraction, log expression level, log distances from the TSS and to the poly(A) site, log lengths of the intron, upstream and downstream exons, and transcript type. Categorical variables were transformed into indicator variables, and numerical variables were standardized; no interaction terms were used. To exclude highly correlated features from the regression model, Pearson correlation coefficients were calculated between all independent variables. The results of this procedure are shown in Supplemental Figure S5, and they suggest strong positive correlations (PCC > 0.5) between the presence of the neighboring introns and the distances from TSS or poly(A). Moreover, the distance to poly(A) strongly correlates with the intron length for donor SS (Supplemental Fig. S5A), whereas in the case of acceptor SS, intron length had a stronger correlation with the distance from TSS (Supplemental Fig. S5B). Finally, SS sequence complementarities to U11 and U6atac snRNAs (as well as U1 and U6) were also strongly correlated. Taking into account these correlations, we removed the presence of the neighboring introns and complementarity to U6/U6atac snRNAs from the feature list, and we left only the distance from TSS for donor SS and to poly(A) for acceptors as well.
The effect of individual nucleotides on splicing was estimated by comparing for each position, independently, the SpR estimates between the SS with consensus nucleotides and with a certain substitution. The comparison was performed with a Wilcoxon rank sum test followed by Benjamini–Hochberg FDR correction.
The GSEA of the genes containing SS with high or low SpR was performed with the R package fgsea (v.1.24.0) using the gene sets from MSigDB (Liberzon et al. 2011; Korotkevich et al. 2021).
Assessing the influence of RNA-binding proteins on the splicing rate
Estimation of the RBPs effect on the SS SpR was performed using either the enhanced CLIP (eCLIP) peaks from the ENCODE or the RBP's binding motifs from the ATtRACT database (Giudice et al. 2016; Van Nostrand et al. 2020). The first approach included the intersection of the IDR thresholded eCLIP peaks with the 50 nt SS regions, using bedtools intersect -s. Because the ability of immunoprecipitation techniques to detect target RNAs strongly depends on their abundances, we ranked target SS by their transcript expression and generated the corresponding control group by selecting a new nontarget site for each target SS ranked directly before or after it (chosen randomly each time). This procedure resulted in control groups of the same sizes as the target ones. Wilcoxon rank sum test was performed separately for each RBP and donor or acceptor SS with the subsequent Benjamini-Hochberg FDR correction. The second approach included filtering ATtRACT motifs to include only unmutated proteins from humans with at least 5 nt motifs, followed by searching for the exact match between the motif and the subsequence within the SS region of 50 nt. To estimate the effect of the RBPs on the SS SpR based on ATtRACT, a Wilcoxon rank sum test between the SpR of the SS bound or not bound by the particular RBP was used, followed by Benjamini–Hochberg FDR multiple testing correction.
DATA DEPOSITION
Sequencing data are available under accession number PRJNA1030001.
SUPPLEMENTAL MATERIAL
Supplemental material is available for this article.
ACKNOWLEDGMENTS
We are thankful to Zoe Chervontseva, Dmitri Pervouchine, and laboratory members for discussions. This work was supported by the Russian Science Foundation grant 21-64-00006 (O.A.D.). Work on the revision (SF3B4 knockdown, 24h 5-EU labeling and analysis) was supported by the Russian Science Foundation grant 24-14-00048 (P.V.S.) and Moscow State University grants for equipment (SeqStudio and CelenaX).
Author contributions: A.K.B.: Investigation, methodology, writing—original draft, writing—review and editing. A.I.B.: Investigation, methodology, writing—original draft, writing—review and editing. S.S.M.: Supervision. A.Y.R.: Resources. D.S.C. and A.M.M.: Investigation. E.B.P.: Supervision. O.A.D.: Supervision, funding acquisition. P.V.S.: Supervision, conceptualization, writing—review and editing.
Footnotes
-
Article is online at http://www.rnajournal.org/cgi/doi/10.1261/rna.079937.123.
- Received December 31, 2023.
- Accepted July 8, 2024.
This article is distributed exclusively by the RNA Society for the first 12 months after the full-issue publication date (see http://rnajournal.cshlp.org/site/misc/terms.xhtml). After 12 months, it is available under a Creative Commons License (Attribution-NonCommercial 4.0 International), as described at http://creativecommons.org/licenses/by-nc/4.0/.
REFERENCES
MEET THE FIRST AUTHORS


Meet the First Author(s) is an editorial feature within RNA, in which the first author(s) of research-based papers in each issue have the opportunity to introduce themselves and their work to readers of RNA and the RNA research community. Anastasiia Bolikhova and Andrey Buyan are co-first authors of this paper, “Study of the RNA splicing kinetics via in vivo 5-EU labeling.” Anastasiia graduated last year from the Faculty of Bioengineering and Bioinformatics of Lomonosov Moscow State University and currently is a PhD student at the Skolkovo Institute of Science and Technology, where her work is devoted to the study of RNA maturation. This topic includes mRNA splicing and polyadenylation kinetics, as well as features of noncoding RNA maturation. Andrey is currently working on his PhD at the Institute of Protein Research, Russian Academy of Sciences, as a member of a group studying protein synthesis regulation. His research is focused on regulatory genomics, in particular the allele-specific activity of human transcribed regulatory elements.
What are the major results described in your paper and how do they impact this branch of the field?
The first important result of this work is the proposal of a new method for determining the rate of RNA splicing using only two kinetic points and an accessible formula. The dependencies obtained with the described method correspond well to those shown previously in other works. However, this is not only a methodological study; we also improve the understanding of splicing by assessing how donor and acceptor SpRs are related to the biological pathways of the corresponding RNA product, upstream and downstream exon lengths, distance to poly(A) ends, cross-exon spliceosome recognition and alternative splicing. Besides our observations made for wild-type cells, we evaluated SpR changes under SF3B4 knockdown.
What led you to study RNA or this aspect of RNA science?
AKB: I began developing the protocol for determining RNA SpRs as part of a project devoted to studying snRNA methyltransferases, but over time, I turned more and more attention to the RNA maturation process itself.
AIB: My bachelor's thesis was focused on enhanced CLIP reanalysis as a part of the FANTOM6 project. Thus, studying RNA-protein interactions paved the way for me into the international scientific community and allowed me to become a member.
What are some of the landmark moments that provoked your interest in science or your development as a scientist?
AKB: Since childhood, I have been a fan of the books of Belyaev and the Strugatsky brothers, and it was there that I found my image of a scientist.
AIB: I have always been inspired by the nature around me and wanted to know more about it. One day, while vacationing in Altea, Spain, I climbed a hill, met a wonderful sunset and thought, “All this beauty is worth exploring.”
If you were able to give one piece of advice to your younger self, what would that be?
AKB: Don't judge yourself too harshly, everything will come in due time; just enjoy the moment.
AIB: Calculate your forces correctly and take care of your health.
Are there specific individuals or groups who have influenced your philosophy or approach to science?
AKB: I have always been inspired by mid-20th century scientists. The development of methods at this time was incomparably less than now; nevertheless, most of our basic knowledge about biology was formed at this time. I like to read articles from the 1960s and 1970s to remind myself to be creative and think outside the box.
What were the strongest aspects of your collaboration as co-first authors?
Being specialized in bioengineering and bioinformatics, we are enthusiastic about different parts of our study, and this is the key to success. While Anastasiia carefully handled the experimental work, Andrey focused on data analysis, and we both contributed to the hypothesis generation. Without a doubt, such cooperation allowed us to significantly improve the resulting article.




