


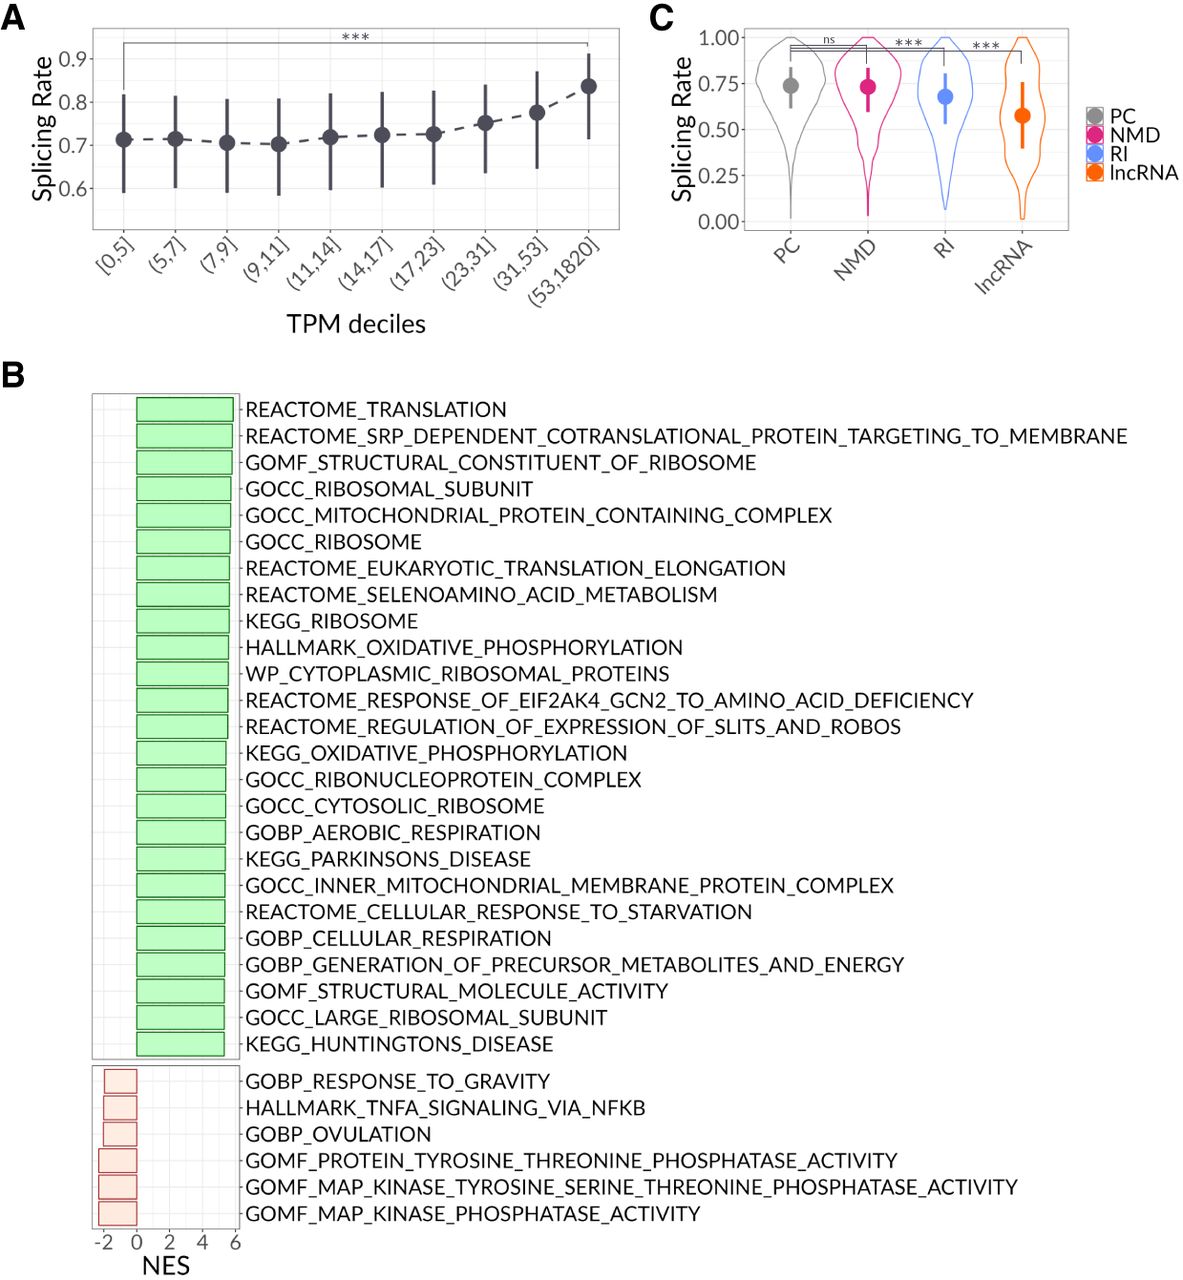
FIGURE 2.
Dependency of the SpR on the general features of the transcript. (A) SpR association with the expression levels binned into TPM deciles, aligned rank transform (ART) ANOVA P-value < 10−15. Dots correspond to medians with lower and upper error bars showing 25% and 75% quantiles. Dashed line represents the overall median tendency. (B) Significant pathways from SpR-based GSEA ordered by normalized enrichment score (NES). Color corresponds to NES < or > 0. (C) SpR for different RNA types, ART ANOVA P-value < 10−15. The significance of the Tukey test between groups is depicted as (*) for P < 0.05, (**) for P < 0.01, and (***) for P < 10−4, (ns) nonsignificant.




