


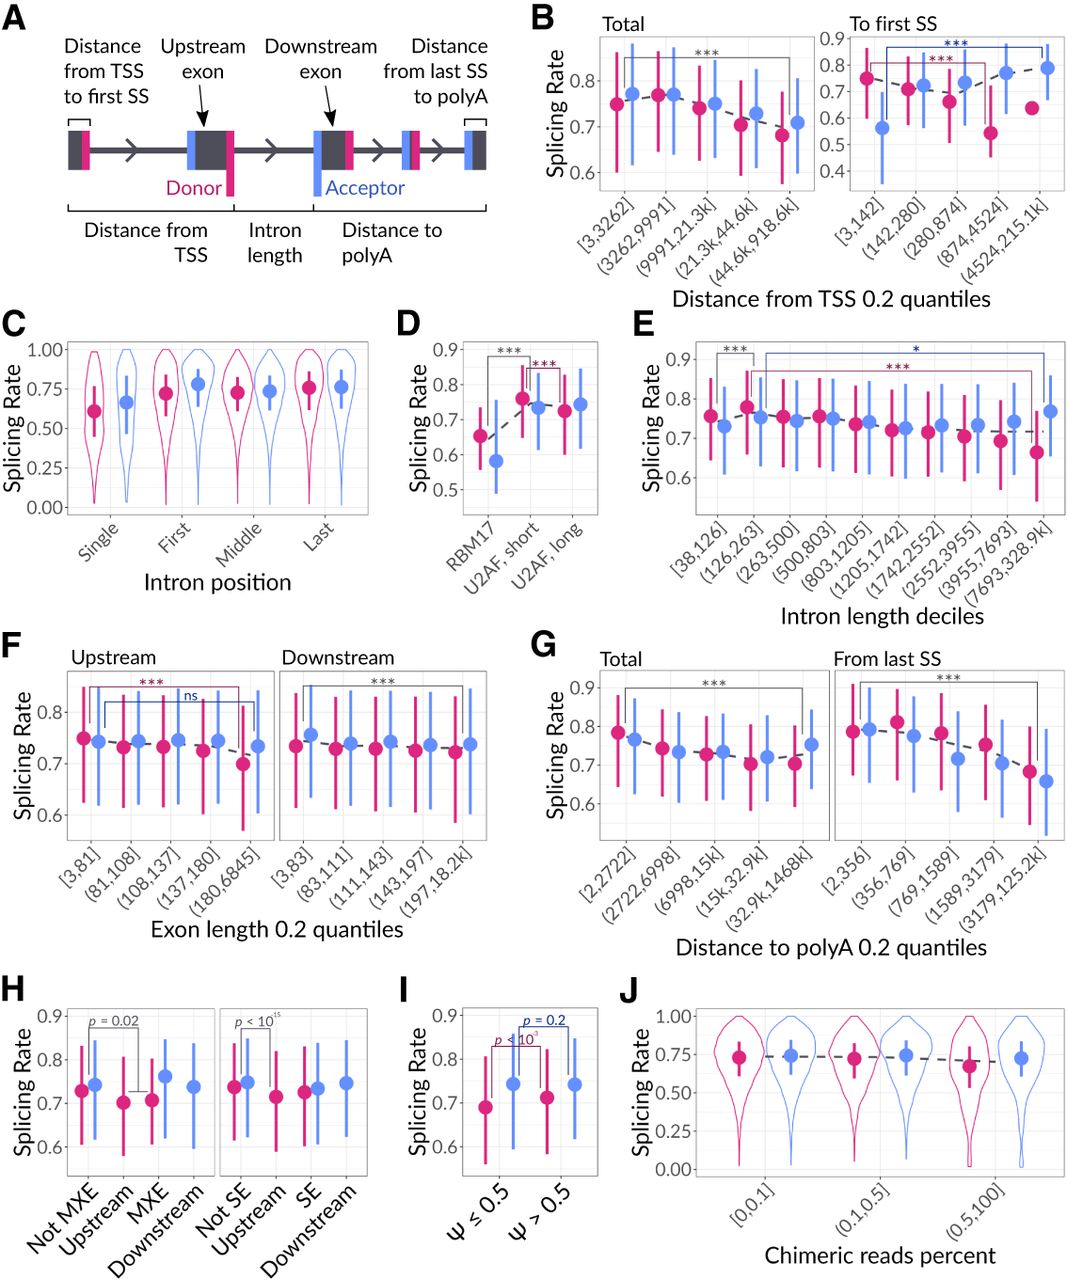
Dependency of the SpR on the SS position relative to other transcript elements. (A) Scheme representing how various donor and acceptor SS characteristics were determined. (B) Dependency of the SpR on the distance from TSS for all (left panel) and 5′-most SS (right panel). Considering all SS, ART ANOVA P-value < 10−15 for distance from TSS and 4 × 10⁻⁸ for SS type (*) distance interaction terms. In the case of 5′-most SS, ART ANOVA P-value = 10−4 for distance and 4 × 10⁻¹² for SS type (*) distance interaction term. Dots correspond to medians with lower and upper error bars showing 25% and 75% quantiles. Dashed line represents the overall median tendency. Color corresponds to donor and acceptor SS. (C) SpR for SS with different relative locations in the transcript. ART ANOVA P-value < 10−15 for both SS position and SS type (*) SS position interaction terms, one-sided Wilcoxon rank sum test P-value < 10−32 for single versus other SS and < 10−25 for acceptor versus donor SS in the first intron. (D) Dependency of the SpR on the intron length (≤ or > 134 nt) and RBM17-dependency. ART ANOVA P-value = 2 × 10⁻¹² and < 10−15 for splicing mechanism and SS type (*) mechanism interaction terms, respectively. (E) Dependency of the SpR on the intron length. ART ANOVA P-value < 10−15 for both intron length and SS type (*) intron length interaction terms. (F) Dependency of the SpR on the adjacent exon's lengths. Regarding the upstream exon length, ART ANOVA P-value < 10−15 and < 10−13 for exon length and SS type (*) exon length interaction terms, respectively. For the downstream exons, ART ANOVA P-value = 10−11 for exon length only. (G) Dependency of the SS SpR on the distance to poly(A) site for all (left panel) and 3′-most introns (right panel). ART ANOVA P-value < 10−15 for both distance and SS type (*) distance interaction terms in the case of all SS, whereas for SS corresponding to the last introns, these values are <10−15 and 0.038, respectively. (H) SpR for constitutive exons and exons annotated as alternatively spliced. Left panel corresponds to mutual exon exclusion events, whereas the right panel corresponds to exon skipping. The significance estimates shown on top correspond to one-sided Wilcoxon rank sum test P-values. (I) SpR for donor and acceptor SS located upstream and downstream from the SE, respectively. (X-axis) Percent spliced in calculated with rMATS. P-values were calculated using a one-sided Wilcoxon rank sum test. (J) SpR for SS with different percent of chimeric reads. ART ANOVA P-value = 4 × 10⁻⁸ for chimeric reads fraction and 9 × 10⁻⁴ for SS type (*) chimeric reads fraction interaction terms, one-sided Wilcoxon rank sum test P-value = 10−5 for the first bin (0%–0.1%) versus the others. The significance of the Tukey test between groups is depicted as (*) for P-value < 0.05, (**) for P < 0.01, and (***) for P < 10−4, (ns) nonsignificant.




