


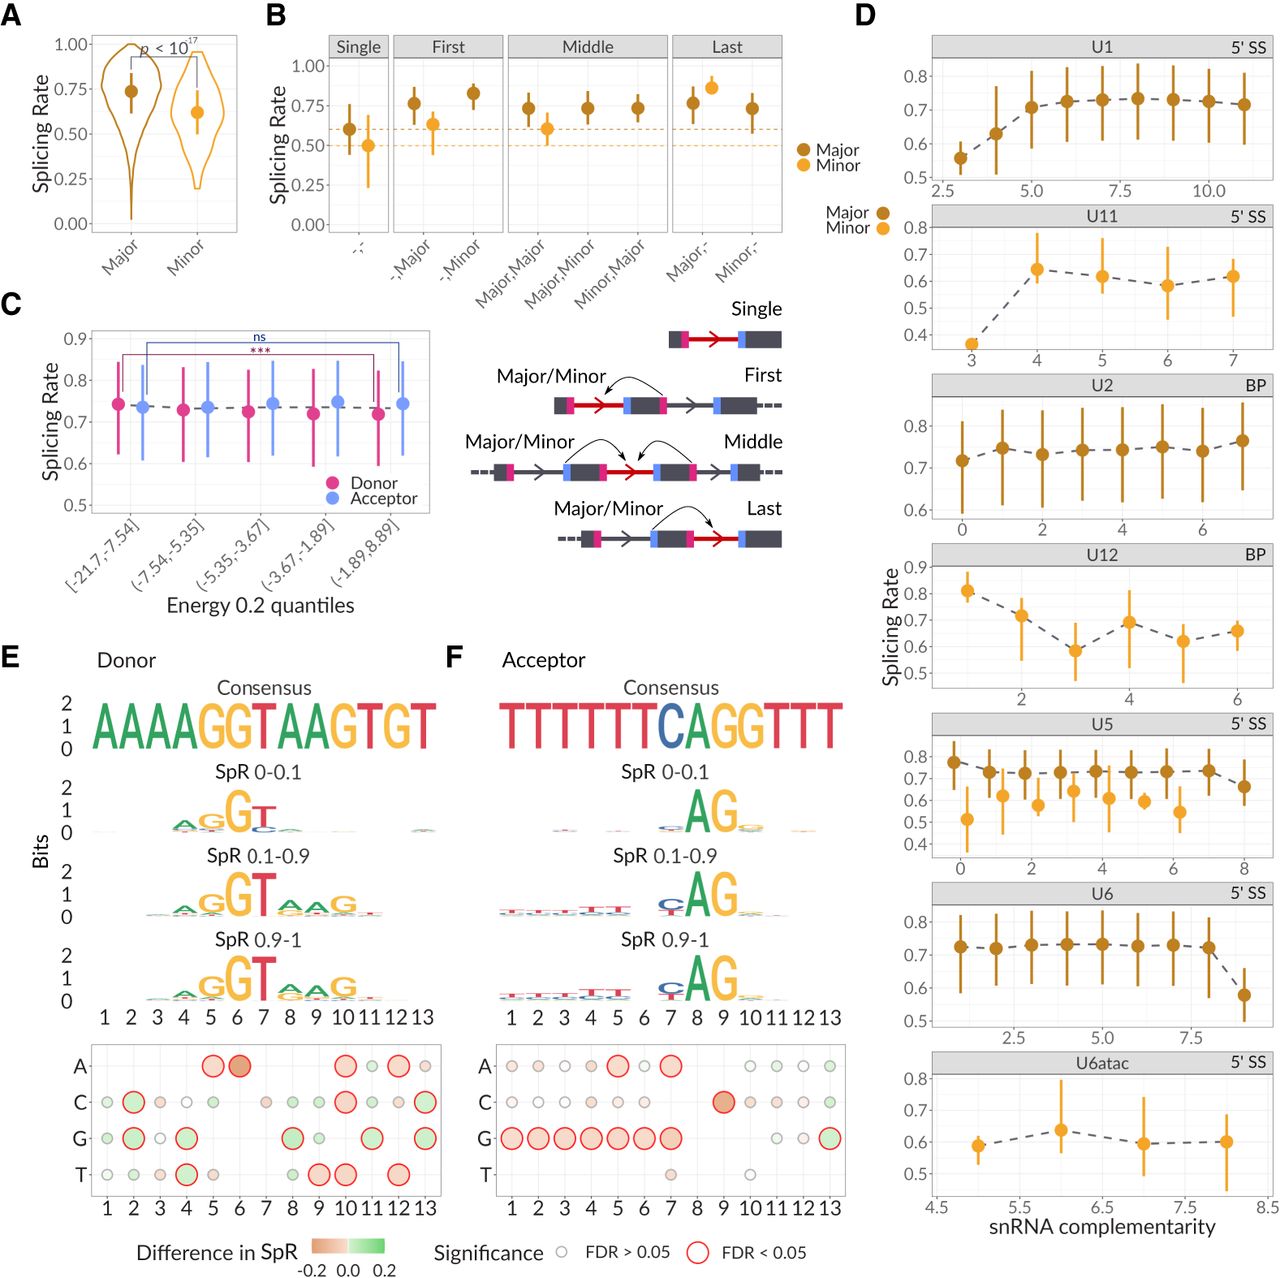
SS properties influencing SpR. (A) SpR for SS recognized by major (brown) and minor (orange) spliceosomes. Dots correspond to medians with lower and upper error bars showing 25% and 75% quantiles. One-sided Wilcoxon rank sum test P-value < 10−17 for major versus minor spliceosome. (B, top) SS SpR dependency on the presence of the neighbor splice junctions. (Bottom) Scheme representing the SS categories depicted in the top subpanel. Color scheme is the same as in (A). One-sided Wilcoxon rank sum test P-value < 10−124 and 0.03 for single versus nonsingle SS recognized by major and minor spliceosomes, respectively. (C) Dependency of the SpR on the secondary structure energies in kcal/mol. Dashed line represents the overall median tendency. ART ANOVA P-value = 0.03 for energy and < 10−14 for SS type (*) energy interaction term. (D) Dependency of the donor and acceptor SS SpR on the complementarity to various snRNAs, color scheme is the same as in (A). The only two significant ART ANOVA P-values included = 0.005 for U1 complementarity and 2 × 10⁻⁴ for U2 complementarity. (E, F, top) Donor (E) and acceptor (F) consensus sequences and logos for SS with SpR corresponding to different SpR bins: slow (0–0.1), medium (0.1–0.9), and fast (0.9–1). (Bottom) Heatmap representing the effects of single nucleotide substitutions on the SpR. Fill color corresponds to the difference in SpR medians between SS containing consensus and nonconsensus nucleotides; line color and size correspond to Wilcoxon rank sum test FDR < 0.05. The significance of the Tukey test between groups is depicted as (*) P-value < 0.05, (**) for P < 0.01, and (***) for P < 10−4, (ns) nonsignificant.




