


SAFB associates with nascent RNAs and can promote gene expression in mouse embryonic stem cells
- Rachel E. Cherney1,2,3,4,
- Quinn E. Eberhard1,2,3,5,9,
- Gilbert Giri1,2,3,5,9,
- Christine A. Mills1,6,9,
- Alessandro Porrello2,3,9,
- Zhiyue Zhang7,8,9,
- David White7,8,
- Jackson B. Trotman1,2,3,
- Laura E. Herring1,6,
- Daniel Dominguez1,2,3 and
- J. Mauro Calabrese1,2,3
- 1Department of Pharmacology, University of North Carolina at Chapel Hill, Chapel Hill, North Carolina 27599, USA
- 2RNA Discovery Center, University of North Carolina at Chapel Hill, Chapel Hill, North Carolina 27599, USA
- 3Lineberger Comprehensive Cancer Center, University of North Carolina at Chapel Hill, Chapel Hill, North Carolina 27599, USA
- 4Curriculum in Genetics and Molecular Biology, University of North Carolina at Chapel Hill, Chapel Hill, North Carolina 27599, USA
- 5Curriculum in Bioinformatics and Computational Biology, University of North Carolina at Chapel Hill, Chapel Hill, North Carolina 27599, USA
- 6Proteomics Core Facility, University of North Carolina at Chapel Hill, Chapel Hill, North Carolina 27599, USA
- 7Department of Biology, University of North Carolina at Chapel Hill, Chapel Hill, North Carolina 27599, USA
- 8Department of Computer Science, University of North Carolina at Chapel Hill, Chapel Hill, North Carolina 27599, USA
- Corresponding author: jmcalabr{at}med.unc.edu
-
↵9 These authors contributed equally to this work.
Abstract
Scaffold attachment factor B (SAFB) is a conserved RNA-binding protein that is essential for early mammalian development. However, the functions of SAFB in mouse embryonic stem cells (ESCs) have not been characterized. Using RNA immunoprecipitation followed by RNA-seq (RIP-seq), we examined the RNAs associated with SAFB in wild-type and SAFB/SAFB2 double-knockout ESCs. SAFB predominantly associated with introns of protein-coding genes through purine-rich motifs. The transcript most enriched in SAFB association was the lncRNA Malat1, which also contains a purine-rich region in its 5′ end. Knockout of SAFB/SAFB2 led to differential expression of approximately 1000 genes associated with multiple biological processes, including apoptosis, cell division, and cell migration. Knockout of SAFB/SAFB2 also led to splicing changes in a set of genes that were largely distinct from those that exhibited changes in expression level. The spliced and nascent transcripts of many genes whose expression levels were positively regulated by SAFB also associated with high levels of SAFB, implying that SAFB binding promotes their expression. Reintroduction of SAFB into double-knockout cells restored gene expression toward wild-type levels, an effect again observable at the level of spliced and nascent transcripts. Proteomics analysis revealed a significant enrichment of nuclear speckle-associated and RS domain-containing proteins among SAFB interactors. Neither Xist nor Polycomb functions were dramatically altered in SAFB/2 knockout ESCs. Our findings suggest that among other potential functions in ESCs, SAFB promotes the expression of certain genes through its ability to bind nascent RNA.
Keywords
INTRODUCTION
Scaffold attachment factor B (SAFB) is an RNA-binding protein that has been implicated in multiple molecular processes including the regulation of transcription, splicing, and chromatin structure (Garee and Oesterreich 2010; Norman et al. 2016). SAFB was originally identified as a chromatin-associated protein that could bind specific DNA sequences in vitro and repress transcription from an estrogen-responsive promoter upon its transient over-expression (Renz and Fackelmayer 1996; Oesterreich et al. 1997). Whether SAFB associates with DNA in vivo remains an open question. However, SAFB contains an RNA recognition motif (RRM) and an RGG/RG motif, both of which are known RNA-binding domains (Corley et al. 2020). Moreover, in vivo, SAFB has been shown to colocalize with other RNA-binding proteins, copurify with mRNA, and bind RNA sequences that are purine rich, solidifying its role as an RNA-binding protein (Nayler et al. 1998; Weighardt et al. 1999; Arao et al. 2000; Baltz et al. 2012; Castello et al. 2012; Hong et al. 2015; Rivers et al. 2015). SAFB has also been implicated in regulating the response to heat shock in human cells, where along with other RNA-binding proteins, it becomes enriched in nuclear condensates centered around specific satellite RNAs (Aly et al. 2019). Additionally, SAFB plays a role in the nuclear retention of unspliced RNAs (Ron and Ulitsky 2022) and has been shown to be important for the maintenance of heterochromatin in mouse and human cells, possibly through its ability to associate with specific RNAs (Huo et al. 2020; McCarthy et al. 2021).
Consistent with the involvement of SAFB in more than one fundamental cellular process, SAFB is required for proper mouse development. While SAFB null embryos can survive to term, most die before or shortly after birth, and in surviving animals, pleiotropic abnormalities that include defects in the endocrine system persist throughout life (Ivanova et al. 2005). SAFB also has a paralog, SAFB2, which shares an overall domain structure with and is similar in sequence to SAFB but whose loss does not cause embryonic lethality (Jiang et al. 2015). Still, SAFB2 is highly expressed in the male reproductive tract, where it may play important roles in endocrine signaling (Jiang et al. 2015). SAFB2 is also important in the processing of several miRNAs (Hutter et al. 2020).
Despite the roles of SAFB in development, its RNA targets have not been profiled in early embryonic tissues or cell lines derived from them. Herein, we describe the generation of SAFB and SAFB2 double-knockout (DKO) mouse embryonic stem cells (ESCs) and data from subsequent RNA immunoprecipitation (RIP) and RNA-seq experiments that identify the RNAs associated with SAFB in ESCs. We also perform mass spectrometry-based proteomics to identify the proteins associated with SAFB and a separate chromatin-associated RNA-binding protein, HNRNPU. Our findings are consistent with prior studies that link SAFB to multiple molecular processes and also suggest a new function for SAFB in gene activation, potentially achieved through its ability to associate with purine-rich regions in nascent RNA.
RESULTS
Generation and validation of SAFB/2 double-knockout mouse embryonic stem cells
In the mouse, SAFB and its paralog SAFB2 are divergently transcribed from a single locus on chromosome 17 (Fig. 1A). Thus, we used pairs of sgRNAs to simultaneously delete the entire Safb and Safb2 genes (Fig. 1A), specifically in an F1-hybrid male ESC line that we previously engineered to express the Xist long noncoding RNA (lncRNA) under the control of a doxycycline-inducible promoter from the Rosa26 locus on the B6-derived copy of chromosome 6 (Trotman et al. 2020). We elected to study SAFB/2 in this particular ESC line because of our ongoing interest in Xist-mediated gene regulation and the possible links between SAFB, Xist, and the Polycomb repressive complex 2 (PRC2) (Townson et al. 2004; Mukhopadhyay et al. 2014; Chu et al. 2015; Bousard et al. 2019; Huo et al. 2020; McCarthy et al. 2021; Yu et al. 2021; see also Supplemental Note; Cherney et al. 2023). For our study below, we selected two individual colonies that genotyped as DKOs by DNA PCR, reverse-transcription coupled PCR (RT-qPCR), and western blot (DKO4 and DKO13; Fig. 1B–E).
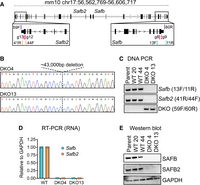
Generation and validation of SAFB/2 double-knockout mouse ESCs. (A) Schematic of Safb and Safb2 mm10 genomic locus with location of sgRNAs (g8–g12) and genotyping primers (13F/11R; 41R/44F; 59F/60R). (B) Sanger sequencing traces through the deleted region in the two clonal knockout lines used in this study, DKO4 and DKO13. (C) PCR genotyping in wild-type (WT) and DKO ESCs. (D) qPCR for RNA detection of Safb and Safb2 mRNA levels (shown relative to GAPDH in WT cells). Dots represent technical triplicate measurements. (E) Western blots showing levels of SAFB and SAFB2 in WT and DKO cells.
SAFB associates predominantly with intronic regions of protein-coding genes in mouse embryonic stem cells
To identify RNAs that associate with SAFB in ESCs, we used a formaldehyde-based RIP procedure outlined in Schertzer et al. (2019a) and a polyclonal rabbit antibody raised against the carboxy-terminal region of SAFB. RIPs were performed in five separate ESC lines: the WT, Xist-expressing ESC line from Trotman et al. (2020) (Parent), the two DKO ESC lines described in Figure 1, and two clonal ESC lines that underwent sgRNA transfection and the same clonal selection as the DKO lines but remained WT for SAFB (WT20 and WT44). We performed all RNA collection experiments under the doxycycline-induced condition, in which Xist is expressed from a single copy of chromosome 6 (Trotman et al. 2020). The reason for selecting the doxycycline-induced condition was again related to our ongoing studies of Xist and our desire to investigate a possible link between SAFB and PRC2, which is described in the Supplemental Note and Cherney et al. (2023).
To identify regions of RNA enriched in their association with SAFB (i.e., “SAFB peaks”), we used a strand-specific implementation of MACS2 and a combination of DESeq2 followed by empirical filtering of regions based on signal in WT ESCs relative to SAFB/2 DKO controls (Zhang et al. 2008; Feng et al. 2012; Love et al. 2014). Specifically, we required that enriched regions (i) were detected above a minimum threshold (at least five reads in at least two of the three WT ESC lines profiled), (ii) were ascribed a significant P-value when comparing signal between SAFB/2 DKO ESCs and WT ESCs (P < 0.05 by DESeq2), and (iii) displayed a relative reduction in abundance upon DKO of SAFB/2 (average reads-per-million [RPM] signal of at least twofold less in SAFB/2 DKO ESCs compared to WT ESCs). This yielded 32,354 regions that were potentially enriched in their association with SAFB in WT ESCs. As an additional filter, in DKO13 ESCs, we stably expressed SAFB and nuclear-localized GFP cDNAs tagged at their carboxyl termini with tandem FLAG and V5 epitopes (Fig. 2A) and performed RIP-seq using an anti-FLAG antibody. Out of the 32,354 potential peak regions identified above, 23,853 regions passed a minimum threshold of detection (i.e., they had a total of at least five reads in the SAFB-FLAG and GFP-FLAG data sets), and 94% of these regions (22,497) had a higher signal in the SAFB-FLAG data set compared to the GFP-FLAG negative control, supporting the high fidelity of our endogenous SAFB RIP data as well as our peak calling approach. The 1356 regions with higher signal in the GFP-FLAG compared to the SAFB-FLAG RIP were dropped from further analysis, yielding a total of 30,998 regions that we henceforth define as SAFB-associated peaks (Supplemental Table S1).
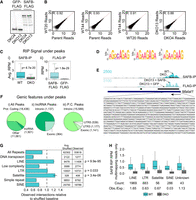
SAFB associates predominantly with intronic regions of protein-coding genes in mouse ESCs. (A) αFLAG western blot of GFP and SAFB rescue in DKO ESCs. (B) Scatter plots showing the correlation of RIP-seq replicate data under each SAFB peak for each genotype. (C) RPM-normalized RIP signal under SAFB peaks in (i) WT and DKO ESCs (αSAFB RIP) and (ii) in SAFB and GFP rescue ESCs (αFLAG RIP). (D) Top three motifs derived from analysis of sequence under SAFB peaks. (E) RNA Input and RIP-seq wiggle density tracks at the Malat1 locus. Black rectangles under wiggle tracks denote the location of SAFB peaks. (F) Genic features that overlap SAFB peaks. (G) Intersection of mm10 annotated repeat elements and SAFB peaks. P-values = (1 − [cumulative distribution function]) of the distribution of intersections observed from 1000 shuffles sets of SAFB peaks. (H) Intersection of repeat-masked elements and multimapping reads from SAFB RIPs in WT and DKO ESCs. “Count,” number of elements in each class that passed the threshold for inclusion. “Obs./Exp,” ratio of observed versus expected genomic space occupied by each class of repeat in the list of elements passing filter (Supplemental Table S2). Classes of repeat that were represented by less than 25 elements in our filtered list were not plotted.
The signal patterns under each peak were highly reproducible between replicate RIP experiments. Comparing replicates between WT samples yielded an average Pearson's r value of 0.92, and comparing replicates between DKO samples yielded a Pearson's r value of 0.88 (Fig. 2B). Boxplots of RIP signal under each peak in the different genotypes demonstrated the SAFB dependence of signal under SAFB peaks (Fig. 2C). Wiggle density tracks of individual and pooled replicates can be viewed on the UCSC genome browser (Lee et al. 2022; https://genome.ucsc.edu/s/recherney/Cherney_Safb_2022). Consistent with prior iCLIP studies of SAFB in human SH-SY5Y and MCF-7 cells, we identified GA-rich sequence motifs underneath the most-strongly enriched SAFB peaks (Fig. 2D; Hong et al. 2015; Rivers et al. 2015). An image of SAFB RIP read density over Malat1, the gene that exhibited the highest association with SAFB in our data sets, is shown in Figure 2E. Malat1 has previously been shown to interact with SAFB in human cells (Hong et al. 2015; Spiniello et al. 2018). Moreover, the region within Malat1 that is most strongly associated with SAFB is enriched in GA nucleotides, consistent with the association being driven by direct interactions (Fig. 2E).
We next determined the location of SAFB peaks relative to the GENCODE vM25 “basic” gene annotation set (Frankish et al. 2019). We found that 18,436 SAFB peaks overlapped with transcripts originating from protein-coding genes and 1501 peaks overlapped with transcripts originating from lncRNAs (Supplemental Table S1). An additional 6004 peaks were located within 10 kilobases (kb) of an annotated transcript in the GENCODE vM25 “comprehensive” gene annotation set; we presume many of these peaks overlap incompletely annotated protein-coding or lncRNA genes. The majority of gene-overlapping peaks fell within intronic regions, both for the set of peaks that overlapped protein-coding and lncRNA genes (Fig. 2F). The fraction of intron-overlapping peaks (79%) is marginally less than would be expected based on the genic space occupied by introns in the GENCODE vM25 “basic” gene annotation set (91%).
SAFB has previously been shown to associate with specific classes of repetitive elements, most notably those derived from satellite repeats and LINEs (Aly et al. 2019; Huo et al. 2020). Therefore, we determined the extent to which SAFB peaks were enriched in overlapping repetitive elements relative to sets of locally shuffled control peaks. Consistent with prior works, the strongest enrichments were observed over LINE- and satellite-derived elements (Fig. 2G; Supplemental Table S1). Next, because our set of SAFB peaks were defined using uniquely mapped, nonrepetitive reads, we performed a repeat analysis exclusively with multimapping reads, using the TElocal package to assign fractional read counts to repeat-derived elements in the mm10 build of the genome (Jin et al. 2015). This analysis uncovered a set of 6162 repeat-derived elements that were detected above a minimal expression threshold and whose RPM-normalized expression values were, on average, at least twofold higher in the WT compared to DKO RIP-seq data (Fig. 2H; Supplemental Table S2). Twenty-six percent of the elements in this set (1588/6162) overlapped a gene annotation in GENCODE (Frankish et al. 2019). While essentially all classes of repeats were represented, we observed a significant enrichment for LINE-derived elements, and significant depletions for all other classes of repeat (Fig. 2H and not shown; P < 2 × 10⁻¹⁶ for all differences, χ2). We conclude that within the context of uniquely alignable regions as well as repetitive genic and intergenic loci, the SAFB protein associates with LINE-derived elements at higher-than-expected frequencies. Additionally, on a local scale, uniquely alignable peaks of SAFB also overlap satellite-derived elements with a higher-than-expected frequency.
SAFB/2 loss alters expression of a subset of genes in mouse embryonic stem cells
We next assessed whether SAFB DKO ESCs exhibited significant gene expression changes relative to WT ESCs. For this analysis, we performed total RNA-seq on “input” RNA collected from the same crosslinked ESCs that we used to perform SAFB RIP above. Using DESeq2, we identified 992 genes whose expression was significantly different (Padj < 0.05) between our three WT and two DKO samples; 545 of these genes were down-regulated in DKO compared to WT ESCs, and 447 were up-regulated (Fig. 3A,B; Supplemental Table S3).
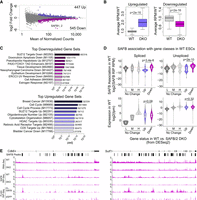
SAFB/2 loss alters the expression of a subset of genes in mouse ESCs. (A) MA plot of differential gene expression between WT and DKO ESCs; purple dots, up-regulated genes, magenta dots, down-regulated genes. (B) Average RPM of up- and down-regulated genes in WT relative to DKO ESCs. P-values, paired t-test. (C) Top 10 enriched gene sets (from molecular signatures database [MSigDB]) (Subramanian et al. 2005; Liberzon et al. 2015) associated with up- and down-regulated genes. (D) SAFB association and overall expression levels of spliced and unspliced transcripts in WT ESCs, broken down by whether genes are up-regulated (Up), down-regulated (Down), or do not change in expression upon SAFB/2 DKO (No Change). The set of nonchanging genes is further partitioned into three categories: those with low (0.125–1 TPM; “L”), medium (>1 but <16 TPM; “M”), and high (>16 TPM; “H”), levels of expression. (E) Representative genes (Cdk6 and Sulf1) that harbor intronic peaks of SAFB association and whose expression drops upon DKO and is restored upon reintroduction of SAFB cDNA.
Using gene set enrichment analysis (GSEA) and the MSigDB (Subramanian et al. 2005; Liberzon et al. 2015), we examined the genes and pathways that were significantly associated with the differentially expressed genes. Specifically, we queried MSigDB's “Hallmark Gene,” “Chemical and Genetic Perturbation,” and “GO Biological Process” gene set collections (Supplemental Table S4). Among the genes that were down-regulated in SAFB DKO cells, we identified several significant connections with gene sets involved in tissue development, cell adhesion, and the response to estrogen (Dutertre et al. 2010), among others (Fig. 3C; Supplemental Table S4). Intriguingly, the most significantly enriched gene set among the down-regulated genes was “PASINI_SUZ12_TARGETS_DN,” a set of genes whose expression is significantly down-regulated upon knockout of the Polycomb protein SUZ12 in ESCs (Fig. 3C; Pasini et al. 2007).
Among the genes that were up-regulated in DKO cells, enriched gene sets were also identified, although the enrichments were generally not as strong as those detected with the down-regulated genes (Fig. 3C; Supplemental Table S4). However, we again identified a strong connection between SAFB/2 DKO and Polycomb-regulated genes; the fourth most significantly enriched gene set was “PASINI_SUZ12_TARGETS_UP,” the set of genes whose expression was significantly up-regulated upon knockout of the Polycomb protein SUZ12 in mouse ESCs (Fig. 3C; Pasini et al. 2007). Additional notable enrichments included genes involved in cell cycle progression, as well as targets of histone deacetylases (Heller et al. 2008) and the retinoic acid receptor (Delacroix et al. 2010), among others (Fig. 3C; Supplemental Table S4).
We next sought to determine whether the genes whose expression changed upon SAFB/2 loss exhibited evidence of SAFB association by RIP. Considering our prior observation that SAFB associates predominantly with introns, we took an approach that would let us quantify the extent of SAFB association with both spliced and unspliced RNAs. Briefly, starting with our WT and DKO RIP-seq data sets, we extracted the reads that were aligned by STAR under each SAFB peak, and then used probabilistic pseudoalignment with kallisto to assign the same reads to a version of the mouse transcriptome that contained one representative unspliced transcript for each GENCODE gene (Dobin et al. 2013; Bray et al. 2016; Frankish et al. 2021). The genomic coordinates of each unspliced transcript started at the corresponding host gene's most-upstream annotated transcription start site and ended at the host gene's most-downstream transcription end site. Throughout our study, we consider these unspliced transcript annotations to be proxies for nascent RNAs produced from their host genes.
We used the difference of transcript per million (TPM) values in the WT and DKO RIP-seq data sets to estimate the extent of SAFB association with each expressed transcript isoform. Strikingly, both the spliced and unspliced isoforms of the genes that were down-regulated upon SAFB/2 DKO associated with significantly more SAFB than genes that were up-regulated upon DKO or whose expression did not change (Fig. 3D, upper panels; P < 0.001 for both, paired t-test; Supplemental Table S5). This difference could not be accounted for by differences in overall expression levels (Fig. 3D; lower panels). Indeed, both the spliced and unspliced transcripts of the set of down-regulated genes associated with significantly higher levels of SAFB than any other set of genes we examined, except the most highly expressed subset of spliced transcripts (Fig. 3D; P < 0.001 for all significant values, paired t-test; Supplemental Table S5). These data imply that among the set of down-regulated genes are many direct targets of SAFB, and that association with SAFB in these instances serves to promote overall gene expression.
SAFB/2 loss induces changes in splicing that are largely independent of the changes it induces in gene expression
We next sought to determine whether changes in gene expression SAFB/2 DKO ESCs co-occurred with widespread changes in splicing, using rMATS to detect changes in splicing in WT versus DKO ESCs (Li and Dewey 2011; Shen et al. 2014). We identified a total of 352 splicing events whose “percent spliced in” (PSI) values were significantly altered in DKO ESCs when compared to WT (Supplemental Table S6; Padj < 0.05). These 352 events occurred within 305 distinct genes, the majority of which (272) did not exhibit significant changes in gene expression upon DKO (Fig. 4A). While we observed changes in splicing events of all possible classes, we observed that intron retention events were significantly more likely to harbor increased PSI values in WT compared to DKO cells (Fig. 4B; 79 events in WT vs. 37 events in DKO; P < 0.05; χ2). Conversely, we also observed that a smaller number of mutually exclusive exons were more likely to harbor increased PSI values in DKO compared to WT cells (Fig. 4B; 17 events in DKO vs. eight events in WT; P < 0.05; χ2). These data are consistent with our observations that peaks of SAFB association can be found in both exons and in introns, and also suggest that the majority of genes whose overall expression levels change upon SAFB/2 DKO do not exhibit major changes in splicing patterns.
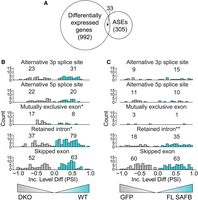
SAFB/2 loss induces changes in splicing that are largely independent of the changes it induces in gene expression. (A) Venn diagram showing the numbers of genes that exhibit differential expression, alternative splicing events (ASE), or both, upon knockout of SAFB/2. (B) The number of significant events (Padj < 0.05) and histograms displaying the relative PSI values for each of the five different classes of ASE detected by rMATS (Shen et al. 2014). “Inc. Level Diff,” Inclusion Level Difference between WT and DKO ESCs. (C) Same as (B) but displaying relative PSI values and significant events (Padj < 0.05) when GFP-expressing DKO cells are compared to SAFB-expressing DKO cells. (*) P < 0.05; (**) P < 0.01.
Reintroduction of SAFB into SAFB/2 knockout cells restores gene expression defects in a manner dependent on the SAFB carboxy-terminal domain
SAFB is comprised of multiple domains, most of which are important for its proper localization in mouse cells (Huo et al. 2020). We were intrigued by the final ∼300 amino acids of SAFB, an R/G-rich domain which is predicted to be intrinsically disordered and important for SAFB's ability to interact with both proteins and RNA (Townson et al. 2004; Finn et al. 2016; Dosztanyi 2018; Meszaros et al. 2018; Corley et al. 2020; Huo et al. 2020). This same carboxy-terminal domain is sufficient to mediate the repression of a heterologous reporter gene when tethered to its promoter (Townson et al. 2004).
To determine whether the reintroduction of SAFB restored gene expression defects in DKO ESCs, and to determine the potential involvement of the DD3 domain, we introduced three separate expressions constructs into DKO ESCs via piggyBac-mediated transgenesis. The first two constructs, described in Figure 2A, constitutively express full-length SAFB and GFP cDNAs each tagged at their 3′ ends with 3× FLAG and V5 epitopes and a nuclear-localization signal. A third construct in the same vector backbone expresses a mutant version of SAFB in which the carboxy-terminal disordered domain has been deleted (Fig. 5A, ΔDD3). Western blot confirmed the expression of all three constructs and additionally demonstrated that ΔDD3 is more highly expressed than full-length SAFB (Fig. 5B). RIP-qPCR using either αFLAG or αV5 antibodies demonstrated that the DD3 domain is required for SAFB association with target RNAs, consistent with expectations (Fig. 5C; Huo et al. 2020).
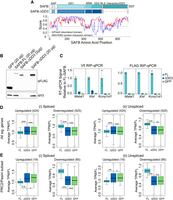
Reintroduction of SAFB into SAFB/2 knockout cells restores gene expression defects in a manner dependent on the SAFB carboxy-terminal domain. (A) Protein domain diagram of SAFB (top) and ΔDD3 (bottom). IUPred2 disorder predictions below. (B) αFLAG western blot of GFP and SAFB rescue in DKO ESCs. (C) αV5 and αFLAG RIP-qPCR signal relative to FL-SAFB in FL-SAFB, ΔDD3, and GFP rescue cells. (D,E) Boxplots of average TPM in FL-SAFB, ΔDD3, and GFP rescue cells. (*) P < 0.05, (**) P < 0.01, (***) P < 0.001, respectively.
We next performed RNA-seq from biological duplicate preparations of RNA extracted from full-length SAFB, ΔDD3, and GFP-expressing DKO cells. Using kallisto to estimate the abundance of spliced and unspliced isoforms (Bray et al. 2016), we found that spliced and unspliced isoforms of transcripts produced from the genes that we had previously found to be significantly up-regulated or down-regulated upon SAFB/2 DKO returned closer to WT levels upon expression of full-length SAFB but not ΔDD3 or GFP (Fig. 5D). The trends were numerically stronger for the set of down-regulated genes compared with those that were up-regulated (Fig. 5D). We likewise observed that intron retention events were significantly more likely to harbor increased PSI values in SAFB rescue compared to GFP rescue ESCs (Fig. 4C; 35 in events FL-SAFB vs. 18 events in GFP; P < 0.05; χ2). That many down-regulated genes and intron retention events shifted more strongly toward WT levels upon reintroduction of SAFB is consistent with our prior observation that the nascent RNAs produced from down-regulated genes associate with high levels of SAFB (Fig. 3D). Examining the subsets of genes that were up- and down-regulated in DKO cells and similarly dysregulated upon SUZ12 knockout in ESCs, we observed analogous but numerically stronger trends (Fig. 5E; Supplemental Table S5). We conclude that many of the transcriptional changes that occur upon SAFB/2 DKO can be restored by the reintroduction of SAFB into DKO cells, and that the restoration of these changes depends on the carboxy-terminal domain of SAFB, if not other regions of the protein as well (Huo et al. 2020).
The carboxy-terminal region of SAFB interacts with RS domain-containing and speckle-associated proteins
SAFB has been shown to interact with several SR proteins through its carboxy-terminal region, and is also found in nuclear speckles, which are nuclear condensates that harbor high levels of SR proteins and are associated with increased expression of surrounding genes (Nayler et al. 1998; Saitoh et al. 2004; Townson et al. 2004; Kim et al. 2020; Zhang et al. 2020). To determine whether SAFB interacts with SR proteins and speckle components in ESCs, we performed mass spectrometry-based proteomics on biological duplicate preparations of proteins immunoprecipitated by the FLAG antibody from formaldehyde-crosslinked extracts made from DKO cells expressing the same full-length SAFB, ΔDD3, and GFP cDNAs described in Figure 5.
Moreover, SAFB was originally identified along with another abundant RNA-binding protein called HNRNPU (or SAF-A), owing to their mutual presence in high salt extractions from HeLa nuclei and their ability to bind hydroxylapatite columns and S/MAR DNA elements in vitro (Romig et al. 1992; Renz and Fackelmayer 1996). Similar to that observed for SAFB above, HNRNPU has previously been implicated in promoting gene expression through its ability to associate with nascent, chromatin-associated RNA (Nozawa et al. 2017). We reasoned that comparing the proteins that are associated with SAFB and HNRNPU in ESCs might shed light on whether they promote gene expression using shared or different mechanisms. Therefore, in our WT parent ESC line, we expressed a FLAG-tagged cDNA of HNRNPU as well as a version of HNRNPU lacking a 154 amino acid-long, R/G-rich region at its C-terminus (Fig. 6A,B; ΔRGG). We then performed mass spectrometry-based proteomics in technical duplicate from a single biological replicate of proteins immunoprecipitated by the FLAG antibody from formaldehyde-crosslinked extracts of HNRNPU and ΔRGG-expressing WT ESCs.
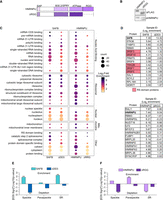
The carboxy-terminal region of SAFB interacts with RS domain-containing and speckle-associated proteins. (A) Protein domain diagram of HNRNPU (top) and ΔRGG (bottom). (B) αFLAG and αHNRNPU Western blot analyses of HNRNPU and ΔRGG-expressing cells. In the blot probed with αHNRNPU (lower panel), both endogenous HNRNPU and FLAG-tagged HNRNPU are visible. (C) Top gene ontology (GO) terms from SAFB and HNRNPU IPs. (D) Top 15 most-enriched proteins in (i) SAFB and (ii) HNRNPU IP-MS samples. Log2 LFQ enrichment values relative to GFP control are also shown. Proteins with RS domains curated in Cascarina and Ross (2022) are shaded red. (E,F) P-values denoting the significance of Gene Set Enrichment/Depletion in SAFB and HNRNPU proteomic data sets, corrected for family-wise error rate (FWER) (Olejnik et al. 1997; Subramanian et al. 2005). −Log10(P-values) for enrichment (EDS sign = 1) and depletion (EDS sign = −1) are shown on the y-axis on positive and negative scales, respectively. (**) FWER < 0.05.
We selected for further analysis those proteins that were twofold more abundant (log2 > 1) in the SAFB and HNRNPU IPs compared to the GFP IPs. This yielded 69 and 165 proteins that exhibited enriched association with FLAG-SAFB and FLAG-HNRNPU, respectively (Supplemental Table S7). We next used DAVID to identify enriched GO terms, focusing on the cellular component (CC) and molecular function (MF) domains (Huang da et al. 2009; Sherman et al. 2022). We observed the enrichment of many shared GO terms, including several that center around the themes of RNA-binding and splicing (Fig. 6C). Deletion of the DD3 and RGG domains from SAFB and HNRNPU, respectively, led to clear reductions in the association of proteins linked to nucleic acid binding, splicing, and translation (Fig. 6C).
We noted that SAFB appeared to associate more robustly with SR proteins than HNRNPU. Conversely, HNRNPU appeared to associate more robustly with other heterogeneous nuclear ribonucleoproteins proteins than SAFB (Fig. 6D; Supplemental Table S7). We also noted a possible enrichment for paraspeckle components in the HNRNPU IPs (Supplemental Table S7). Therefore, in addition to DAVID analyses, we evaluated separately curated lists of RS domain-containing proteins (Cascarina and Ross 2022), proteins that biochemically purified along with nuclear speckles/interchromatin granule preparations (Saitoh et al. 2004), and proteins found in paraspeckles (Yamazaki and Hirose 2015). We then determined the relative scale of the enrichment of proteins from each list in SAFB and HNRNPU IPs using an approach modified from GSEA (Subramanian et al. 2005). These analyses showed that nuclear speckle-associated and RS domain-containing proteins were strongly enriched among SAFB interactors (Fig. 6E; P-value for enrichment of speckle and RS domain proteins in SAFB, 0.0129 and 0.0038, respectively; FWER < 0.05 for both tests). Furthermore, these interactions are dependent on the DD3 region of SAFB (Fig. 6E). Conversely, HNRNPU interacting proteins were significantly enriched for proteins found in paraspeckles and depleted in association with proteins that harbor RS domains (Fig. 6F, P-value for paraspeckle enrichment, 0.0156; P-value for RS domain depletion, 0.0089; FWER < 0.05 for both tests). Thus, SAFB associates with many proteins that copurify with nuclear speckles, including many that harbor RS domains (Saitoh et al. 2004; Cascarina and Ross 2022), and these associations differ from HNRNPU, another chromatin-associated RNA-binding protein that has previously been implicated in the activation of transcription (Nozawa et al. 2017). These data are consistent with the view that SAFB and HNRNPU promote gene expression through different mechanisms.
SAFB puncta are largely distinct from nuclear speckles in ESCs
Considering our own data in context with prior studies linking SAFB to nuclear speckles and RS domain proteins, we sought to determine to what extent SAFB, nuclear speckles, and RS domain proteins colocalize in ESCs using immunofluorescence (IF). We visualized nuclear speckles with the SC35 antibody (Ilik et al. 2020). Contemporaneously, we visualized SAFB using an antibody raised against endogenous SAFB (same antibody used for RIP; used in WT ESCs) or a FLAG antibody (specifically in DKO ESCs that express full-length SAFB cDNA). As controls to assess antibody specificity, we performed αSAFB and αFLAG IF in DKO ESCs and FLAG-GFP DKO ESCs, respectively. αSAFB and αFLAG IF showed similar patterns of staining that were dependent on the presence of SAFB, and also demonstrated that the majority of SAFB puncta occupied nuclear regions that were spatially distinct from SC35 speckles (Fig. 7A). These findings are not inconsistent with prior data showing that in mouse fibroblasts, many SAFB puncta are located adjacent to foci of heterochromatin (Huo et al. 2020), but are at odds with a prior study that examined the localization of epitope-tagged SAFB in human 293T cells, which found strong colocalization between SAFB and SC35 speckles (Nayler et al. 1998). Still, in most z-slices examined, we observed a small number of SAFB puncta colocalizing with SC35 speckles, consistent with data indicating that SAFB and speckle-associated proteins can interact (see Fig. 7B for higher-zoom insets). Moreover, we also examined the extent of colocalization between SAFB and each of the three RS domain proteins that we identified as SAFB interactors: SRSF1, SRSF3, and SRSF6 (Supplemental Table S7). While the RS domain proteins did localize to puncta, they also exhibited a more diffuse nuclear staining than did SC35, and by eye, exhibited a higher degree of colocalization with SAFB (Fig. 7C). Thus, while nuclear regions that stain the most intensely for RS domain proteins are largely distinct from those that stain the most intensely for SAFB, colocalization between RS domain proteins and SAFB can be observed, most frequently outside of their brightest puncta. These findings support our own mass spectrometry data as well as prior studies that have linked SAFB to nuclear speckles and RS domain-containing proteins (Saitoh et al. 2004; Townson et al. 2004; Cascarina and Ross 2022).
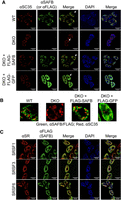
SAFB puncta are largely distinct from nuclear speckles. (A) Dual antibody-staining in WT and DKO ESCs examining the location of nuclear speckles (via SC35) (Ilik et al. 2020) relative to SAFB. White arrows, individual cells shown under increased digital zoom in (B) (genotypes displayed above each zoomed image). (C) Dual antibody-staining in WT ESCs examining the location of SRSF1, SRSF3, and SRSF6 relative to SAFB.
DISCUSSION
Our data are consistent with the notion that SAFB harbors many roles in mammalian cells, including the regulation of genes in multiple biological pathways and the binding of RNA produced from LINE- and Satellite-derived repetitive elements (Garee and Oesterreich 2010; Norman et al. 2016; Aly et al. 2019; Huo et al. 2020; McCarthy et al. 2021; Ron and Ulitsky 2022). More notably, we also find that SAFB exhibits enriched associations with a subset of RNAs, and in those cases, it appears to promote gene expression independent of its role in regulating splicing.
Specifically, using a combination of formaldehyde-based RIP and genetic rescue in an Xist-expressing ESC line (Trotman et al. 2020), we observed that SAFB associated primarily but not exclusively with intronic regions of protein-coding genes though purine-rich motifs. Knockout of SAFB and its paralog SAFB2 led to differential expression of nearly 1000 genes, about half of which were down-regulated and associated with high levels of SAFB in WT cells. The set of genes whose expression levels changed upon SAFB/2 loss were largely distinct from those whose splicing patterns changed, but both expression and splicing changes could be rescued by the expression of a SAFB cDNA in DKO ESCs. We also found that SAFB associated with RS domain-containing and nuclear speckle-associated proteins, consistent with prior studies (Nayler et al. 1998; Townson et al. 2004). By RIP, SAFB also strongly associated with the lncRNA Malat1, which is also found in speckles (Hutchinson et al. 2007). The association between SAFB and speckle-associated proteins as well as the ability of a SAFB cDNA to rescue gene expression defects in DKO ESCs each depended on a large, intrinsically disordered domain in SAFB's carboxy-terminal region which has previously been shown to be important for interaction with RNA and SR proteins (Townson et al. 2004; Finn et al. 2016; Dosztanyi 2018; Meszaros et al. 2018; Corley et al. 2020; Huo et al. 2020).
Our data support the view that SAFB can associate with specific RNAs to promote gene expression. The mechanism of gene activation requires further study. However, we note that most peaks of SAFB association were found in introns, and that the changes in RNA abundance upon SAFB/2 loss could not be ascribed to changes in splicing. Moreover, both RS domain-containing proteins and nuclear speckles, entities with which SAFB interacts, themselves have roles in transcriptional activation (Ji et al. 2013; Chen and Belmont 2019; Kim et al. 2020; Zhang et al. 2020). For these reasons, we favor a model whereby high levels of SAFB binding to specific nascent RNAs boosts gene expression at the level of transcription, perhaps by directly recruiting components of the transcription and splicing machinery to host genes. We also note that the lncRNA Malat1, the transcript that associates the most robustly with SAFB by RIP, is also known to associate with specific active genes (Engreitz et al. 2014; West et al. 2014). It would be intriguing to investigate a potential functional connection between SAFB and Malat1 in the future.
SAFB was identified in parallel with another chromatin-associated RNA-binding protein, HNRNPU, which also appears to promote gene expression by associating with nascent RNA (Nozawa et al. 2017; Creamer et al. 2021). HNRNPU's role in gene activation is likely distinct from SAFB's, the former associating with nascent RNA nonspecifically to de-compact chromatin globally (Nozawa et al. 2017; Creamer et al. 2021), and the latter associating with purine-rich motifs to affect the expression of specific genes (our study). Concordantly, we found that HNRNPU and SAFB associate with different proteins in ESCs, consistent with the notion that they promote gene expression in different ways. Nevertheless, the fact that both SAFB and HNRNPU appear to affect gene expression through nascent RNAs, despite their apparent differences in mechanism, is a notable connection.
Only half of the genes whose expression changed significantly upon SAFB/2 DKO were down-regulated; the other half were up-regulated. The expression level of many up-regulated genes shifted back down toward WT levels upon reintroduction of SAFB, indicating that their dysregulation was reversible and dependent on SAFB. As a class, the transcripts produced from the up-regulated genes did not associate with high levels of SAFB, suggesting that their increased expression upon SAFB/2 DKO was not due to loss of directly bound SAFB. However, SAFB is important for the maintenance of heterochromatin in mouse and human cell lines (Townson et al. 2004; Mukhopadhyay et al. 2014; Huo et al. 2020; McCarthy et al. 2021). On that basis, it is reasonable to speculate that certain genes are up-regulated upon SAFB/2 DKO owing to the reactivation of repressed chromatin.
Relatedly, a significant number of genes whose dysregulated expression levels were rescued by the reintroduction of SAFB into DKO cells were also altered in analogous fashion upon knockout of the Polycomb protein SUZ12 (Pasini et al. 2007). These included 19 genes whose expression increased upon SUZ12 and SAFB/2 loss, and 85 genes whose expression decreased. Based on these connections, our ongoing interest in Polycomb and Xist, as well as prior studies that have linked SAFB to transcriptional repression and Polycomb-mediated silencing (Townson et al. 2004; Mukhopadhyay et al. 2014; Huo et al. 2020; McCarthy et al. 2021), we examined H3K27me3 levels by ChIP-seq and gene expression by RNA-seq, in WT and DKO ESCs, each under Xist-expressing conditions (Supplemental Note). We did not observe major changes in steady-state levels of H3K27me3, Xist-deposited H3K27me3, or a connection between the local levels of H3K27me3 and the expression changes induced by SAFB/2 DKO (Supplemental Fig. 1). Neither was the silencing ability of Xist affected by SAFB/2 DKO (Supplemental Fig. 1). We favor the possibility that the significant overlap between SUZ12 and SAFB/2 dysregulated genes is related simply to the fact that both gene sets were collected from the same cell type—mouse ESCs. Alternatively, the loss of SUZ12 and SAFB/2 may cause some shared changes, for example, to nuclear architecture (Cruz-Molina et al. 2017; Huo et al. 2020), which would then be responsible for the shared changes in gene expression.
In summary, our study provides new insights into the possible regulatory roles of SAFB. In addition to roles in the establishment and maintenance of heterochromatin (Huo et al. 2020; McCarthy et al. 2021), the nuclear retention of RNA (Ron and Ulitsky 2022), and the response to stress (Aly et al. 2019), our work suggests that SAFB may boost the overall expression of certain genes by associating with purine-rich regions in nascent RNA.
MATERIALS AND METHODS
Experimental methods
Cell culture
Male mouse ESCs that express doxycycline-inducible Xist from the Rosa26 locus (derivation described in Trotman et al. (2020) were grown in DMEM (Gibco) supplemented with 15% Qualified Fetal Bovine Serum (Gibco), 1% Pen/Strep (Gibco), 1% l-Glutamine (Gibco), 1% Non-Essential Amino Acids (Gibco), 100 µM betamercaptoethanol (Sigma), and 0.2% LIF. Cells were maintained in incubators set at 37°C and 5% CO2. Media was replaced daily.
Generation of WT parent ESCs used for this study
To generate the WT parent ESC line from which we ultimately deleted SAFB and SAFB2, full-length Xist-expressing ESCs from Trotman et al. (2020) were deleted of their hygromycin B resistance gene via Lipofectamine transfection of a plasmid expressing FlpE (Addgene #20733) (Beard et al. 2006). An amount of 5 µg of FlpE recombinase was mixed with 5 µL of P3000 reagent, 7.5 µL of Lipofectamine 3000 reagent, and Opti-MEM media (Gibco #31985-070) to a total volume of 250 µL. The reagents were incubated for 5 min at room temperature before being added to cells with fresh media. After 24 h, cells were pulsed with puromycin (2 µg/mL) for 72 h. Ninety-six hours after transfection, ESCs were trypsinized to single-cell suspension and plated onto irradiated fibroblast feeder cells (500–2000 cells/10 cm plate) until individual colonies were visible by eye (4–5 d). Individual colonies were then selected and grown in individual wells for genotyping. After genotyping, candidate clonal colonies underwent hygromycin B (50 µg/mL) selection to verify loss of resistance. Genotyping primers used are in Supplemental Table S10.
Generation of SAFB/2 knockout ESCs
sgRNAs to delete SAFB and SAFB2 were designed to the mm10 genome using CRISPOR with the specifications 20 bp-NGG—Sp Cas9, Sp Cas9-Hf1, eSp Cas9 1.1 (Concordet and Haeussler 2018). sgRNA sequences are found in Supplemental Table S10. Guides were cloned into the pX330 plasmid as specified in Cong et al. (2013) (Addgene plasmid #42230). To delete SAFB and SAFB2, Parent ESCs were seeded at 0.5 × 10⁶ cells per well in a six-well plate. The following day, the cells were transiently transfected using Lipofectamine 3000 (Invitrogen L3000-015): 800 ng of sgRNA plasmid pool and 200 ng puro resistant GFP plasmid (1 µg total) were mixed with 2 µL P3000 reagent, 7.5 µL Lipofectamine 3000 reagent and Opti-MEM media (Gibco #31985-070) to a final volume of 250 µL. The reagents were incubated for 5 min at room temperature before being added to cells with fresh media. After 24 h, cells were pulsed with Puromycin (2 µg/mL) for 48 h. After puromycin selection, cells were trypsinized to single cells and plated onto irradiated fibroblast feeder cells (500–2000 cells/10 cm plate) until individual colonies were visible by eye (4–5 d). Individual colonies were then selected and grown in individual wells for genotyping.
The two WT and two DKO lines that were selected for further study, along with the WT Parent line, were then rendered dox-inducible by transfection of the rtTA-expressing plasmid described in Kirk et al. (2018). One day prior to transfection, parent and DKO ESCs were seeded at 0.5 × 10⁶ cells per six-welled well. The following day, 500 ng of rtTA plasmid and 500 ng of transposase (1 µg total DNA) were mixed with 2 µL P3000 reagent, 7.5 µL Lipofectamine 3000 reagent and Opti-MEM media (Gibco #31985-070) to 250 µL. The reagents incubated for 5 min at room temperature before being added to cells with fresh media. After 24 h, cells underwent G418 selection (50 µg/mL) for 12 d.
cDNA expression plasmids
Plasmids expressing full-length or truncated versions of SAFB, GFP, and HNRNPU were designed in silico based on existing vector backbones from Schertzer et al. (2019b) and synthesized by Genewiz. All plasmids have been deposited into Addgene.
Generation of cDNA-expressing ESCs
One day prior to transfection, ESCs were seeded at 0.5 × 10⁶ cells per well of a six-well plate. The following day, 850 ng of cDNA plasmid and 150 ng of piggyBac transposase from Kirk et al. (2018) were mixed with 2 µL P3000 reagent, 7.5 µL Lipofectamine 3000 reagent, and Opti-MEM media (Gibco #31985-070) to a final volume of 250 µL. The reagents were incubated for 5 min at room temperature before being added to cells with fresh media. After 24 h, cells underwent hygromycin B selection (50 µg/mL) for 1 wk.
HNRNPU-expressing ESCs were then transfected with the rtTA from Kirk et al. (2018) as described above. The DKO cells in which GFP and SAFB cDNA constructs were introduced had previously been stably transfected with rtTA.
PCR
Genomic DNA was collected from 0.8 × 10⁶ cells with 500 µL lysis buffer (100 mM Tris-HCl pH 8.1, 0.5 mM EDTA pH 8.0, 200 nM NaCl, 0.2% SDS) + 80 µL Proteinase K (Denville) + 8 µL linear acrylamide (Thermo Fisher) and incubated at 55°C overnight. Twice the volume of ice cold 100% ethanol was added. Samples were then vortexed and rotated end-over-end at 4°C for 15 min. Samples were spun at max speed for 5 min at 4°C. The lysis buffer/ethanol mixture was then removed, and the DNA pellet was washed with 70% ethanol, after which the DNA pellet was resuspended in 1× TE (10 mM Tris pH 8.0, 1 mM EDTA) and incubated overnight at 56°C. DNA concentration was measured via Nanodrop and diluted to 50 ng/µL. PCR was performed with ChoiceTAQ (Denville CB4050) as follows: 25 µL PCR reaction mixture (2.5 µL 10× PCR reaction buffer, 0.2 µL 10 mM dNTPs, 0.25 µL 100 µM primers, 0.25 µL Choice TAQ polymerase, 3 µL DNA template [50 ng/µL], and ddH2O to 25 µL) ran in Bio-Rad C1000 Touch or T100 thermocycler (initial denaturation at 95°C for 3 min; 25 cycles of 95°C for 30 sec, 58°C–62.5°C annealing for 30 sec, and 72°C for 30–45 sec extension time). PCR primers and conditions are in Supplemental Table S10.
RT-qPCR
Equal amounts of RNA (0.5–1 µg) were reverse transcribed using the High-Capacity cDNA Reverse Transcription Kit (Thermo Fisher Scientific #4368813) with the random primers provided, and then diluted with 30 µL 1× TE. For RIP RT-qPCR, 2 µL of the eluted sample was used in RT reactions. An amount of 10 µL qPCR reactions were performed using iTaq Universal SYBR Green (Bio-Rad) and custom primers on a Bio-Rad CFX96 system with the following thermocycling parameters: initial denaturation at 95°C for 10 min; 40 cycles of 95°C for 15 sec, 60°C for 30 sec, and 72°C for 30 sec followed by a plate read. The primer concentration used for all qPCR reactions in this study was 0.5 µM. Standard curves were used in all qPCR analyses and were prepared by RT of equal volume of WT sample to other samples. After RT, five fivefold serial dilutions were made (six total standards including undiluted RT reaction) and added in duplicate to qPCR plates. After the qPCR run, samples were normalized to standard curve read using the Bio-Rad CFX Manager Software. See Supplemental Table S10 for all primer sequences used.
Antibodies
All antibodies used for this study are listed in Supplemental Table S11.
Western blot
To isolate protein for Western blotting, 0.8 × 10⁶ cells were washed with 1× PBS and then lysed with 500 µL RIPA buffer (10 mM Tris-Cl [pH 7.5], 1 mM EDTA, 0.5 mM EGTA, 1% NP40, 0.1% sodium-deoxycholate, 0.1% sodium dodecyl sulfate, 140 mM sodium chloride) supplemented with 1mM PMSF (Thermo Fisher #36978) and 1× Protease Inhibitor Cocktail (PIC; Sigma Product #P8340). Cell suspensions were rotated for 15 min at 4°C, then spun down at high speed at 4°C for 15 min and the supernatant was collected. Prior to western blotting, protein levels were quantified using the DC assay from Bio-Rad (product #5000006). 4× SDS loading buffer (Sigma Aldrich recipe: 0.2 M Tris-HCl pH 6.8, 0.4 M DTT, 8% [w/v] SDS, 6 mM Bromophenol blue, 4.3 M Glycerol) was added to samples to 1× final concentration. Samples were then boiled for 5 min at 95°C, and equal microgram amounts were loaded onto Bio-Rad TGX Stain Free Gels. Samples were run at 50 V until past stacking gel, then at 150 V for 1–2 h. Gels were transferred to PVDF (Immobulon #IPVH00010) membrane either for 1 h at 125 V at 4°C or overnight at 25 V at 4°C. Membranes were blocked for 45 min in 1× TBST + 5% milk. Membranes were then incubated with primary antibody either overnight at 4°C or for 1–3 h at RT. Membranes were washed 3× for 5 min each in 1× TBST. Secondary antibodies were diluted in 1× TBST + 5% milk and incubated with membranes for 45 min (1:100,000; Invitrogen). Membranes were then washed 3× in 1× TBST washes for 10 min, before being imaged with ECL (Thermo Fisher #34096). Antibodies used were FLAG (Sigma F1804, 1:1000), GAPDH (Abcam, ab9484, 1:1000), Total H3 (Proteintech 17168-1-AP, 1:1000), hnRNPU (Santa Cruz sc-32315 1:500), SAFB (Bethyl A300-812A, 1:3000), SAFB2 (Proteintech 11642-1-AP, 1:10,000), Goat anti-Mouse (Thermo Scientific A16072, 1:100,000), and Goat anti-Rabbit (Thermo Scientific G21234, 1:100,000).
Formaldehyde crosslinking of ESCs
For RIP and IP-MS, cells were grown to 75%–85% confluency, trypsinized and counted. Cells were washed twice in cold 1× PBS then rotated for 30 min in 10 mL of 0.3% formaldehyde (1 mL 16% methanol-free formaldehyde [Pierce #28906] in 49 mL 1× PBS) at 4°C. Formaldehyde was quenched with 1 mL of 2 M glycine for 5 min at room temperature. Cells were washed 3× in cold 1× PBS, then resuspended in 1× PBS at 10 × 106 cells per mL and spun down. PBS was aspirated and pellets were snap frozen in a liquid nitrogen bath and immediately transferred to −80°C.
For ChIP, cells were grown to 75%–85% confluency and counted. Cells were washed once with 1× PBS and crosslinked with 0.6% formaldehyde for 10 min at room temperature. Formaldehyde was quenched with 557 µL of 2.5 M glycine and washed twice with cold 1× PBS. Cells were then scraped in 2 mL cold 1× PBS supplemented with 1× PIC (PIC; Sigma product #P8340). An amount of 10 mL 1× PBS + 0.05% tween-20 was added to collect the cells. Cells were spun down, resuspended in 1× PBS at 10 × 106 cells per mL and spun down. PBS was aspirated and pellets were snap frozen in a liquid nitrogen bath and immediately transferred to −80°C.
RNA-IPs (RIPs)
RIPs were performed similar to Schertzer et al. (2019a), which is a protocol originally adapted from Hendrickson et al. (2016) and Raab et al. (2019). An amount of 25 µL protein A/G agarose beads (Santa Cruz sc-2003) were washed three times in blocking buffer (0.5% BSA in 1× PBS) and incubated overnight at 4°C with 10 µg antibody (anti-SAFB; Bethyl 812-300A; FLAG, Sigma F1804; V5, Sigma V8012; mouse IgG, Invitrogen 02-6502). A total of 10 × 106 cells were resuspended in 500 µL RIPA Buffer (50 mM Tris-HCl, pH 8, 1% Triton X-100, 0.5% sodium-deoxycholate, 0.1% SDS, 5 mM EDTA, 150 mM KCl) supplemented with 1× Protease Inhibitor Cocktail (PIC; Sigma product #P8340), 2.5 µL SuperaseIN (Thermo Fisher Scientific AM2696) and 0.5 mM DTT and sonicated twice for 30 sec on and 1 min off at 30% output using the Sonics Vibracell Sonicator (model VCX130, serial #52223R). Samples were spun down at high speed and 50 µL total lysate was saved for input. Beads were washed three times in 1 mL fRIP buffer (25 mM Tris-HCl pH 7.5, 5 mM EDTA, 0.5% NP-40, 150 mM KCl) and resuspended in 450 µL fRIP buffer supplemented as above with PIC, SuperaseIN and DTT, then mixed with sonicated samples. Samples were rotated overnight at 4°C, then washed once with 1 mL fRIP buffer and resuspended in 1 mL PolII ChIP Buffer (50 mM Tris-HCl pH 7.5, 140 mM NaCl, 1 mM EDTA, 1 mM EGTA, 1% Triton X-100, 0.1% Sodium-deoxycholate, 0.1% Sodium dodecyl sulfide) before transferring to a new 1.7 mL tube. Samples were rotated at 4°C for 5 min, spun down at 1200g, and the supernatant aspirated. Samples were washed twice more with 1 mL PolII ChIP Buffer, once with 1 mL High Salt ChIP Buffer (50 mM Tris-HCl pH 7.5, 500 mM NaCl, 1 mM EDTA, 1 mM EGTA, 0.1% sodium-deoxycholate, 0.1% sodium dodecyl sulfide, 1% Triton X-100), and once in 1 mL LiCl buffer (20 mM Tris pH 8.0, 1 mM EDTA, 250 mM LiCl, 0.5% NP-40, 0.5% sodium-deoxycholate); each wash included a 5-min rotation at 4°C. At the final wash, samples were transferred to a new 1.7 mL tube. After the final wash, inputs were thawed on ice and bead samples were resuspended in 56 µL water, 33 µL of 3× reverse-crosslinking buffer (3× PBS, 6% N-lauroyl sarcosine and 30 mM EDTA), 5 µL 100 mM DTT, 20 µL Proteinase K, and 1 µL of SuperaseIN. Samples were incubated for 1 h at 42°C, then 1 h at 55°C, then 65°C for 30 min, and mixed by pipetting every 15 min. Afterward, 1 mL TRIzol was added, samples were vortexed, 200 µL CHCl3 was added, samples were vortexed, and finally spun at 12,000g for 15 min at 4°C. The aqueous phase was then extracted and to that one volume of 100% ethanol was added. Samples were vortexed and applied to Zymo-Spin IC Columns (from #R1013) and spun for 30 sec at top speed on a benchtop microcentrifuge. An amount of 400 µL of RNA Wash Buffer (Zymo #R1013) was added and samples were spun at top speed for 30 sec. For each sample, 5 µL DNase I and 35 µL of DNA Digestion Buffer (Zymo #R1013) was added directly to the column matrix and incubated at room temp for 20 min. An amount of 400 µL of RNA Prep Buffer was then added (Zymo #R1013), and columns were spun at top speed for 30 sec. An amount of 700 µL RNA Wash Buffer (Zymo #R1013) was then added, and columns were spun at top speed for 30 sec. An amount of 400 µL RNA Wash Buffer was then added, and columns were spun at top speed for 30 sec. The flow through was discarded and columns spun again for 2 min to remove all traces of wash buffer. Columns were transferred to a clean 1.7 mL tube, 15 µL of ddH2O was added to each column, and after a 5-min incubation, samples were spun at top speed to elute.
Total RNA isolation
ESCs were grown in six-well plates to ∼80% confluency. Cells were washed twice with 1× PBS and 1 mL of TRIzol was added per well. Samples were pipetted up and down at least 10 times, transferred to a microcentrifuge tube and briefly vortexed. Samples were incubated at RT for 5 min, then 200 µL of chloroform was added. Afterwards, samples were vortexed and incubated for 3 min at RT. Samples were spun down at 12,000g for 15 min at 4°C. The upper aqueous phase was moved to a new tube and 8 µL of linear acrylamide (Thermo Fisher, AM9520) was added. Then 500 µL of 100% isopropanol was added, and samples were vortexed and incubated at RT for 10 min. Tubes were spun down 12,000g for 10 min at 4°C. Supernatant was removed and pellets washed with 1 mL of cold 75% ethanol. Samples were briefly vortexed and spun down at 7500g for 5 min at 4°C. Supernatant was discarded and pellet was dried by repeated spin down and aspiration. Final pellets were resuspended in 100 µL water by pipetting up and down.
RNA sequencing
For RIP-seq inputs, 100 ng of RNA prepared from RIP input samples was used for library preparations. For RIP-seq RIP samples, 9 µL of RIP sample (from 15 µL total) were used. For total RNA-seq, 900 ng of total RNA was used. Each library preparation included 1 µL of 1:250 dilution of ERCC Spike-In RNAs (Ambion #4456653). An amount of 10 µL total was prepped using the KAPA RNA HyperPrep Kit with RiboErase (Kapa Biosystems; product #KR1351). Sequencing was performed on an Illumina Next-seq 500, using high-output, 75-cycle kits.
H3K27me3 and total H3 ChIP-seq
The day before sonication, 25 µL of protein A/G agarose beads (Santa Cruz sc-2003) were washed three times in block solution (0.5% BSA in 1× PBS) before being resuspended in 300 µL blocking solution. An amount of 10 µL per 10 million cells of antibody (Abcam mouse monoclonal ab6002) was added, then beads and antibody conjugated via rotation overnight at 4°C.
On the day of sonication, 10 million ESCs crosslinked with 0.6% formaldehyde were resuspended in lysis buffer 1 (50 mM HEPES pH 7.3, 140 mM NaCl, 1 mM EDTA, 10% glycerol, 0.5% NP-40, 0.25% Triton X-100, and 1× PIC [PIC; Sigma product #P8340]) incubated for 10 min at 4°C, and then incubated with lysis buffer 2 (10 mM Tris-HCl pH 8.0, 200 mM NaCl, 1 mM EDTA pH 8.0, 0.5 mM EGTA pH 8.0, and 1× PIC) for 10 min at room temperature. For H3K27me3 ChIPs, cells were resuspended in lysis buffer 3 (10 mM Tris-HCl pH 8.0, 100 mM NaCl, 1 mM EDTA pH 8.0, 0.5 mM EGTA pH 8.0, 0.1% Na-deoxycholate, 0.5% N-lauroyl sarcosine, and 1× PIC) and then sonicated.
ChIPs were then performed by incubating sonicated cell lysates at a concentration of 20 million cells/1 mL of lysis buffer 3 containing 1% Triton X-100 with preconjugated H3K27me3 antibody/agarose beads overnight at 4°C. After overnight H3K27me3 ChIP, beads were washed 5× in RIPA buffer (50 mM HEPES pH 7.3, 500 mM LiCl, 1 mM EDTA, 1% NP-40, and 0.7% Na-deoxycholate) for 5 min each and then once in TE. To elute the DNA, beads were resuspended in Elution buffer (50 mM Tris pH 8.0, 10 mM EDTA, and 1% SDS) and placed on a 65°C heat block for 17 min with frequent vortexing. Crosslinks were reversed overnight at 65°C, eluates were incubated with Proteinase K and RNase A, and DNA was extracted with phenol/chloroform and precipitated with ethanol. DNA was prepared for sequencing on the Illumina platform using Next Reagents (NEB) and Agencourt AMPure XP beads (Beckman Coulter).
IP-mass spectrometry sample preparation
An amount of 40 µL protein A/G agarose beads (Santa Cruz sc-2003) were washed three times in blocking buffer (0.5% BSA in 1× PBS) and incubated overnight at 4°C with 20 µg antibody (anti-FLAG; Sigma F1804). 30 × 106 of ESCs crosslinked with formaldehyde as described above were resuspended in 500 µL RIPA Buffer (50 mM Tris-HCl, pH 8, 1% Triton X-100, 0.5% sodium-deoxycholate, 0.1% SDS, 5 mM EDTA, 150 mM KCl) supplemented with (1× PIC [PIC; Sigma product #P8340], 2.5 µL SuperaseIN [Thermo Fisher Scientific product #AM2696], and 0.5 mM DTT) and sonicated twice for 30 sec on and 1 min off at 30% output using Sonics Vibracell Sonicator (Model VCX130, serial #52223R). Samples were spun down at high speed and 50 µL total lysate was saved for input. Beads were washed three times in fRIP buffer (25 mM Tris-HCl pH 7.5, 5 mM EDTA, 0.5% NP-40, 150 mM KCl) and resuspended in 450 µL fRIP buffer supplemented with 1× PIC (PIC; Sigma product #P8340), 2.5 µL SuperaseIN (Thermo Fisher Scientific product #AM2696), and 0.5 mM DTT to bring samples to a 1:1 ratio of RIPA/fRIP buffer. Samples rotated overnight at 4°C. At 4°C, samples were then washed once with 1 mL fRIP buffer and then resuspended in 1 mL PolII ChIP Buffer (50 mM Tris-HCl pH 7.5, 140 mM NaCl, 1 mM EDTA, 1 mM EGTA, 1% Triton X-100, 0.1% Na-deoxycholate, 0.1% SDS) and transferred to a new Eppendorf tube. Samples were washed two more times with PolII ChIP Buffer, twice with High Salt CLIP Buffer (50 mM Tris-HCl pH 7.4, 1 M NaCl, 1 mM EDTA, 1% NP-40, 0.5% Na-deoxycholate, 0.1% SDS), and resuspended in 1 mL LiCl buffer (20 mM Tris pH 8.0, 1 mM EDTA, 250 mM LiCl, 0.5% NP-40, 0.5% Na-deoxycholate) and moved to a new microcentrifuge tube. Samples were then resuspended in cold 1× PBS and moved to a new Eppendorf tube. Samples were washed 3× with 1 mL cold 1× PBS. Twenty-five percent of samples were saved for western blot, and the remaining 75% were subjected to on-bead trypsin digestion as previously described (Rank et al. 2021). Briefly, after the last wash buffer step during affinity purification, beads were resuspended in 50 µL of 50 mM ammonium bicarbonate (pH 8). On-bead digestion was performed by adding 50 µL of 50 mM ammonium bicarbonate (pH 8) and 1 µg trypsin and incubated, shaking, overnight at 37°C. Beads were pelleted and supernatants were transferred to fresh tubes. The beads were washed twice with 100 µL LC–MS grade water, and washes added to the original supernatants. Samples were acidified by adding formic acid to a final concentration of 2%, to pH ∼ 2. Peptides were desalted using peptide desalting spin columns (Thermo), lyophilized, and stored at −80°C until further analysis.
LC/MS/MS analysis
The peptide samples were analyzed by LC/MS/MS using an Easy nLC 1200 coupled to a QExactive HF Biopharma mass spectrometer (Thermo Scientific). Samples were injected onto an Easy Spray PepMap C18 column (75 µm id × 25 cm, 2 µm particle size) (Thermo Scientific) and separated over a 2-h method. The gradient for separation consisted of 5%–45% mobile phase B at a 250 nL/min flow rate, where mobile phase A was 0.1% formic acid in water and mobile phase B consisted of 0.1% formic acid in acetonitrile (ACN). The QExactive HF was operated in a data-dependent mode where the 15 most intense precursors were selected for subsequent fragmentation. Resolution for the precursor scan (m/z 350–1700) was set to 60,000, while MS/MS scans resolution was set to 15,000. The normalized collision energy was set to 27% for HCD. Peptide match was set to preferred, and precursors with unknown charge or a charge state of 1 and ≥7 were excluded.
Immunofluorescence
Cells were plated at low density on coverslips 24 h before fixation. For fixation, cells were incubated in 4% paraformaldehyde for 10 min at room temperature. Cells were then washed once with 1× PBS, then put on ice and incubated with cold 1× PBS with 0.5% Triton X-100 and 1× VRC for 10 min. Cells were then washed once in cold 70% ethanol, and then stored in 70% ethanol at −20°C until use. For IF, coverslips were quartered with a diamond-tipped glass scoring tool, then washed twice with 300–400 µL 1× PBS, and blocked for 30 min at RT in 300–400 µL of blocking buffer (1× PBS + 0.2% Tween-20 + 10 mg/mL IgG-free BSA [Jackson Immuno]). After blocking, coverslips were incubated with primary antibody diluted in blocking buffer for 1 h at RT, then washed using three 4-min incubations in 1× PBS + 0.2% Tween-20. Secondary antibody (1:1000 dilution in blocking buffer) was then added and incubated for 30 min at RT in the dark. Coverslips were then washed using three 4-min incubations in 1× PBS + 0.2% Tween-20, rinsed twice with 1× PBS, and fixed face down on slides using 8 µL Prolong Gold with DAPI (Invitrogen). Slides cured overnight at RT in the dark before imaging. Images were taken with 63× or 100× objectives on a Leica DMi8 inverted confocal microscope, using Leica Application Suite X software version 3.7.5.24914. Z-slice sizes were 0.2 µm. Images were deconvolved with Huygens Essential version 20.04.0p3 64b (Scientific Volume Imaging, http://svi.nl) using the standard deconvolution profile under batch express. Images were analyzed using FIJI (Schindelin et al. 2012). Antibodies and dilutions used can be found in Supplemental Table S11.
Computational analyses
RIP- and RNA-seq alignment
RIP and RNA-seq data were aligned to the mm10 mouse genome using STAR with default parameters (Dobin et al. 2013). Alignments with a quality score ≥30 were retained for subsequent analyses (Li et al. 2009). For analysis of multimapping reads with TElocal (Jin et al. 2015), additional parameters (‐‐winAnchorMultimapNmax 100 and ‐‐outFilterMultimapNmax 100) were specified in STAR alignments.
RIP peak calling
After alignment and filtering, all SAFB RIP-seq data from WT ESC replicates were concatenated, and using SAMtools, were split into two files, corresponding to alignments that mapped to the positive and negative strands of the genome, respectively. Using a custom perl script, the strand information within the positive and negative strand alignment files was randomized so as to better match the criteria of the MACS peak caller, which uses the average distance between positive and negative strand alignments to estimate the fragment length (Zhang et al. 2008). Putative peaks were called on strand-randomized positive and negative strand alignment files, respectively, using default MACS parameters and not providing a background file (Zhang et al. 2008). Peak bed files were converted to SAF format and reads under each putative peak were counted from SAFB RIP-seq alignments performed in WT and DKO ESCs using featureCounts (Liao et al. 2014). We retained putative peaks that were represented by at least five reads in at least two of the three WT ESC lines profiled. We then used DESeq2 under default parameters to identify those putative peaks that were ascribed a P-value of <0.05 by DESeq2 when comparing signal between SAFB/2 DKO ESCs and WT ESCs. Lastly, we retained only those putative peaks that harbored an average aligned-reads-per-million-total-reads (RPM) signal of at least twofold less in SAFB/2 DKO ESCs compared to WT ESCs. This yielded 32,354 regions that were potentially enriched in their association with SAFB in WT ESCs. As a final filtering step, we used featureCounts to count the number of reads under these 32,354 regions that aligned to the mm10 genome with quality scores of ≥30 from within the SAFB-FLAG and GFP-FLAG RIP-seq data sets. From the initial set of 32,354 regions, 23,853 had a total of at least five reads distributed between the SAFB-FLAG and GFP-FLAG; of these, 1356 regions had higher signal in the GFP-FLAG compared to the SAFB-FLAG RIP-seq data set and were dropped from further analysis, yielding a total of 30,998 regions that we defined as SAFB-associated peaks (Supplemental Table S1).
RIP scatter plots
Scatter plots in Figure 2 were constructed using featureCounts to count the reads under each of the 30,998 SAFB peaks in each data set. Read counts were then plotted using R (R Core Team 2021).
SAFB motif analysis
To identify the motifs associated with SAFB peaks, we provided the sequences of the two thousand peaks with the greatest level of SAFB signal (top ∼10% of peaks) as input to the sensitive, thorough, rapid, enriched motif elicitation (STREME) tool from the MEME Suite (Bailey et al. 2015; Bailey 2021). Randomized control sequences with lengths the same as each of the peak sequences were developed with weighted nucleotide occurrence based on the mononucleotide content of the mm10 reference genome. The ‐‐rna flag was specified to account only for single-stranded analysis and motif width was restricted to between four and eight nucleotides; the motifs with the top three most significant P-values are shown in Figure 2D.
UCSC wiggle density plots
UCSC wiggle density plots were made from filtered sam files using custom perl scripts. Tracks of individual and pooled replicates are located here: https://genome.ucsc.edu/s/recherney/Cherney_Safb_2022.
Intersection of SAFB peaks and genic features
To identify the genic features under each SAFB peak, the GENCODE Basic vM25 GTF was downloaded and modified to include annotations of 5′- and 3′-UTRs (Frankish et al. 2021). From this file, features mapping to protein-coding genes (GENCODE transcript_type: “protein_coding”) and lncRNAs (GENCODE transcript_types: “bidirectional_promoter_lncRNA,” “macro_lncRNA,” “antisense,” “3prime_overlapping_ncRNA,” “lincRNA,” “processed_transcript,” “sense_intronic,” and “sense_overlapping”) were extracted and intersected with SAFB peaks using bedtools (Quinlan and Hall 2010). Peaks were classified as exon-overlapping if they fell within a gene and overlapped >50% of the exon in question, otherwise, they were classified as intron-overlapping. The classification of each peak can be found in Supplemental Table S1.
Intersection of SAFB peaks and repeat-masked elements
To determine whether SAFB peaks overlapped with repeat-masked genomic elements more than would be expected by random chance, repeat-masked elements were first extracted from all 20 mouse autosomes and the X chromosome using the UCSC genome browser MySQL relational database (Lee et al. 2022). Peaks were then intersected with repeat-masked elements using bedtools (Quinlan and Hall 2010). To estimate what level of intersection might be expected from random chance, we performed 1000 repetitions of the following process: the starting position of each peak in the set of SAFB peaks was shifted randomly to a new position between 2000 and 10,000 bases upstream or downstream; then, each complete set of randomized set of peaks was intersected with repeat-masked elements extracted from UCSC. The error bars in Figure 2G represent the standard deviation of the number of intersections with each class of repeat-masked element from each set of randomized peaks.
Intersection of multimapping RIP reads with repeat-derived elements
To determine the relative representation of repeat-derived elements in multimapping reads from SAFB RIPs, reads were aligned to mm10 with STAR using the parameters recommended by TElocal (‐‐winAnchorMultimapNmax 100 and ‐‐outFilterMultimapNmax 100; Jin et al. 2015). SAMtools was then used to extract alignments with MAPQ = 0 (i.e., multimapping reads; Li et al. 2009). Relative read abundance over repeat-derived elements was then calculated with TElocal, using the prebuilt “mm10_rmsk_TE.gtf.locInd” index and the “‐‐stranded reverse” option (Jin et al. 2015). Counts from TElocal were converted to RPM values (reads-per-million-total-reads). We retained only those elements that were represented by an RPM value of ≥1 summed across all data sets, were represented by an average RPM of ≥0.25 in the WT RIPs, and that had greater than or equal to twofold higher RPM in the WT compared to DKO RIPs. To determine the expected representation of each class of repeat in this final list of filtered elements, we summed the genomic space occupied by each class of repeat in the mm10_rmsk_TE.gtf from TElocal, and used this information to calculate the expected genomic space occupied by each class of repeat in our final list of filtered elements. We then used χ2 tests to determine whether the actual genomic space occupied by each class of repeat in our final list of filtered elements differed significantly from what was expected. Classes of repeat that were represented by less than 25 elements in our final filtered list were not plotted in Figure 2H. Processed data used to generate Figure 2H are included in Supplemental Table S2.
Differential gene expression analyses
To detect genes that were differentially expressed between WT and SAFB/2 DKO ESCs, we performed RNA-seq on “Input” RNA extracted from the same sonicated extracts of formaldehyde-crosslinked WT and DKO ESCs samples that were used to perform SAFB RIP-seq described in Figure 2—the RNA extraction protocol is detailed in the “RNA-IPs” section of the methods. “Input” RNA Reads were aligned to mm10 using STAR and default parameters (Dobin et al. 2013), alignments were filtered to retain only those reads with a mapping-quality of ≥30 using SAMtools (Li et al. 2009), and then the number of filtered reads mapping to each GENCODE vM25 gene was counted using featureCounts (Liao et al. 2014): [-g gene_name -s 2 -a gencode.vM25.basic.annotation.gtf -o]. Genes that had less than 10 total reads summed across all five samples (three WT and two DKO) were excluded from downstream analyses. Counts were loaded into DESeq2, and the genes that had adjusted P-values for differential expression between WT and DKO samples of <0.05 were retained and reported as “significant” in Supplemental Table S3.
Differential splicing analyses
Fastq files were aligned to the mm10 genome using STAR v2.7.10b using default parameters (Dobin et al. 2013). Files were sorted and indexed using SAMtools v1.16 (Li et al. 2009) before using rMATS 4.1.1 to compare splicing events in WT and DKO ESCs, and in GFP- and SAFB-rescue DKO ESCs (Shen et al. 2014). Events were called significant if their PSI values in WT versus DKO ESCs, or GFP- versus SAFB-rescue DKO ESCs, were ascribed an adjusted P-value of <0.05. Significant events can be found in Supplemental Table S6.
Gene set enrichment analyses
Gene set enrichment analyses of differentially expressed genes were performed using the MSigDB webserver (Liberzon et al. 2015). The lists of significantly down- and up-regulated genes were input, orthology mapped onto the human genome, and queried for overlap with the Hallmark, Chemical and Genetic Perturbations, and GO Biological Process Gene Sets. The top 20 most significantly overlapping gene sets from each search are reported in Supplemental Table S4.
Assessing SAFB RIP signal over spliced and unspliced transcripts
To determine the extent to which SAFB was enriched over expressed spliced and unspliced transcripts, we took advantage of the kallisto algorithm, which was designed to enable probabilistic alignment of short-read RNA-seq data (Bray et al. 2016). To enable the detection of unspliced transcripts, we created a version of the GENCODE vM25 basic transcriptome that for each gene, included one representative unspliced transcript that began at the first annotated transcription start and the last annotated transcription end (vM25_basic_complete.fa).
In parallel, because like all RIP- or CLIP-seq data sets, our RIP-seq data sets contained reads that align to genomic regions that were not classified as peaks, we selected for our downstream analyses only the subset of RIP-seq reads that aligned under SAFB peaks. To do this, SAFB RIP-seq reads from WT and DKO data sets were aligned to mm10 using STAR and filtered for mapping quality ≥30 using SAMtools (Li et al. 2009; Dobin et al. 2013). We then used SAMtools to split the alignments by strand, and for each stranded alignment file, again using SAMtools, selected the subset of alignments from the WT and DKO data sets that aligned under each SAFB peak. Still using SAMtools, we converted the bam alignments back into fastq data. These final fastq files represent the subset of RIP-seq data that aligned under each classified peak and exclude most noise in the WT data set. Input RNA-seq and the subset RIP-seq data were then aligned with kallisto to an index made from vM25_basic_complete.fa, using the options [-l 200 -s 50 ‐‐rf-stranded]. For each transcript isoform in vM25_basic_complete.fa, TPM counts reported from the DKO RIP-seq data set were subtracted from TPM counts in the WT RIP-seq data set. The output file then underwent the following filtering parameters: (i) Transcript isoforms that we had previously filtered out prior to performing DESeq analyses were excluded; (ii) for each gene remaining, we retained the single spliced isoform with the highest expression level as representative; and (iii) transcript isoforms whose expression in the WT input total RNA-seq data were less than 0.125 TPM were excluded, including 25 and 14 genes that were originally called significantly up- and down-regulated by DESeq2, respectively. Finally, we split the transcripts of the genes that did not significantly change in expression upon DKO into three categories: those with low (0.125–1 TPM), medium (>1 but <16 TPM) and high (>16 TPM) levels of expression. Data used to make plots in Figure 3D are included in Supplemental Table S5.
IUPred2
Protein disorder plots for SAFB were constructed using the webserver for IUPred2A (Erdos and Dosztanyi 2020).
Kallisto analyses of rescue RNA-seq data
To determine the relative abundance of spliced and unspliced transcript isoforms between the SAFB-FL-WT, SAFB-ΔDD3, and GFP rescue data sets, RNA-seq data were aligned using kallisto to an index made from vM25_basic_complete.fa, using the options [-l 200 -s 50 ‐‐rf-stranded]. The output file then underwent the same filtering as in Figure 3D: (i) Transcripts isoforms that we had previously filtered out prior to performing DESeq analyses were excluded (62,934), (ii) for each gene remaining, we retained the single spliced isoform with the highest expression level as representative, and lastly, (iii) transcript isoforms whose averaged expression of the two SAFB-FL-WT replicates in the total RNA-seq data were less than 0.125 TPM were excluded, including 23 and 20 genes that were originally called significantly up- and down-regulated by DESeq2, respectively. We then normalized each individual replicate TPM value to the SAFB-FL-WT TPM average. P-values were determined using a paired t-test. Data used to make plots in Figure 5D and E are included in Supplemental Table S5.
Mass spectrometry data analysis
Raw data files were processed using MaxQuant version 1.6.15.0 and searched against the reviewed mouse database (containing 17,051 entries), appended with a contaminants database, using Andromeda within MaxQuant. Enzyme specificity was set to trypsin, up to two missed cleavage sites were allowed, and methionine oxidation and amino-terminus acetylation were set as variable modifications. A 1% FDR was used to filter all data. Match between runs was enabled (5 min match time window, 20 min alignment window), and a minimum of two unique peptides was required for label-free quantitation using the LFQ intensities. Perseus was used for further processing (Tyanova et al. 2016). Only proteins with >1 unique + razor peptide were used for LFQ analysis. Proteins with 50% missing values were removed and missing values were imputed from normal distribution within Perseus. Log2 fold change (FC) ratios were calculated using the averaged log2 LFQ intensities of the IP sample compared to the GFP control. Proteins with log2 FC > 1 were considered biological interactors and analyzed further. All analyzed protein interaction data are present in Supplemental Table S7. The mass spectrometry proteomics data have been deposited to the ProteomeXchange Consortium via the PRIDE partner repository (Perez-Riverol et al. 2022) with the data set identifier PXD038103.
DAVID GO analysis
GO analyses were conducted using DAVID (Huang da et al. 2009; Sherman et al. 2022). Genes were searched against UP_ KW_BIOLOGICAL_PROCESS, UP_KW_CELLULAR_COMPONENT, UP_KW_MOLECULAR_FUNCTION, GOTERM_BP_DIRECT, GOTERM_CC_DIRECT and GOTERM_MF_DIRECT. The list shown in Figure 6 represents the union of the top twelve most enriched CC and MF GO terms from the WT SAFB and HNRNPU pulldowns that also passed an FDR of <0.01. The bubbleplot in Figure 6 was created using tidyverse v 1.3.1 package in R version 4.0.4 (Wickham et al. 2019; R Core Team 2021).
Custom gene set enrichment analyses
To determine whether the SAFB and HNRNPU immunoprecipitates were enriched in proteins found in nuclear speckles (Saitoh et al. 2004), paraspeckles (Yamazaki and Hirose 2015), or proteins that harbor RS domains (Cascarina and Ross 2022), we used the lists of proteins reported in the aforementioned references and the 69 and 165 proteins that we classified as enriched over GFP control in the SAFB and HNRNPU IPs, respectively (Supplemental Table S7). We followed the gene ranking metric referred to as “log2 ratio of classes” (LRC) and the GSEA framework described in Subramanian et al. (2005). However, we decided to use a custom version of GSEA, instead of the standard version, to account for (i) the limited number of genes in our two data sets, (ii) the number of replicates available (two for each sample), which is lower than the canonical threshold of at least seven recommended by the GSEA authors for phenotype permutations, and (iii) the few gene sets (only three), which were tested at the same time. Briefly, prior to calculating enrichments, the average LFQ values per protein per data set were calculated and divided by the average LFQ values of each protein in the GFP IP; this ratio was then log2 transformed. Enrichment and depletion scores were then calculated separately for each data set. To calculate the enrichment/depletion score (EDS), for each gene set and data set of interest, we first converted log2-transformed ratios into a ranked list. The highest rank was defined as the numerical value that corresponds to the total number of rows in the list in question and was assigned to the corresponding gene in the data set that had the highest log2-transformed ratio in the list. The lowest rank was defined as a value of 1 and was assigned to the gene in the data set that had the lowest log2-transformed ratio in the list. These ranks were then assigned to the genes of each gene set and their averages became the EDSs, which are specific for each data set (SAFB and HNRNPU), gene set (speckle, paraspeckle, and SR proteins), and condition (full protein vs. protein with a deleted domain). The neutral point (NP) for each data set in each gene set is equal to the [(# genes in the data set +1)/2]. Specifically, the EDS of each gene set was then defined as the average rank of genes in each data set that were present in the gene set. Gene sets whose EDS > NP were classified as “enriched” and those whose EDS < NP were classified as “depleted.” To assess statistical significance, we generated random EDS values by averaging the ranks of as many randomly selected data set genes as those present in each gene set and repeated this process, for each data set, each gene set and each protein form (full or with a deleted domain) 100,000 times. Then, we assessed the probability that each EDS was produced by chance following the approach outlined in Mielke and Berry (2007), in which the P-value for enrichment ≈ [(number of permutated cases with EDS ≥ NP)/(number of total permutations performed)] or, in the case of depletion, using as the numerator of this ratio [# permutated gene sets with EDS ≤ NP]. Resulting P-values were Bonferroni-corrected, thus controlling for the FWER as recommended in Olejnik et al. (1997) and Subramanian et al. (2005). The FWER was assessed at three levels: 0.10 (*), 0.05 (**), and 0.01 (***). We performed Bonferroni correction by keeping together enriched and depleted gene sets, when they were present at the same time (namely, in the HNRNPU data set of the full protein), thus producing more conservative statistical results than performing the correction after splitting enrichment and depletion cases, as done in standard GSEA.
Analysis of H3K27me3 ChIP-seq data
H3K27me3 data were merged by genotype (WT and DKO, respectively) and total H3 data were merged. Data were then aligned to mm10 using bowtie2 (Langmead and Salzberg 2012). Peaks were called using MACS2 with total H3 as a control under the following parameters: [macs2 callpeak -t -c bam -n -f BAM -g mm –broad –broad-cutoff 0.01] (Zhang et al. 2008). H3K27me3 peak locations are included in Supplemental Table S7. WT and DKO peak files were catenated and then merged using bedtools [bedtools merge -I in.file > out.file]. The independent WT and DKO data sets were intersected with the merged data file [bedtools intersect -wao -header -a union file -b wt or dko file > outfile] to identify WT and DKO-specific H3K27me3 peaks.
H3K27me3 analyses
To annotate gene promoters, we took the gencode.vM25.basic.annotation.gtf file and filtered features for transcripts only. We then took the coordinates of the transcription start site from each transcript and added 2 kb upstream and 1 kb downstream (3 kb total) and used this region as the transcript promotor region. We then used featureCounts (featureCounts -s 0 -F SAF -a promoter.file -o out.file) to align H3K27me3 reads to our annotated promoters. We then used bedtools (bedtools intersect -wao -header -a promoter.file -b k27peaksfile > out.file) to intersect our previously called H3K27me3 peaks in our WT and DKO files with our promoter file to find the levels of H3K27me3 at promoters.
To perform allelic H3K27me3 analyses, variant sequence data for the mm10 genome build was obtained from the Sanger Institute (http://www.sanger.ac.uk/resources/mouse/genomes/; Keane et al. 2011), and a CAST/EiJ (CAST) pseudogenome was created as in Calabrese et al. (2012, 2015). Reads were aligned to both the B6 and CAST version of mm10 using STAR, and those that had a mapping quality greater than or equal to 30 were extracted with SAMtools. Reads that overlapped B6 or CAST SNPs were detected using a custom perl script as in Calabrese et al. (2012, 2015). Allelic tiling density plots over chr6 were created as in Schertzer et al. (2019a), using a bin size of 4000 bp.
Allelic RNA-seq analysis
To determine the extent of gene silencing by Xist across genotypes, RNA-seq reads were aligned and processed as described in Trotman et al. (2020, 2023). Briefly, reads were aligned to B6 and CAST pseudogenomes using STAR and default parameters (Dobin et al. 2013), alignments were filtered to retain only those reads with a mapping-quality of ≥30 using SAMtools (Li et al. 2009), and uniquely aligning reads that overlapped B6 or CAST SNPs were summed under each gene using custom perl scripts as in Trotman et al. (2020, 2023). Read counts per gene were then normalized to reads-per-million total reads (RPM). Across SAFB genotypes, we examined the set of 242 genes whose B6 expression levels on chr6 differed between Xist-expressing and nonexpressing ESCs at an adjusted P-value threshold of <0.01 (Supplemental Table S9; Trotman et al. 2023).
SUPPLEMENTAL MATERIAL
Supplemental material is available for this article.
ACKNOWLEDGMENTS
We thank UNC colleagues for many helpful discussions. This work was supported by the NIH National Institute of General Medical Sciences (NIGMS) grant number R01GM136819 to J.M.C., T32 GM007092 to R.E.C., Eunice Kennedy Shriver National Institute of Child Health and Human Development (NICHD) grant number F31 HD103334 to R.E.C., and NCI T32CA217824 to J.B.T. D.D. was supported by R35GM142864. The proteomics work was conducted at the UNC Proteomics Core Facility, which is supported in part by an NCI Center Core Support grant (2P30CA016086-45) to the UNC Lineberger Comprehensive Cancer Center. A.P. was supported through the UNC RNA Discovery Center.
Footnotes
-
Article is online at http://www.rnajournal.org/cgi/doi/10.1261/rna.079569.122.
- Received December 21, 2022.
- Accepted June 23, 2023.
This article is distributed exclusively by the RNA Society for the first 12 months after the full-issue publication date (see http://rnajournal.cshlp.org/site/misc/terms.xhtml). After 12 months, it is available under a Creative Commons License (Attribution-NonCommercial 4.0 International), as described at http://creativecommons.org/licenses/by-nc/4.0/.
REFERENCES
MEET THE FIRST AUTHOR

Meet the First Author(s) is an editorial feature within RNA, in which the first author(s) of research-based papers in each issue have the opportunity to introduce themselves and their work to readers of RNA and the RNA research community. Rachel Cherney is the first author of this paper, “SAFB associates with nascent RNAs and can promote gene expression in mouse embryonic stem cells.” Rachel is a Graduate Research Assistant in the J. Mauro Calabrese laboratory at the University of North Carolina at Chapel Hill, where they study gene regulation by long noncoding RNAs.
What are the major results described in your paper and how do they impact this branch of the field?
We found that in mouse embryonic stem cells, SAFB preferentially binds introns of transcripts and interacts with speckle proteins and splicing factors through its carboxy-terminal domain. Loss of SAFB alters the expression of genes in important developmental pathways. We know that loss of SAFB severely affects development and fertility, therefore identifying biochemical interactions that lead to gene expression perturbations provides insight as to how SAFB is involved in early development.
What led you to study RNA or this aspect of RNA science?
When I started graduate school, I was interested in chromatin and epigenetics—I did not expect to work with RNA at all. During first-year rotations, I found X chromosome inactivation very interesting and didn't realize how important lncRNAs were for gene silencing. I found the interplay between RNAs and epigenetics fascinating and am glad I pursued this path.
What are some of the landmark moments that provoked your interest in science or your development as a scientist?
Some landmark moments that propelled my pursuit of science occurred during my school and college years. I found my scientific passion early on, and college helped me find research. I have always liked genetics—it was my favorite part of science class growing up. I was fortunate that my undergraduate institution, UW Madison, had genetics as a major and encouraged research. I worked in Dr. Catherine Fox's lab for four years. Her lab was fun, hard-working, collaborative, and supportive. This was very impactful for me in my development as a scientist because it allowed me to understand what kind of lab environment I needed to succeed.
What are your subsequent near- or long-term career plans?
I would ultimately love to have a career involved in improving women's reproductive health and fertility, whether my role be in research and development, policy and advocacy, or another facet of healthcare. These health areas are crucial because half of the population comprises women; yet they are underserved and underfunded.




