


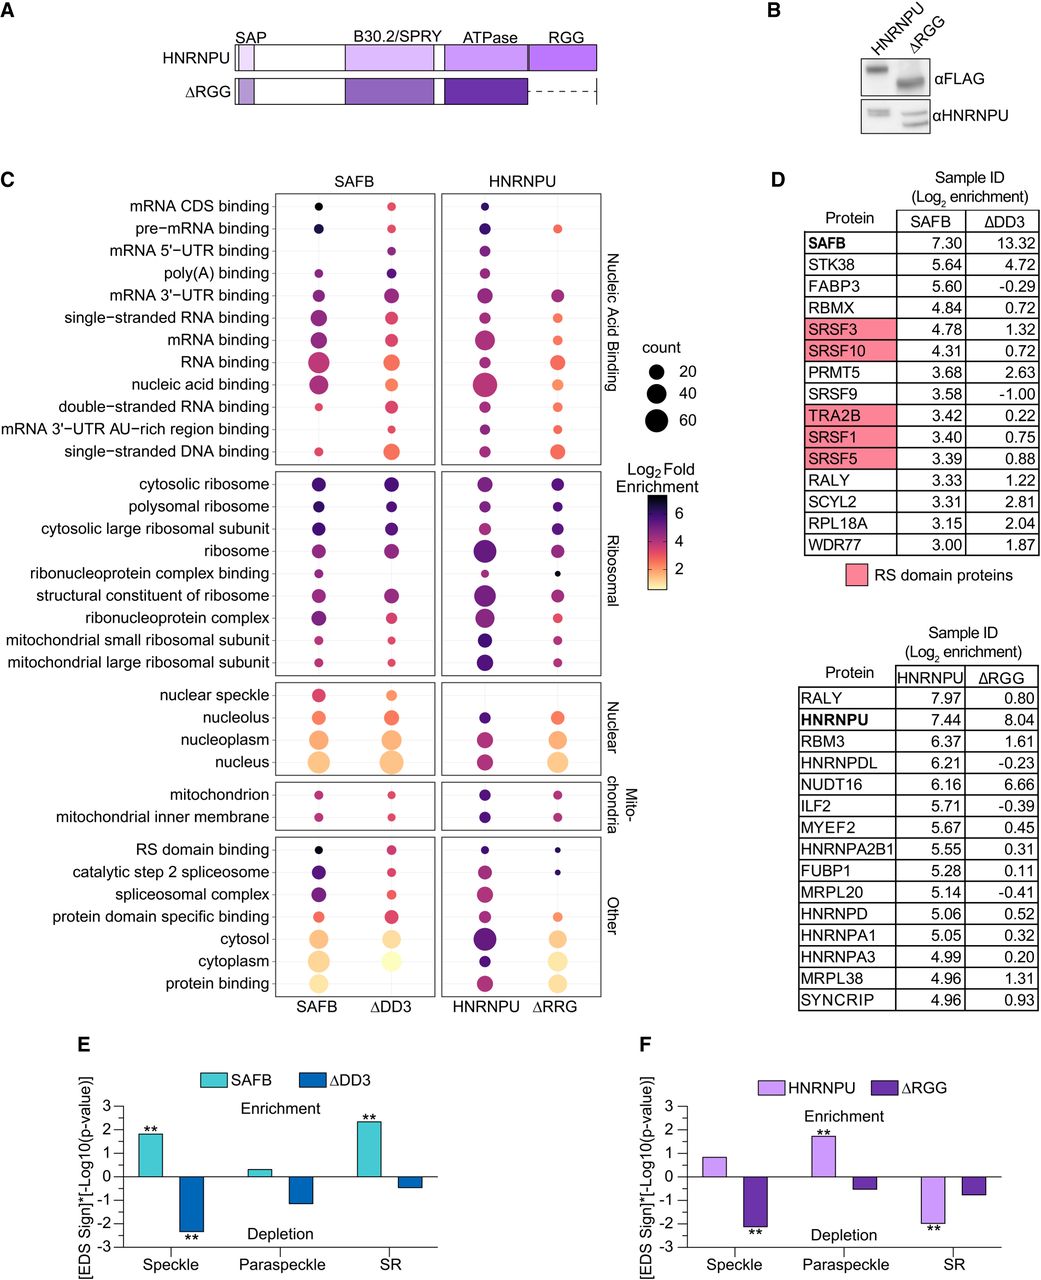
The carboxy-terminal region of SAFB interacts with RS domain-containing and speckle-associated proteins. (A) Protein domain diagram of HNRNPU (top) and ΔRGG (bottom). (B) αFLAG and αHNRNPU Western blot analyses of HNRNPU and ΔRGG-expressing cells. In the blot probed with αHNRNPU (lower panel), both endogenous HNRNPU and FLAG-tagged HNRNPU are visible. (C) Top gene ontology (GO) terms from SAFB and HNRNPU IPs. (D) Top 15 most-enriched proteins in (i) SAFB and (ii) HNRNPU IP-MS samples. Log2 LFQ enrichment values relative to GFP control are also shown. Proteins with RS domains curated in Cascarina and Ross (2022) are shaded red. (E,F) P-values denoting the significance of Gene Set Enrichment/Depletion in SAFB and HNRNPU proteomic data sets, corrected for family-wise error rate (FWER) (Olejnik et al. 1997; Subramanian et al. 2005). −Log10(P-values) for enrichment (EDS sign = 1) and depletion (EDS sign = −1) are shown on the y-axis on positive and negative scales, respectively. (**) FWER < 0.05.




