


Spatial arrangement of functional domains in OxyS stress response sRNA
- 1Slovenian NMR Centre, National Institute of Chemistry, SI-1000 Ljubljana, Slovenia
- 2Faculty of Chemistry and Chemical Technology, University of Ljubljana, SI-1000 Ljubljana, Slovenia
- 3Institute of Inorganic Chemistry, Graz University of Technology, 8010 Graz, Austria
- 4EN-FIST Centre of Excellence, SI-1000 Ljubljana, Slovenia
- Corresponding author: peter.podbevsek{at}ki.si
Abstract
Small noncoding RNAs are an important class of regulatory RNAs in bacteria, often regulating responses to changes in environmental conditions. OxyS is a 110 nt, stable, trans-encoded small RNA found in Escherichia coli and is induced by an increased concentration of hydrogen peroxide. OxyS has an important regulatory role in cell stress response, affecting the expression of multiple genes. In this work, we investigated the structure of OxyS and the interaction with fhlA mRNA using nuclear magnetic resonance spectroscopy, small-angle X-ray scattering, and unbiased molecular dynamics simulations. We determined the secondary structures of isolated stem–loops and confirmed their structural integrity in OxyS. Unexpectedly, stem–loop SL4 was identified in the region that was predicted to be unstructured. Three-dimensional models of OxyS demonstrate that OxyS adopts an extended structure with four solvent-exposed stem–loops, which are available for interaction with other RNAs and proteins. Furthermore, we provide evidence of base-pairing between OxyS and fhlA mRNA.
Keywords
INTRODUCTION
Reactive oxygen species (ROS), such as superoxide (O2−) and hydrogen peroxide (H2O2), are common by-products of oxygen metabolism that can damage nucleic acids, proteins, and other cellular components. To offset endogenously produced ROS and remedy the imposed damage, bacteria have evolved complex regulatory systems (Fasnacht and Polacek 2021). Small RNAs (sRNAs) are important regulators of various physiological responses in bacteria (Waters and Storz 2009). These noncoding RNAs are usually 50–300 nt long and act as post-transcriptional regulators (Storz et al. 2011). In Escherichia coli, several noncoding sRNAs with regulatory roles in stress response and adaptation to environmental changes have been identified (Gottesman 2004). Trans-encoded sRNAs are an important and extensively studied class of sRNAs distinguished by partial complementarity with their messenger (mRNA) targets, which they regulate by base-pairing interactions. Most known trans-encoded sRNAs reduce protein levels through translational inhibition and degradation of target mRNA (Gottesman 2005; Aiba 2007; Waters and Storz 2009). Many trans-encoded sRNAs require the RNA chaperone Hfq for their regulatory activity. Hfq can simultaneously bind and alter secondary structures of sRNAs and mRNA targets to promote the sRNA–mRNA base-pairing. Hfq may also serve as a platform to increase the local concentrations of sRNAs and their mRNA targets (Valentin-Hansen et al. 2004; Aiba 2007; Brennan and Link 2007). The structures of individual sRNAs play an important role in competition among sRNAs for binding to Hfq and in the recognition of cognate sRNA–mRNA pairs by Hfq (Santiago-Frangos and Woodson 2018; Roca et al. 2022).
OxyS, a 110 nt sRNA, was discovered in 1985 as one of the first regulatory sRNAs in E. coli (Wassarman et al. 1999; Gottesman and Storz 2015). It is regulated by OxyR and induced in high concentration in response to oxidative stress caused by elevated concentrations of H2O2 (Altuvia et al. 1997; Semchyshyn 2009). OxyS is a global pleiotropic regulator using several mechanisms of action and affecting the expression of over 40 genes (Wassarman et al. 1999). OxyS plays an important role in maintaining H2O2 homeostasis by down-regulating high H2O2 output processes and in protecting cells against oxidative damage (Altuvia et al. 1997; González-Flecha and Demple 1999). One such process is the formate metabolism, namely the synthesis of the formate hydrogenlyase complex, regulated by FhlA. Under conditions of oxidative stress, the metal cofactors involved in the formate hydrogenlyase complex could lead to cell damage. However, this is prevented by OxyS, which represses FhlA expression via a bipartite interaction with the 5′ region of fhlA mRNA resulting in a stable sRNA–mRNA complex (Altuvia et al. 1997). The interaction involves two short segments of OxyS that base pair with complementary sequences within fhlA, one overlapping the ribosome binding site (RBS) and the other at the CDS site (Fig. 1).
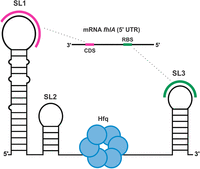
Schematic of the secondary structure of OxyS (black) and interaction sites between OxyS and mRNA fhlA (pink, green) as predicted at the outset of the study. Accessory protein Hfq (blue) was suggested to bind the unstructured linker between SL2 and SL3.
Interaction sites of both OxyS and fhlA were shown to reside mostly within loops and bulges, making them accessible for base-pairing (Argaman and Altuvia 2000; Salim and Feig 2010). The interaction between OxyS and CDS of fhlA facilitates the interaction between OxyS and the fhlA RBS. As a result, the repression of fhlA translation is most effective when the interaction occurs at both CDS and RBS simultaneously (Altuvia et al. 1998; Argaman and Altuvia 2000). The fhlA–OxyS interaction is further enhanced by the accessory protein Hfq, which promotes base-pairing in many sRNA–mRNA complexes in E. coli (Zhang et al. 2002). Hfq features four sRNA and mRNA binding surfaces, namely: the proximal face, distal face, lateral rim, and carboxy-terminal tail (Updegrove et al. 2016). OxyS is able to interact with Hfq at its proximal and distal faces as well as the lateral rim (Olejniczak 2011; Henderson et al. 2013; Wang et al. 2015; Li et al. 2021; Cai et al. 2022). Short A-rich oligonucleotides from the single-stranded linker region of OxyS were shown to bind the distal face of Hfq (Wang et al. 2015). Small-angle X-ray scattering (SAXS) data showed that the structure of OxyS is altered upon binding to Hfq, whereas the structure of Hfq remains mostly unchanged (Henderson et al. 2013). More recently, Hfq was shown to compact and remodel OxyS in a multistep process (Cai et al. 2022).
Since the function of sRNA is closely linked to its secondary and tertiary structures, understanding of associated regulatory processes requires detailed knowledge of the structure of sRNA alone and in complex with its binding partners. Despite the evident biological role of OxyS and its importance for the regulation of stress response in E. coli, the structure of OxyS and its complexes with mRNAs have not been studied by high-resolution methods. The nucleotide sequence of OxyS suggests the presence of three stem–loops (Fig. 1), of which two were experimentally verified by chemical footprinting (Altuvia et al. 1997). We set out to identify all secondary structure elements of OxyS and determine their relative spatial orientations. For this purpose, we combined solution-state nuclear magnetic resonance (NMR) spectroscopy with SAXS, de novo modeling and unbiased molecular dynamics (MD) simulations. Herein, we provide secondary structures of the isolated stem–loops, as well as secondary structure and three-dimensional models of complete 110 nt OxyS. We characterize a previously unidentified internal stem–loop, which is formed in the region that was predicted to be unstructured. Using our spectroscopic data, we were able to map regions of OxyS, which are imperative for base-pairing with fhlA mRNA. Spatial positioning of the two regions within OxyS suggests their preorganization for efficient bipartite interaction with fhlA and subsequent regulation of stress response.
RESULTS
Truncated SL1, SL2, and SL3 form stable stem–loops
The 1D 1H NMR spectrum of OxyS at 25°C revealed numerous signals in the imino region (10.3–14.3 ppm), indicative of multiple Watson–Crick and noncanonical base pairs (Supplemental Fig. S1). Nonetheless, due to its high molecular weight (37.8 kDa), NMR spectra of OxyS suffer from signal broadening and overlap. To overcome this limitation, we adopted the divide and conquer approach, individually studied the segments of OxyS which are predicted (Zuker 2003) to adopt stem–loops SL1, SL2, and SL3 (Supplemental Fig. S2) and subsequently compared the results to OxyS. The sequences of individual stem–loops SL1, SL2, and SL3 were extended by single nucleotides at both 5′ and 3′ ends to protect the terminal base pairs from the solvent exchange and facilitate the detection of their imino protons.
We first focused on SL3, which spans nucleotides 91–109 of OxyS and conducted a series of homonuclear and heteronuclear NMR experiments to obtain crucial information on its structure. Guanines and uracils involved in different types of base pairs and mismatches can be distinguished by characteristic 1H and 15N chemical shifts of their imino groups. Analysis of 1H–15N SF-HMQC spectra acquired at 5°C (Fig. 2A) revealed seven narrow cross-peaks suggesting the formation of Watson–Crick base pairs and one weak upfield imino resonance (10.9 ppm) suggesting the presence of the U90·U110 mismatch. All observed imino resonances, except for U90 and U110, were assigned by analyzing the JR-NOESY spectrum (Fig. 2B). The presence of the U90·U110 mismatch was investigated by extending SL3 with an additional A·U base pair (SL3ext, Supplemental Table S1). The imino proton signal of SL3ext at 10.8 ppm corresponds to either U90/U110 or both. A cross-peak between imino proton signals of U90/U110 and G91 in the NOESY spectrum of SL3ext (Supplemental Fig. S3A) indicates the transient formation of U90·U110 mismatch. Weak imino resonances, which were only present in 1D NMR spectra of SL3 at 5°C, were unambiguously assigned to U98 and G102 with site-specific isotopic enrichment (Supplemental Fig. S3B). However, due to the broadness and low intensity of these resonances, we conclude that the G102·U98 base pair is formed only transiently. Assignment of SL3 nonexchangeable proton resonances was obtained from a NOESY spectrum (Fig. 2C) and a 1H–13C HSQC spectrum at 25°C (Supplemental Fig. S4A). The sequential walk between aromatic H6/H8 protons and ribose H1′ protons was traced for nucleotides U90 to C97 and A104 to U110 located in the stem. The determined secondary structure of SL3 is shown in Figure 2D. The UV melting experiment revealed a mid-transition (T1/2) temperature of 84°C (Supplemental Fig. S5C), which is consistent with the high G·C content of SL3.
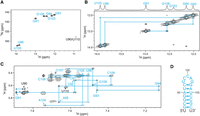
NMR structural characterization of SL3. (A) 1H–15N SF-HMQC spectrum acquired at 5°C. (B) Imino–imino region of JR-NOESY spectrum (τm = 200 msec) acquired at 5°C. Imino–imino contacts are denoted with blue lines. (C) Aromatic–anomeric region of NOESY spectrum (τm = 250 msec) with traced sequential connectivities, acquired at 25°C. (D) Secondary structure of SL3. Overhangs at 5′- and 3′-end are in black. Spectra were acquired at 1 mM RNA concentration, 15 mM Na-phosphate buffer, 30 mM NaCl, and pH 6 in 90% H2O and 10% 2H2O on a 600 MHz NMR spectrometer.
Next, we studied SL2 spanning nucleotides 50–63 of OxyS. Four narrow imino cross-peaks were observed in the 1H–15N HMQC spectra at 5°C (Fig. 3A) and were unambiguously assigned to G50, G52, U53, and U62 based on their imino–imino connectivities in a JR-NOESY spectrum at 5°C (Fig. 3B). Additionally, a weak imino cross-peak was observed in the 1H–15N SF-HMQC spectrum at 13.3 ppm, but lacked NOE contacts to other imino resonances in JR-NOESY spectrum. It was assigned to U54 based on a strong NOE contact to H2 of A59 in the NOESY spectrum. Nonexchangeable protons were assigned using NOESY and 1H–13C HSQC spectra (Fig. 3C; Supplemental Fig. S4B) at 25°C. A sequential walk was traced for all nucleotides. The determined secondary structure of SL2 is shown in Figure 3D. The UV melting experiment showed that SL2 exhibits a mid-transition temperature (T1/2) of 57°C (Supplemental Fig. S5B). At 25°C, imino resonances of U53 and U54 were broadened to baseline indicating the dynamic opening of A·U base pairs adjacent to the loop (Supplemental Fig. S6).
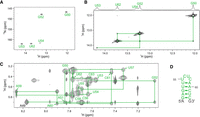
NMR structural characterization of SL2. (A) 1H–15N SF-HMQC spectrum acquired at 5°C. (B) Imino–imino region of JR-NOESY spectrum (τm = 200 msec) acquired at 5°C. Imino–imino contacts are denoted with green lines. (C) Aromatic–anomeric region of NOESY spectrum (τm = 250 msec) with traced sequential connectivities, acquired at 25°C. (D) Secondary structure of SL2. Overhangs at 5′- and 3′-end are in black. Spectra were acquired at 1 mM RNA concentration, 15 mM Na-phosphate buffer, 30 mM NaCl, and pH 6 in 90% H2O and 10% 2H2O on a 600 MHz NMR spectrometer.
The largest stem–loop, SL1, spans nucleotides 1–47 of OxyS. Nucleotides 1–12 and 37–47 form a stem with bulged A8 and imino resonances of nucleotides G1, G6, G43, U44, U45, and U46 in the lower stem (Fig. 4A, purple) were assigned by analyzing a JR-NOESY spectrum (Fig. 4B). Imino resonances of G7 and G9 were not observed, likely due to increased exchange with solvent resulting from the adjacent A8 bulge. To facilitate the assignment of the upper part of SL1, we prepared a shorter construct spanning nucleotides 9–40 (SL1Δ17) (Fig. 4A, orange) which adopts an identical fold as corresponding nucleotides in SL1, as indicated by the similar pattern of imino and aromatic proton resonances in the 1D 1H and NOESY spectra (Supplemental Fig. S7). The imino resonances of G12, U17, U19, U20, U28, U29, U34, U38, and G39 (Fig. 4C) were unambiguously assigned by site-specific isotopic labeling of SL1Δ17 (Supplemental Fig. S7D). The remaining imino resonances were assigned by analyzing and comparing JR-NOESY spectra of SL1Δ17 and SL1. Sequential assignment of SL1 was obtained by comparing its NOESY spectrum with the spectrum of SL1Δ17, which displayed almost identical aromatic and anomeric chemical shifts or corresponding resonances (Supplemental Fig. S7C). The sequential walk was traced for nucleotides G1–G12, A14–C16, A23–C27, U29–A36, and G39–U44 (Fig. 4D). The UV melting experiment revealed a mid-transition (T1/2) temperature of 52°C (Supplemental Fig. S5A).
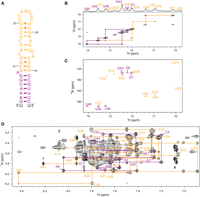
NMR structural characterization of SL1. (A) Secondary structure of SL1. Truncated construct SL1Δ17 is colored in orange and the remaining nucleotides are in purple. Overhangs at 5′- and 3′-end are in black. (B) Imino–imino region of JR-NOESY spectrum (τm = 200 msec) of SL1, acquired at 5°C. Imino–imino contacts are denoted with purple and orange lines. (C) 1H–15N SF-HMQC spectrum of SL1, acquired at 5°C. (D) Aromatic–anomeric region of NOESY spectrum (τm = 250 msec) of SL1 with traced sequential connectivities, acquired at 25°C. Spectra were acquired at 1 mM RNA oligonucleotide, 15 mM Na-phosphate buffer, 30 mM NaCl, and pH 6 in 90% H2O and 10% 2H2O on 600 and 800 MHz NMR spectrometers.
OxyS is comprised of four stem–loops
The structure of the 110 nt OxyS was studied with the use of a uniformly 13C, 15N labeled OxyS RNA sample. In the JR-NOESY spectrum of OxyS at 5°C, several imino–imino connectivities were traced (Fig. 5A) and assigned by comparing them with JR-NOESY spectra of SL1, SL2, and SL3. Remarkable similarities in the patterns of imino–imino connectivities were observed between the JR-NOESY spectra of individual stem–loops and OxyS, suggesting that the structural features of SL1, SL2, and SL3 are fully retained in OxyS. The 2D 1H–15N HNN-COSY experiment provided evidence of canonical base-pairing as well as assignment of imino protons involved in noncanonical U·U and G·U mismatches (Fig. 5B). By comparing heteronuclear spectra of individual stem–loops and OxyS (Supplemental Fig. S8), several resonances were identified (denoted in red in Supplemental Fig. S8A) which could not be attributed to SL1, SL2, or SL3. In the JR-NOESY spectrum of OxyS, these resonances are involved in an isolated imino–imino walk (Fig. 5A, red line), suggesting the presence of an additional stem–loop SL4, spanning nucleotides 72–89 of OxyS.
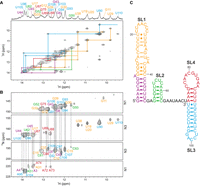
NMR characterization of 110 nt OxyS RNA. The color codes follow the colors used in the studies of individual stem–loops. (A) Imino–imino region of JR-NOESY spectrum (τm = 200 msec) with traced imino–imino contacts, acquired at 5°C. (B) 1H–15N HNN-COSY spectrum acquired at 5°C. Resonances of donor and acceptor nitrogens involved in hydrogen bonds, specifically G(N1)-C(N3) and U(N3)-A(N1), are connected with dashed gray lines. (C) NMR-derived secondary structure of OxyS. Spectra were acquired at 1 mM RNA concentrations, 15 mM Na-phosphate buffer, 30 mM NaCl, and pH 6 in 90% H2O and 10% 2H2O on a 600 MHz NMR spectrometer.
The oligonucleotide SL4 (nucleotides 72–89, Supplemental Table S1) could not be used for the structure determination due to its tendency to form a homodimer. To avoid dimerization, we prepared the oligonucleotide SL4 + SL3 (nucleotides 71–110, Supplemental Table S1), which also contains the sequence of SL3. Analysis of 1H–15N HMQC spectra of SL4 + SL3 at 5°C (Supplemental Fig. S9A) revealed 12 imino resonances and established the identity of base pairs. In the JR-NOESY spectrum of SL4 + SL3 (Supplemental Fig. S9B), two partial imino–imino walks were traced. First imino–imino walk (denoted in blue in Supplemental Fig. S9B) including nucleotides U90, G91, G93, G94, U96, G103, U105, G108, and U110 was assigned to SL3. The second imino–imino walk (denoted in red in Supplemental Fig. S9B) involving nucleotides G75, U87, and U88 was assigned to SL4. Equivalent NOE connectivities between imino protons were identified in the JR-NOESY spectra of SL4 + SL3 and OxyS, confirming that SL4 is well-defined and present in OxyS. The determined secondary structure of OxyS is shown in Figure 5C.
Furthermore, comparing the NMR data of individual stem–loops and OxyS provided insight into the spatial arrangement of SL1, SL2, SL3, and SL4. The imino resonances of SL1 have exceptionally similar spectral properties in isolated SL1 and in OxyS, indicating that SL1 does not have tertiary contacts with other parts of OxyS. SL2 displays sharp and intense imino signals when isolated, while within OxyS, its resonances are broader, suggesting that SL2 is poorly structured in the OxyS. The imino signal of U90 originating from the terminal U90·U110 mismatch in SL3 is among the strongest imino signals in the JR-NOESY spectrum of OxyS, while it is considerably weaker in the spectrum of SL3ext, indicating that within OxyS U90 is protected from exchange with solvent. The slower exchange with solvent likely originates from the coaxial stacking of SL3 and SL4. Moreover, in the spectra of OxyS, the imino signal of U90 is shifted upfield (10.4 ppm) compared to the imino signal of U90 in SL3ext (10.8 ppm), demonstrating that the presence of SL4 significantly changes the chemical environment of U90.
Analysis of the UV melting curve of SL4 + SL3 showed two melting transitions at 43°C and 81°C (Supplemental Fig. S5C), corresponding to the unfolding of SL4 and SL3, respectively. For OxyS, two melting transitions were identified (Supplemental Fig. S5D). The melting transition at 78°C corresponds to the unfolding of SL3, and the one at 52°C corresponds to the unfolding of SL1, SL2, and SL4.
3D structure of OxyS adopts a boomerang-like shape
To gain information about the overall shape and dimensions of OxyS, we resorted to SAXS (Fig. 6). Inspection of the size exclusion chromatography (SEC) profile (Supplemental Fig. S10) demonstrated that the OxyS sample is monodisperse and homogenous. Consequently, the frames in the peak regime (Supplemental Fig. S11) have been averaged and the appropriate background has been subtracted. The resulting SEC-SAXS pattern has been compared to the batch pattern with respect to (i) the Guinier radius as well as (ii) the overall shape (Fig. 6D; Supplemental Fig. S12). As both patterns besides some differences at the high q-regime overlap by rescaling, due to the higher statistical quality, only the batch data have been used for further analysis. The dimensionless Kratky plot (Fig. 6B) indicates a more or less overall compactness of the OxyS. The radius of gyration (Rg) was determined to be 47.6 ± 3.8 Å (Fig. 6D) and the maximum distance (Dmax) of the pair distance distribution function calculated with GNOM is found to be 155 Å (Fig. 6C).
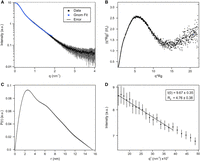
SAXS results of OxyS. Experimental SAXS data is in black, error bars in gray, and linear fit in blue. (A) log(I) versus q plot. (B) Kratky plot. (C) P(r) distribution. (D) Guinier plot with linear regression. The intensity scale is logarithmic.
The ab initio reconstruction was followed by averaging and clustering of 10 envelopes. The averaged envelope of the most representative cluster is elongated, which indicates that OxyS adopts an extended structure. The scattering curve of the averaged reconstructed molecular envelope showed a good agreement with SAXS data (χ2 = 0.54). The reproducibility of ab initio calculations was evaluated with normalized spatial discrepancy (NSD), which measures how much the averaged envelopes differ from each other. The averaged molecular envelope of OxyS had an NSD of 0.933 ± 0.187. The averaged reconstructed molecular envelope has an extended boomerang-like shape with two arms, which are placed at a 130° angle (Fig. 7A; Supplemental Fig. S13). The long arm is straight and ≈98 Å in length, whereas the short arm resembling two joint globules is ≈69 Å long. The cross-sectional diameter of both arms is ≈35 Å, which is wide enough to accommodate an A-form RNA helix.
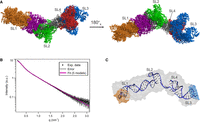
(A) The final ensemble of five 3D models of OxyS (models 1–2, 2–1, 3–1, 4–2, 9–2) is shown with 180° rotation around the x-axis. The color codes follow the colors used in the studies of the individual stem–loops. (B) Experimental SAXS data points (black) and corresponding error bars (gray) are plotted alongside the fit of the five models in the final ensemble calculated with NNLSJOE (magenta). (C) The representative model of OxyS (model 3–1) superimposed onto the averaged envelope of the most representative cluster (shown in gray). The sites of OxyS–fhlA interaction are indicated on the envelope in orange and blue.
To obtain three-dimensional models of OxyS satisfying both NMR and SAXS experimental data, we used de novo modeling with FARFAR2 (see Materials and Methods). The NMR-derived secondary structure of OxyS was used as an input for de novo modeling. The Rg and χ2 values of the models from the FARFAR2 conformational library ranged from 22.54 to 36.78 Å and 0.99 to 36.07, respectively. Although several models in the conformational library were in agreement with the shape of the averaged molecular envelope (χ2 ≤ 1.5), the Rg values of the models were nowhere near the experimentally determined value (47.6 ± 3.8 Å), indicating that the models were not sufficiently extended. To expand their conformational space and obtain models with improved fit to the scattering data, we used MD simulations. Ten models with the lowest χ2 values were chosen from the FARFAR2 conformation library and used as initial structures for unbiased MD simulations (Supplemental Table S5; Supplemental Fig. S14). Two thousand snapshots were obtained from each simulation trajectory and CRYSOL was used to evaluate their fit to the experimental scattering data. Five of the 10 trajectories contained models which satisfied our selection criteria (Rg ≥ 40 Å and χ2 ≤ 1.5). Two models were selected from each of these five trajectories, first with the lowest χ2 value and second with Rg closest to the experimentally determined value (Supplemental Table S6). The selected models were superimposed onto the averaged envelope of the most representative cluster (Supplemental Fig. S15) using SUPCOMB (Kozin and Svergun 2001). All 10 models respect the overall shape defined by the averaged envelope and show an improved fit compared to the FARFAR2 models (Supplemental Fig. S16). The verification of these models was performed using the ATSAS program NNLSJOE in order to determine the optimum ensemble size, selection of the representative models and their fraction by simultaneously best describing the experimental SAXS data. Relative contributions, structural parameters (Rg, Dmax), hydrodynamic radius Rh and fit (χ2) of the models in the final ensemble are given in Supplemental Table S7. The fraction weighted hydrodynamic radius Rh of the ensemble with a value of 3.59 nm corresponds well to the Rh value of 3.43 ± 0.05 nm measured with the DLS in the peak regime during elution with SEC (Supplemental Fig. S10). Optimization with NNLSJOE resulted in the final ensemble of five 3D models of OxyS (models 1–2, 2–1, 3–1, 4–2, 9–2), which best describe the experimental SAXS data (Fig. 7A,B) and have a fit of χ2 = 0.22.
The Rg and χ2 values of the five models in the final ensemble ranged from 41.63 to 45.23 Å and 0.12 to 0.58, respectively (Supplemental Table S6). A certain degree of variability in relative orientations of individual stem–loops is observed in the final ensemble. Model 3–1 being a member of the final ensemble optimized with NNLSJOE, has been selected as the representative model (Fig. 7C) due to the smallest χ2 value in the single component fits (Supplemental Table S6). The superimposition of the representative model onto the averaged envelope shows that SL1 and SL2 constitute the long arm, whereas SL3 and SL4 constitute the short arm of the averaged envelope. Similar superimpositions were obtained for all models of the final ensemble with the exception of model 2–1, for which the long arm is constituted by SL2, SL3, SL4, and partially SL1, whereas the short arm is constituted solely by SL1 (Supplemental Fig. S15). The coaxial stacking of SL3 and SL4, supported by the strong upfield shifted imino signal of U90 in NMR spectra of OxyS, is observed in all models of the final ensemble.
fhlA mRNA interacts with stem–loops SL1 and SL3 in OxyS
We have examined the details of OxyS–fhlA interaction with NMR by designing short oligonucleotides, which comprise the interaction sites, while preserving the secondary structures. The nucleotides involved in the interaction reside mostly within loop regions of both OxyS and fhlA (Supplemental Fig. S17). First, we focused on the interaction between SL1 of OxyS and the CDS site of fhlA (Supplemental Fig. S17, nucleotides in pink and blue) using model oligonucleotides fhlA1 and SL1Δ17 (Supplemental Table S1; Supplemental Fig. S18). Based on the complementarity, the interaction is expected to involve nucleotides 22–30 of SL1 and nucleotides 88–96 of fhlA1. We determined the secondary structure of stem–loop fhlA1, which spans nucleotides 81–100 of the fhlA 5′ UTR region (Supplemental Fig. S17A) by analyzing the NOESY spectrum of fhlA1 recorded at 25°C (Supplemental Fig. S19). The experimentally determined secondary structure of fhlA1 is shown in Supplemental Figure S18B.
Through initial screening of experimental conditions, we determined that 5 mM of Mg2+ cations was required for the base-pairing interaction to occur. Structural analysis revealed that the addition of Mg2+ cations did not change the structure of SL1Δ17, but it destabilized the closing C88–G93 base pair in fhlA1, making nucleotides C88 and G93 available for the interaction (Supplemental Fig. S20A). Interaction between fhlA1 and SL1Δ17 was confirmed by the appearance of six new imino signals in the 1D 1H spectrum of fhlA1 and SL1Δ17, which were mixed in equimolar amount (Fig. 8A, signals marked in magenta and orange). The rest of the imino signals corresponds to nucleotides from the stems of SL1Δ17 and fhlA1, indicating that their original secondary structures are preserved in the interaction complex. To identify nucleotides in fhlA1 and SL1Δ17 to which the six new imino signals correspond, we used residue-specific 15N labeling of guanine and uracil nucleotides. We prepared an array of samples in which a site-specifically labeled oligonucleotide was mixed with its interacting nonlabeled oligonucleotide in an equimolar ratio. Six out of nine labeled samples showed new signals in the imino region of 1D 15N-edited HSQC spectra (Supplemental Fig. S21). These signals correspond to imino groups of nucleotides G91, G92, and G93 from fhlA1 and nucleotides U28, U29, and G30 from SL1Δ17 confirming the formation of base pairs G91–C27, G92–C26, G93–C25, A90–U28, A89–U29, and C88–G30 in the fhlA1–SL1Δ17 complex (Fig. 8C,E). Nucleotides U94, U95, G96 from fhlA1 and U22, A23, A24 from SL1Δ17 are not involved in intermolecular base-pairing. Interestingly, G30 from SL1Δ17 displays two imino signals, first corresponding to the closing intramolecular G30–C18 base pair and second to the intermolecular C88–G30 base pair (Supplemental Fig. S21B). The closing G30–C18 base pair is, therefore, likely destabilized in the presence of fhlA1 to facilitate intermolecular base-pairing.
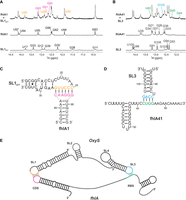
Interaction of OxyS with CDS and RBS regions of fhlA. (A) Imino region of 1D 1H spectra of SL1Δ17, fhlA1, and their equimolar mixture. Six new imino signals originating from the interaction are colored in magenta and orange. (B) Imino region of 1D 1H spectra of SL3, fhlA41 and their equimolar mixture. Four new imino signals originating from the interaction are colored in green and blue. Spectra were acquired at 25°C, 15 mM Na-phosphate buffer, 30 mM NaCl, 5 mM MgCl2, and pH 6 in with 90% H2O and 10% 2H2O on a 600 MHz NMR spectrometer. RNA concentrations varied from 0.5 to 1.25 mM for SL1Δ17, fhlA1, SL3, and fhlA41, whereas it was set to 0.2 mM per strand for the mixtures. (C) Secondary structure representation of fhlA1–SL1Δ17 complex. Nucleotides involved in intermolecular base-pairing are colored in magenta and orange. (D) Secondary structure representation of fhlA41–SL3 complex. Nucleotides involved in intermolecular base-pairing are colored in green and blue. (E) Schematic of the bipartite OxyS–fhlA interaction.
We then focused on the interaction between SL3 of OxyS and RBS region of fhlA (Supplemental Fig. S17, nucleotides in blue and green), using oligonucleotides SL3 and fhlA41 (Supplemental Fig. S18). Based on the complementarity, the interaction is expected to involve nucleotides 98–104 of OxyS and nucleotides 40–46 of the fhlA 5′ UTR. Two different structures of the fhlA RBS region have previously been reported (Argaman and Altuvia 2000; Salim and Feig 2010). In the first structure, nucleotides 40–46 (numbered −15 to −9 in Argaman and Altuvia 2000) reside in the upper part of the stem and apical loop (Argaman and Altuvia 2000). In the second structure, nucleotides 40–46 reside in the stem and single-stranded region (Salim and Feig 2010). We designed constructs fhlA41 and fhlA63 (Supplemental Table S1; Supplemental Fig. S22), which mimic the two previously reported structures of fhlA RBS region (Argaman and Altuvia 2000; Salim and Feig 2010). A comparison of 1D 1H NMR spectra revealed that both constructs adopt the same fold (Supplemental Fig. S22C). We continued our studies with the shorter oligonucleotide fhlA41, which spans nucleotides 16–56 of the fhlA 5′ UTR region (Supplemental Fig. S17A). The secondary structure of fhlA41 in the presence of 5 mM Mg2+ cations (Supplemental Fig. S18C) was determined by the analysis of JR-NOESY spectra and the use of site-specific isotopic labeling (Supplemental Fig. S22). Nucleotides 21–37 form a stem–loop, whereas the rest of the fhlA41 construct, including nucleotides 40–46, is unstructured. In the presence of Mg2+ cations, the destabilization of G102·U98 mismatch was observed in the structure of SL3 (Supplemental Fig. S20B), which makes G102 and U98 available for base-pairing with fhlA41. Interaction between fhlA41 and SL3 was confirmed by the appearance of four new imino signals in the 1D 1H spectrum of fhlA41 and SL3, which were mixed in equimolar amount (Fig. 8B, signals marked in green and blue). The remaining imino signals correspond to nucleotides from the stems of fhlA41 and SL3, suggesting that their original secondary structures are preserved in the interaction complex. The identity of four new imino signals was investigated by residue-specific 15N labeling of guanine and uracil nucleotides. A set of samples was prepared in which a site-specifically labeled oligonucleotide was mixed with its interacting nonlabeled oligonucleotide in an equimolar ratio. Four out of seven samples showed new signals in the imino region of 1D 15N-edited HSQC spectra (Supplemental Fig. S23). These signals correspond to imino groups of nucleotides U43, G44, and G45 from fhlA41 and nucleotide G102 from SL3 confirming the formation of base pairs U43–A101, G44–C100, G45–C99, and C42–G102 in the fhlA41–SL3 complex (Fig. 8D,E). Nucleotides U40, C41, A46 from fhlA41 and U98, G103, A104 from SL3 are not involved in the intermolecular base-pairing.
DISCUSSION
Trans-encoded bacterial sRNAs are noncoding and typically silence genes by a mechanism involving base-pairing with the target mRNA. This type of RNA–RNA interaction is crucial for the regulatory activity of OxyS, which represses the translation of mRNA fhlA by a bipartite base-pairing interaction. A kissing complex has been proposed to form when stem–loops SL1 and SL3 of OxyS base pair with CDS and RBS of fhlA, respectively (Argaman and Altuvia 2000). Notably, the structure of OxyS has not been determined by a high-resolution method and studies involving OxyS still rely on the secondary structure of OxyS containing three stem–loops, which was obtained by prediction tools and chemical probing (Zhang et al. 1998; Argaman and Altuvia 2000; Henderson et al. 2013; Wang et al. 2015; Barshishat et al. 2018; Cai et al. 2022). Using NMR, SAXS, and molecular modeling, we reveal that OxyS comprises four stem–loops and propose their possible spatial arrangement.
The divide and conquer approach enabled us to determine the secondary structure of OxyS by NMR. We describe an additional stem–loop SL4 formed by nucleotides 72–89. NMR analysis suggests that stem–loops SL4 and SL3 are coaxially stacked. On the other hand, no evidence of coaxial stacking between SL1 and SL2 was observed. The solution scattering data shows that OxyS has an elongated boomerang-like shape with two arms. All models of the final ensemble respect the overall shape obtained from the solution scattering data. We show that χ2 values of the models in the final ensemble are comparable despite a certain degree of variability in relative orientations of the individual stem–loops. Nevertheless, the conformational space of OxyS is large and complex due to its molecular weight and the presence of an unstructured linker. The authors are fully aware that, despite a large ensemble obtained from de novo modeling, some conformations might have been missed. Furthermore, the motions of individual stem–loops are beyond the timescale of MD simulations, and SAXS data is subjected to ensemble averaging. While our models have atomic resolution, they should not be regarded as high-resolution structures. However, the models we obtained are in good agreement with experimental data and describe the overall shape of OxyS.
SL1 and SL3 are spatially located at the two extremes of the 155 Å long structure of OxyS. The newly identified SL4 significantly shortens the nonstructured linker from 26 (G64–U89) to only 8 nt (G64–U71), which brings SL1 and SL3 closer together. Specific spacing between SL1 and SL3 could be important for the interaction with fhlA. Particularly, since it is known that optimal repression of fhlA translation is achieved upon interaction with both SL1 and SL3 simultaneously (Altuvia et al. 1998; Argaman and Altuvia 2000). Moreover, due to its shorter length, the linker might act as a hinge between the two arms of the boomerang-like structure of OxyS, allowing for precise adjustment of the distance between SL1 and SL3 and their relative orientation.
Enhanced interaction between OxyS and fhlA has been observed when the chaperone Hfq is present in vitro or in vivo (Zhang et al. 2002). Hfq is a homohexamer stabilized by flexible C-terminal domains and contains four RNA binding surfaces, which recognize both sRNAs and their mRNA targets (Updegrove et al. 2016; Santiago-Frangos and Woodson 2018; Sarni et al. 2022). The proximal and distal faces of Hfq preferentially bind U- and A-rich single-stranded regions of sRNAs, respectively, whereas the lateral rim of Hfq binds to both A- and U-rich sequences. Indeed, the A-rich (A65–A74) and U-rich (U87–U90) motifs of OxyS were shown to interact with the distal face and lateral rim of Hfq, respectively (Wang et al. 2015; Cai et al. 2022). Previous studies have shown that for many sRNAs including OxyS, an AU-rich single-stranded linker region followed by one or two stem–loops and a poly(U) tail are crucial for Hfq binding (Zhang et al. 2002; Ishikawa et al. 2012; Schulz et al. 2017). However, we demonstrate that regions A72–A74 and U87–U90 are not single-stranded, but adopt stem–loops SL4 and SL3. We speculate that Hfq might recognize SL4, which carries the A- and U-rich motifs and binds to it with its distal face and lateral rim, respectively. This would be in agreement with reports that Hfq recognizes and binds AU-rich motifs, but lacks sequence specificity (Zhang et al. 2002; Updegrove et al. 2016; Schulz et al. 2017). Recognition of a stem–loop could also provide rationale for the enhanced specificity of Hfq binding to sRNAs compared to other RNAs, which do not interact with the lateral rim (Sauer et al. 2012). The 3D models of OxyS suggest that the presence of SL4 exposes the U-rich motif (U87–U90), which might be important for recognition by lateral rim of Hfq.
It has been proposed that the enhanced interaction between OxyS and fhlA is due to the RNA remodeling activity of Hfq (Henderson et al. 2013). In a recent study, it was shown that Hfq interacts with multiple parts of OxyS and changes its secondary structure (Cai et al. 2022). The study suggests that OxyS wraps around Hfq, the distance between SL1 and SL3 is shortened, whereas SL2 is destabilized and likely unfolds. In a different study of OxyS, SL2 was shown to be unstable and easily disrupted upon Hfq binding (Zhang et al. 2002). Both of these findings are in accordance with our data, which show that SL2 is poorly structured and exhibits higher flexibility. Furthermore, Hfq binding to OxyS might unfold SL4, given its low thermal stability and the fact that most nucleotides constituting the stem of SL4 interact with Hfq. Regardless, our work demonstrates that even in the absence of Hfq, SL1, and SL3 interact with complementary regions of fhlA. Based on the complementarity, 9 bp were expected to form in the fhlA1–SL1Δ17 complex and six base pairs in the fhlA41–SL3 complex. Our NMR data showed the formation of 6 bp in fhlA1–SL1Δ17 and four base pairs in fhlA41–SL3. Only nucleotides that constitute the loops and single-stranded regions engage in the intermolecular base-pairing in fhlA1–SL1Δ17 and fhlA41–SL3 complexes. The nucleotides constituting the stems (i.e., U94, U95, G96 of fhlA1 and U98, G103 of SL3) are unavailable for intermolecular base-pairing and, indeed, are not involved in the interaction. It is important to note that the presence of Mg2+ cations is required for the formation of fhlA1–SL1Δ17 and fhlA41–SL3 complexes, as it partially unfolds fhlA1 and SL3. It is not uncommon for sRNAs and mRNAs to partially unfold to facilitate the formation of a thermodynamically favorable heteroduplex (Wu et al. 2017; Felden and Augagneur 2021). However, Mg2+ cations do not unfold the stem–loops to an extent that would enable intermolecular base-pairing of all complementary nucleotides, which indicates that the opening of fhlA1 and SL3 stems might not be spontaneous in vivo.
Many fundamental cellular processes, including the response to oxidative stress, are regulated by noncoding sRNAs. We have used an integrated structural biology approach and combined NMR spectroscopy, SAXS, de novo modeling and unbiased MD simulations to determine the secondary structure and obtain three-dimensional models of 110 nt sRNA OxyS. We show that OxyS adopts an extended boomerang-like structure with four stem–loops, one of which has not been identified before. Using NMR, we have confirmed the interaction between OxyS and one of its main targets, fhlA. We demonstrated that the OxyS–fhlA complex is stabilized by 10 Watson–Crick base pairs, determined the specific nucleotides involved and characterized the accompanying structural changes. Our results suggest that OxyS is able to adopt multiple conformations which slightly differ in the relative orientation of the four stem–loops, but all share the same secondary structure, an overall shape and agreement with the molecular envelope from SAXS. The conformational plasticity may play a key role in the capability of OxyS to interact with multiple targets, a feature that often entails a flexible structure. The 3D structure of OxyS is an important step toward understanding its regulatory role in stress response. Furthermore, the AU-rich internal stem–loop SL4 carrying the Hfq binding motif, as well as other structural features of OxyS, could point to common traits found among noncoding sRNAs.
MATERIALS AND METHODS
Preparation of RNA samples
Natural abundance and uniformly 13C, 15N labeled full-length OxyS was synthesized by in vitro transcription (IVT) using T7 polymerase (NEB) and a pEX-A128 plasmid containing the OxyS sequence and the Hind III restriction site. Due to IVT and enzymatic linearization, an additional nucleotide is present at the 5′- and 3′-end of the OxyS sequence (Supplemental Table S1). Plasmids were linearized by incubation with the Hind III restriction enzyme (NEB) at 65°C. A total of 10 mL IVT reaction mixtures contained 40 µg/mL linearized plasmid, 7000 U/mL T7 RNA polymerase, 8 mM each rNTP, 40 mM Tris-HCl (pH 8.1), 1 mM spermidine, 5 mM dithiothreitol, and 45 mM MgCl2. The optimal concentration of MgCl2 was determined in small-scale reactions. IVT mixtures were incubated at 37°C for 16 h and then quenched by the addition of 65 mM EDTA. Transcribed RNA was purified from the crude reaction mixture by weak anion-exchange chromatography using an AKTA FPLC system equipped with a DEAE-Sepharose column (Easton et al. 2010). Purified RNA was desalted on a Sephadex G25 column, dried on a vacuum centrifuge and dissolved in the NMR buffer (90% H2O and 10% 2H2O, 20 mM sodium phosphate buffer pH 6, 30 mM NaCl).
Shorter oligonucleotides were synthesized chemically on a K&A Laborgeraete DNA/RNA Synthesizer H-8 using standard phosphoramidite chemistry. The sequences of all isolated stem–loops were extended by one nucleotide at both ends (SL1+2, SL2+2, SL3+2) to protect the terminal base pair from the exchange with solvent (Supplemental Table S1). Site-specific isotopically enriched samples contained 20% 15N1 and 15N3 for guanine and uracil nucleotides (Silantes), respectively. Oligonucleotides were deprotected in AMA (1:1 mixture of aqueous ammonium hydroxide and aqueous methylamine) at room temperature for 20 min, followed by incubation at 65°C for 10 min, and dried on a vacuum centrifuge. To remove the TBDMS protecting group, samples were redissolved in DMSO, followed by the addition of triethylamine and triethylamine trihydrofluoride and incubation at 65°C for 2.5 h. The reaction was stopped by the addition of a quenching buffer (Glen Research). Samples were purified using Glen-Pak RNA purification cartridges (Glen Research), following the manufacturer's purification protocol, dried on a vacuum centrifuge, redissolved in 1 mL of water and desalted using FPLC equipped with a Sephadex G25 column. Afterward, RNA was refolded by denaturation at 95°C for 10 min, 10-fold dilution by ice-cold MQ water, incubation on ice for 1 h, and exchange against the NMR buffer (90% H2O, 10% 2H2O, 15 mM sodium phosphate buffer pH 6, 30 mM NaCl) using Amicon ultrafilter concentrators (MWCO 3000 Da). RNA concentrations were determined by measuring UV absorption at 260 nm and the final oligonucleotide concentrations were in the range from 0.5 to 1.0 mM, unless stated otherwise.
NMR spectroscopy
NMR spectra were acquired on Bruker AVANCE NEO 600 MHz NMR spectrometers and an Agilent Technologies VNMRS 800 MHz NMR spectrometer. One-dimensional 1H spectra were acquired with excitation sculpting water suppression using Bruker's zgesgp pulse sequence. Two-dimensional 1H–1H NOESY spectra with excitation sculpting water suppression were used for the assignment of aromatic and anomeric resonances, whereas 2D 1H–1H JR-NOESY spectra with jump-return water suppression were used for the assignment of exchangeable imino resonances. Two-dimensional 1H–1H NOESY spectra were acquired with 150, 200, and 250 msec mixing times using Bruker's noesyesgpph and Agilent's DPFGSE NOESY pulse sequence. Two-dimensional 1H–1H JR-NOESY spectra were acquired with 200 msec mixing time using Bruker's noesygpphjrrs pulse sequence. 1H–13C HSQC and 1H–15N SF-HMQC spectra were acquired on natural abundance samples using Bruker's hsqcetgp and sfhmqcf3gpph pulse sequences, respectively. 1H–15N SF-HMQC spectra were acquired with a relaxation delay of 0.25 sec, minimum of 2048 transients and 80 increments. The chemical shift offset and bandwidth were adjusted for each sample, based on the position of imino resonances. Two-dimensional 1H–15N BEST-TROSY and 1H–15N BEST-TROSY-HNN-COSY spectra were acquired on uniformly 13C and 15N labeled samples using Bruker's b_trosyetf3gpsi.2 and na_b_trhnncosygpph pulse sequences, respectively. Two-dimensional 1H–15N BEST-TROSY was acquired with a chemical shift offset of 12 ppm, bandwidth of 6 ppm, relaxation delay of 0.30 sec, 128 transients and 256 increments. 1H–15N BEST-TROSY-HNN-COSY spectra were acquired with a relaxation delay of 0.30 sec, 800 transients and 160 increments. One-dimensional 15N-edited HSQC spectra were acquired on partially site-specific 15N enriched RNA samples using Bruker's hsqcetf3gp pulse sequence with a minimum of 4096 transients. NMR data were processed with VNMRJ (Varian), NMRpipe (Delaglio et al. 1995) and TopSpin version 4.0.7 (Bruker) software packages. NMR spectra were analyzed using MestReNova and NMRFAM-Sparky (Lee et al. 2015) programs.
UV melting profiles
UV melting experiments were carried out on a Varian CARY-100 BIO UV–VIS spectrophotometer using 1 cm path length cells. Samples were heated/cooled at a rate of 0.1°C/min in the range from 15°C to 95°C and absorbance at 260 nm was measured. Samples for UV melting experiments were prepared by diluting NMR samples with a blank solution (30 mM NaCl and 15 mM Na-phosphate, pH 6). Melting temperatures were determined from the second derivative of A260 versus the temperature plot using Origin.
SAXS data collection and analysis
The RNA sample for SAXS measurements was prepared by IVT and purified as described in the Preparation of RNA samples section. RNA was then refolded by denaturation at 95°C for 10 min, diluted 10-fold by ice-cold MQ water, incubated on ice for 1 h, and exchanged against SAXS buffer (50 mM HEPES buffer pH 6.8, 50 mM NaCl) using Amicon ultrafilter concentrators (MWCO 3000 Da). The RNA sample was concentrated to 200 µL and a concentration of 4.5 mg/mL. Parameters and equipment for SAXS data collection are given in Supplemental Table S2. Software for data analysis and processing is detailed in Supplemental Table S3. Scattering data were collected at 26°C at the Austrian SAXS beamline of Elettra Sincrotrone-Trieste using the standard capillary setup and the µ-drop autosampler (Amenitsch et al. 1998; Haider et al. 2021). Both measurements have been compared, and due to the higher data quality in the high q-regime of the µ-drop setup, the data have been merged with an overlap regime between 0.57 and 0.84 1/nm. Additionally, SEC measurements have been conducted using the SEC-SAXS setup, which was coupled downstream to a dedicated quartz glass flow-through capillary of 1.5 mm diameter as an X-ray cell. The flow rate was set to 0.35 mL/min and the acquisition was set to 10 sec per frame. The 2D images have been converted to a SAXS pattern using the data pipeline SAXSDOG (Burian et al. 2022). The data have been normalized to 1 sec exposure time, transmission and the variation of the primary intensity. The corresponding sample measurements’ background has been averaged and subtracted. The Guinier and Kratky analysis was performed in ATSAS 2.81 (Franke et al. 2017). The pair distance distribution function was calculated using GNOM (Svergun 1992). The ab initio shape reconstruction of the subtracted data has been executed with DAMMIF ATSAS 3.0.5. (ATSAS online) (Franke and Svergun 2009). The resulting 10 models were averaged into a final envelope using DAMAVER and DAMCLUST (ATSAS online) (Volkov and Svergun 2003; Petoukhov et al. 2012). Optimization of ensembles has been performed with NNLSJOE (non-negative linear least-squares algorithm judging optimization of ensembles) of the ATSAS package 3.3.0. The hydrodynamic radius Rh from the representative models of the ensemble has been calculated with the web-based software package US-SUOMO (Brookes and Rocco 2023).
De novo 3D structure prediction and unbiased MD simulations
The starting structures for unbiased MD simulations were generated as an ensemble of 2389 structures with the FARFAR2 (rna_ denovo) module of the Rosetta software package (Lyskov et al. 2013; Watkins et al. 2020; Watkins and Das 2023). OxyS sequence was used as the input, along with the secondary structure in dot-bracket format derived from NMR observables (Supplemental Table S4). The predicted structures were analyzed with CRYSOL (Svergun et al. 1995) and ranked based on the fit to SAXS data (Rg and χ2 values). Ten structures with the lowest χ2 value (Supplemental Fig. S5) were selected as the starting structure for unbiased MD simulations performed with AMBER18 software using an OL3 force field (Zgarbová et al. 2011). Starting structures were solvated with a 20 Å layer of TIP3P water and neutralized with Na+ ions. Both RNA and explicit solvent were relaxed in six steps of temperature equilibration. The equilibrated systems were subjected to 20 nsec of unbiased constant pressure MD at 300 K. The SHAKE algorithm was used to constrain the bonds involving hydrogen (Ryckaert et al. 1977). No restraints were applied. The nonbonded cutoff was set to 8 Å. All trajectories were stripped of water and Na+ ions and snapshots were created every 10 psec, resulting in 2000 snapshots per simulation trajectory using the cpptraj tool.
DATA DEPOSITION
Experimental SAXS data and ensemble of OxyS 3D models have been deposited in the Small-Angle Scattering Biological Data Bank as entry SASDQP8 (https://www.sasbdb.org/data/SASDQP8/bzsjs8zm83).
SUPPLEMENTAL MATERIAL
Supplemental material is available for this article.
ACKNOWLEDGMENTS
The authors acknowledge CERIC-ERIC for access to the Austrian SAXS beamline and the financial support received from CERIC-ERIC through the internal INTEGRA project. This work was supported by the Slovenian Research Agency (ARRS, grant P1-0242). V.Š. was awarded the “Janko Jamnik Doctoral Scholarship.”
Footnotes
-
Article is online at http://www.rnajournal.org/cgi/doi/10.1261/rna.079618.123.
- Received February 1, 2023.
- Accepted June 18, 2023.
This article is distributed exclusively by the RNA Society for the first 12 months after the full-issue publication date (see http://rnajournal.cshlp.org/site/misc/terms.xhtml). After 12 months, it is available under a Creative Commons License (Attribution-NonCommercial 4.0 International), as described at http://creativecommons.org/licenses/by-nc/4.0/.




