


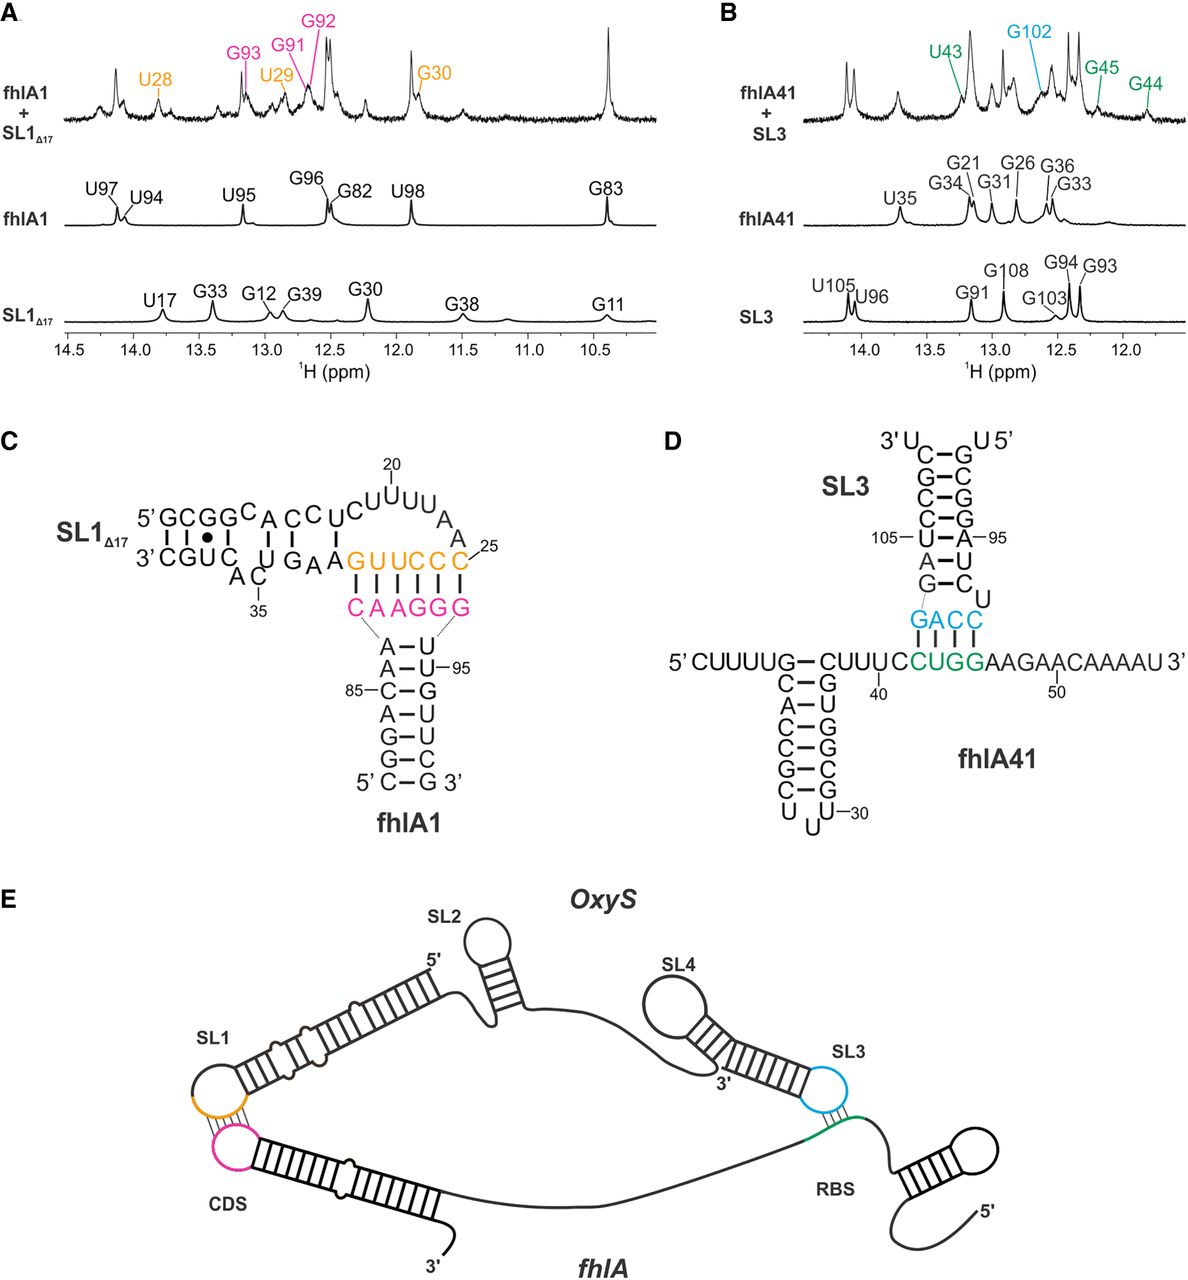
Interaction of OxyS with CDS and RBS regions of fhlA. (A) Imino region of 1D 1H spectra of SL1Δ17, fhlA1, and their equimolar mixture. Six new imino signals originating from the interaction are colored in magenta and orange. (B) Imino region of 1D 1H spectra of SL3, fhlA41 and their equimolar mixture. Four new imino signals originating from the interaction are colored in green and blue. Spectra were acquired at 25°C, 15 mM Na-phosphate buffer, 30 mM NaCl, 5 mM MgCl2, and pH 6 in with 90% H2O and 10% 2H2O on a 600 MHz NMR spectrometer. RNA concentrations varied from 0.5 to 1.25 mM for SL1Δ17, fhlA1, SL3, and fhlA41, whereas it was set to 0.2 mM per strand for the mixtures. (C) Secondary structure representation of fhlA1–SL1Δ17 complex. Nucleotides involved in intermolecular base-pairing are colored in magenta and orange. (D) Secondary structure representation of fhlA41–SL3 complex. Nucleotides involved in intermolecular base-pairing are colored in green and blue. (E) Schematic of the bipartite OxyS–fhlA interaction.




