


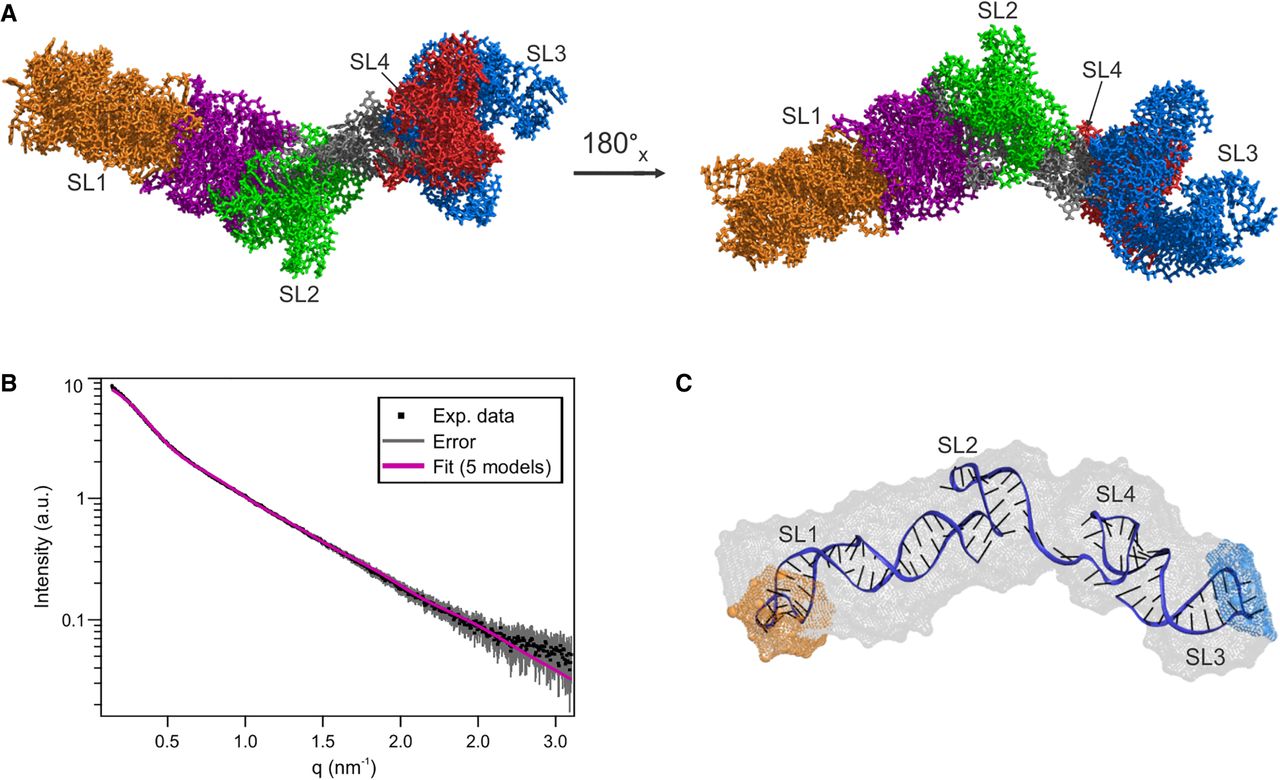
FIGURE 7.
(A) The final ensemble of five 3D models of OxyS (models 1–2, 2–1, 3–1, 4–2, 9–2) is shown with 180° rotation around the x-axis. The color codes follow the colors used in the studies of the individual stem–loops. (B) Experimental SAXS data points (black) and corresponding error bars (gray) are plotted alongside the fit of the five models in the final ensemble calculated with NNLSJOE (magenta). (C) The representative model of OxyS (model 3–1) superimposed onto the averaged envelope of the most representative cluster (shown in gray). The sites of OxyS–fhlA interaction are indicated on the envelope in orange and blue.




